Abstract
The article also investigates the dynamic strength and vibration mechanism of earthquake active regions, and also water pipelines, earthwork embankments when blasting. It has been proven that more stresses occur within the structure due to variations in the deformation and strength indicators of the soil during the interaction of the structure and the soil. The research made use of field tests, Model experiments on a seismic platform and centrifugal modelling methods. The VI-9-8A vibrator and industrial blasting processes were embraced as the source of vibration and different seismometric sensors were embraced in measuring the parameters of vibration. The great impact of the height of embankments and the type of soil on seismic stability is scientifically proved with the help of mathematical formulas. One of the solutions suggested to increase the stability of the pipes is the reinforcement of slopes using reinforced concrete piles. It is mentioned that the results of the research have a practical significance to the design and enhancement of water-conducting structures that should be earthquake-resistant.
Highlights
- General schematic view of the test model: 1 - reinforced concrete pipe, 2 - earthwork, 3 - weak soil in the base, 4 - sensors (SM-3), 5 - vibration vibrator (VI-9-8A)
- Scheme for checking the seismic resistance of a water-conducting pipe on a seismic platform.
- Graphs of the dependence of the amplitude of soil vibrations on the location and blasting distance depending on the soil type: 1 - gravel-crushed soil, 2 - loess soils (sandy), 3 - sandy loam.
1. Introduction
When an engineering structure is subjected to dynamic loading, and is always at contact with soils, the properties of which vary with deformation and strength parameters. The earthwork embankment pipes cause some specific challenges when subjected to seismic loads, the loads on the ground setting are very much dependent on numerous parameters, a fact that cannot be entirely solved in theory. When it comes to seismic or blasting activity which often occurs to structures, the effects of the soil mass on this occurrence depend upon the frequency, amplitude and logarithmic decrement of the vibrations, and are observable in all soils in varying amounts, which is extremely hard to include in theoretical calculations. Even the most theoretically determined solutions of complicated issues need further experimental polishment and numerous solution coefficients are experimentally determined only. The experimental methodology listed in the work [1], [2], [8], [9] was employed in the process of working out designs of water-passing structures, underground pedestrian crossings, and perfecting their dynamic parameters.
2. Related work
In comparison to field experimentation, model experiments are much cheaper, and the structures can be easily modified as well as the seismic activity of impact on the structure model can be altered in large ranges, causing the destruction of the structure, which cannot be done in field experiments. In the present instance, the similarity theory of Academician A.N. USSR A. G. Nazarov [3]. Meanwhile, the two kinds of experiments with model of structures are: low-modular materials are used in making models based on scale factor, from real materials by dynamic stiffness – , where is the material’s modulus of elasticity, J is the moment of inertia. For example, if 10, then the model is ten times smaller than the dimensions of the real structure. At the same time, for conducting experiments, a centrifugal modeling machine is necessary, which allows us to create in the model 10 g, since the acceleration of free fall in the machine should be 98.1 m/s2. International scientists D. Zhang, X. Liu, Y. Yang, N. Shi, J. Jiang, A. Z. Ter-Martirosyan, A. V. Pronozin, V. A. Rybakov have studied the influence of vibrations caused by seismic loads and transport on underground pipelines [10-17]. The values of the oscillations were determined using digital modeling software. Conducting research with varying seismic intensity and on a seismic platform is currently becoming increasingly relevant.
3. Materials and methods
Adopted methods of natural and model experiments to increase dynamic rigidity: Methodology of natural experiments. To fulfill the assigned tasks, tests were conducted to determine the amplitude-frequency characteristics arising in the soils of the pipeline, embankment, and underground passages on a special model of the earthwork located on the basis of the Osh branch of the “Kyrgyzavtozhol” state enterprise under the Ministry of Transport and Communications of the Kyrgyz Republic. The geometric dimensions of the earthwork are shown in Fig. 1.
Fig. 1General schematic view of the test model: 1 – reinforced concrete pipe, 2 – earthwork, 3 – weak soil in the base, 4 – sensors (SM-3), 5 – vibration vibrator (VI-9-8A)
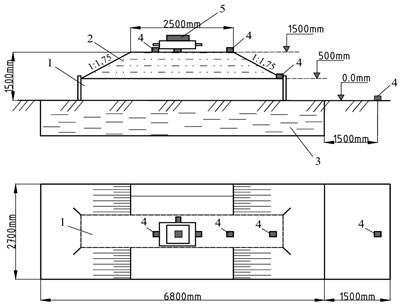
The outcomes of these experiments allowed establishing the stresses of the pipe structure and the level of their movements and comparing the data with the results of the theoretical calculations. It has been demonstrated that when struck by seismic waves, water carrying pipes move relative to adjacent soil which is the reason behind the dynamic theory of seismic resistance of underground passages of buildings.
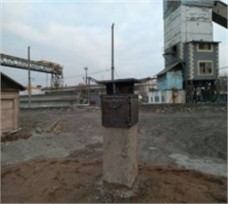
According to this methodology, highway pavements with a height of 2.5 m are considered as test objects, and the physical and mechanical properties of the soils consist of the following: soil type, medium sand, specific gravity of soil, 2.65 t/m3 , soil porosity coefficient, 0.55, ground internal friction angle, 40°, natural soil moisture, 18 %, ground adhesions, 3 kPa. To determine the propagation of oscillations in the three-axis coordinate system , vibration displacement, logarithmic decrement of oscillations, vibration velocity, and vibration acceleration of the embankment soil, oscilloscope sensors (SM-3). The general view of the model of the special earthwork created for field research is shown in Fig. 2.
Fig. 2General view of the pipe model in the subgrade. Photos taken by the third author on May 19, 2022, depicts a model of a pipe placed under the earthwork
4. Results and discussion
Seismic platform: This platform consists of metal trusses with a span of 6.2 m, a height of 1.2 m, and rigidity bonds [4], [6]. The vibration source is the VBP-4 vibrator, the disturbing force is 140 N, the power of the electric motor is 10 kW, the rotational speed is up to 1500 rpm, the kinematic moment of the imbalances is 5500 N·sm, the load capacity of the seismic platform is 250 kN, the platform weight is 38 kN, it rests at its corners on flexible metal supports made of spring steel with a cross-section of 102×2 mm, a height of 170 mm, which are rigidly fixed with one end to the supporting parts of the truss, and with the other, with the help of shoe devices, to the concrete foundation. The range of change in the platform’s oscillation frequency 4.0-20 Hz, the oscillation amplitude 0.2-2 mm, depends on the mass of the studied models and the vibrator's inertia force. The seismic platform allows for the testing of structural models for harmonic oscillations, sinusoidal type, and non-stationary oscillations using a 5500 N pendulum, which is significantly closer to the conditions of real earthquakes by recording the axelograms of the 1966 Tashkent and 1976 Gazli earthquakes. The axelograms of the 1969 Issyk-Kul earthquakes were also used.
The acceleration of the seismic platform can be determined by the formula:
where is the amplitude of platform oscillations, mm; – frequency of oscillations, Hz.
Platform seismicity coefficient:
for 7 – ball earthquake 500 mm/s2; 8 – ball 1000 mm/s2; 1000 mm/s2.
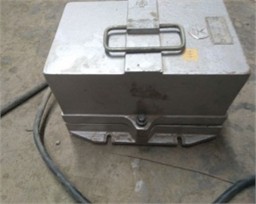
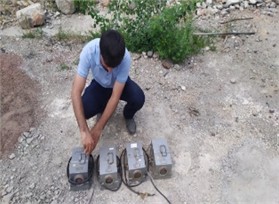
During the experiments, the dynamic characteristics of the structure and its surrounding soil were recorded using oscilloscopes N-041, N-700, and vibration sensors were used: SPM-16, SMV-2, VEGIK, S-5-6. An elastic element with a 25mm base and a 200 ohm resistance with a glued strain gauge was used. The location of the water pipeline model on the seismic platform and the location of the vibration sensors are shown in Fig. 3.
Testing of natural water-passing structures: Experimental studies of pre-existing water passages and underground pedestrian crossings mainly took place on the highway of Osh-Sary-Tash-Irkeshtam, and city of Osh. In the copyrighted work the experimental methodology is outlined in detail.
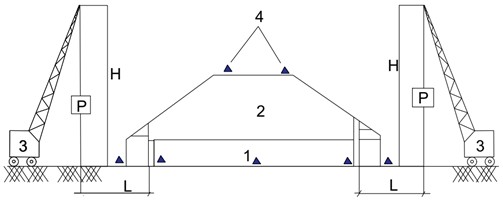
It was found that forced vibrations in the water pipeline of different shapes and sizes and in the recently developed reinforced concrete structure were obtained by placing loads 0.3-1.0 tons at dissimilar distances of the tested structure, which permitted modeling the intensity of the earthquake within the range of 7-9 points in Fig. 4.
Fig. 3Scheme for checking the seismic resistance of a water-conducting pipe on a seismic platform: 1 – water-conducting pipe, 2 – road surface embankment, 3 – fences, 4 – seismic platform trusses, 5 – vibrator, 6 – base (soil), 7 – ruberoid layer, 8 – pipe growth, 9 – vibration sensors, 10 – direction of vibration and impulse loads on the tested model of the structure
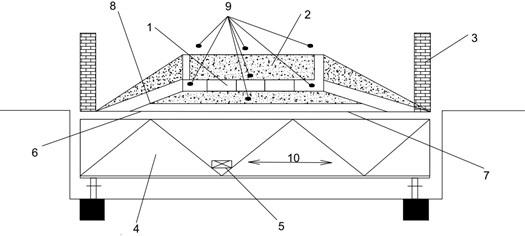
Fig. 4Location of the cranes, unloading the load – P: 1 – test pipe, 2 – earthwork, 3 – cranes located at a distance – L, 4 – vibration sensors, transmitting the magnitude of displacement and the frequency of vibrations
Testing of water-passing structures and their models by the seismic-explosive method: The advantage of these experimental studies is that the impact of cosinusoidal seismic waves has been used to visualize the real earthquake and the potential implication of imitating the impulsive action to the tested model which is achieved through a sequence of explosions. It was based on a new theory and methodology of testing introduced by Professor H.S. Sogdiyev [5], [7]. The SPM-16 seismometer using the natural vibrations 0.25 s, logarithmic decrement 0.5 was used to judge the magnitude of the explosion in terms of Earthquake. Table 1 produced earthquake points that were due to a series of explosions, but with a slowdown period of 0.25 s.
Table 1Results of earthquakes with a series of explosions slowing down by 0.25 s
Explosion series | Quantity explosions | Charge weight, | Explosion time interval, s | Distances from explosion to structure, m | Depth of deposit |
I | 10 | 100 | 0.025-0.75; 1.0-1.25 | 7 | 2 m; 100 m |
II | 7 | 80 | 2.0-2.25; 3.0-3.25 | 10 | 2 m; 100 m |
III | 4 | 60 | 0-0.25; 0.75-1.0 | 12 | 2 m; 100 m |
Experiment using a centrifugal simulation machine: The main calculation results of experiments carried out in a seismic resistant platform and in a series of explosion methods have been verified approximately using centrifugal modeling to model seismic processes. This is the only method that guarantees that the physical nature of the processes under study is preserved and on the other hand provides that similarity in space and time is carried out.
The principle of centrifugal modeling is that the model being tested should be exposed to volumetric forces which would be multiplied by as many factor as the model is smaller than the actual structure.
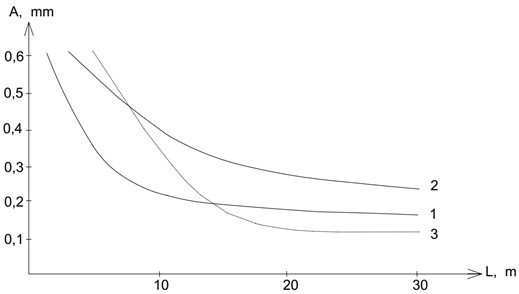
Fig. 5 showed graphs of the dependence of the amplitude of the soil vibration on the distance as well as the position of the explosion of some soils during the experiments.
Fig. 5Graphs of the dependence of the amplitude of soil vibrations on the location and blasting distance depending on the soil type: 1 – gravel-crushed soil, 2 – loess soils (sandy), 3 – sandy loam
The quantitative parameters being noted in the model of phenomena and processes are directly projected to the nature of the structure with respective scale coefficients:
where: – force, (N); – volume, (m3); – temperature, (°С); – area, (m2), – tension, (N/m2); – time, (s); – length, (m); – volumetric weight, (kN/m3); , – natural and model indices.
It can be seen that, by adjusting the rotational speed of the centrifuge in accordance to Eq. (3), one can determine the modeling scale. It can do it by calculating the degree of alteration of the bulk density of the soil and the degree of the logarithmic decrement of oscillations because its degree also diminishes under the impact of seismic waves. The logarithmic decrement (of the oscillations) is calculated by the formula:
where and – the values of the oscillation amplitude in and cycles and its magnitude should be 0.1, which can be determined by recording the embankment oscillations according to the methodology proposed below. If 0.1, the embankment is in an emergency state and is not suitable for further normal operation.
5. Conclusions
1) A method for conducting model and field experiments to determine the regulatory values of vibrodynamic vibrations has been developed to increase the strength and reliability of water pipelines located in seismically active regions.
2) To analyze the vibrational process of existing culverts during an earthquake, the oscillation amplitude was recorded using CM-3 seismic sensors, taking into account natural oscillations of 0.25 s and a logarithmic decrement of 0.5.
3) A model experimental method has been developed, in which vibrations are created by unloading the load from the seismic platform and the crane. As a result of the experiment, the dependence of the vibration amplitude on the soil type and vibration focus was determined, which is presented in the form of a graph in Fig. 5.
References
-
M. Mekhmonov, S. Makhamadjonov, and A. Uralov, “Efficiency of reinforcement of transition sections on the railroad by the developed constructions,” in E3S Web of Conferences, Vol. 508, p. 08017, Apr. 2024, https://doi.org/10.1051/e3sconf/202450808017
-
M. Mekhmonov and A. Uralov, “Reducing impact of embankment soils on shore support of bridge on the approaches to bridges,” in E3S Web of Conferences, Vol. 401, p. 02040, Jul. 2023, https://doi.org/10.1051/e3sconf/202340102040
-
A. G. Nazarov, Theory of Similarity of Solid Deformable Bodies. Yerevan, USSR: Academy of Sciences of the Armenian SSR, 1965.
-
G. Pokrovskiy and I. S. Fedorov, Centrifugal Modeling in Construction. Moscow, USSR: Stroyizdat, 1968.
-
H. S. Sogdiyev and E. M. Yunusaliyev, Oscillations of Soil and Structures During Industrial Explosions in Complex Mining and Geological Conditions. 2010.
-
A. K. Abdujabarov, N. M. Khasanov, and M. M. Zhalaldinov, “Seismic resistance of water pipelines and underground passages,” KGUSTA Bulletin, Vol. 41, No. 3, pp. 263–266, 2013.
-
A. K. Abdujabarov, A. T. Marufiy, and M. M. Zhalaldinov, “Influence of incomplete contact of the foundation and base on the seismic resistance of transport structures,” KGUSTA Bulletin, Vol. 45, No. 3, pp. 32–36, 2014.
-
K. S. Lesov and M. K. Kenjaliyev, “Organizational and technological parameters during the construction of the Bukhara-Misken railway line,” in Asia-Pacific Conference on Applied Mathematics and Statistics, Vol. 2471, p. 030026, Jan. 2022, https://doi.org/10.1063/5.0089621
-
G.-A. Khalfin, K. Umarov, I. Purtseladze, and M. Yembergenov, “System for determining state of continuous welded track,” in E3S Web of Conferences, Vol. 401, p. 02050, Jul. 2023, https://doi.org/10.1051/e3sconf/202340102050
-
R. Wu, K. Zhuang, Y. Yang, Z. Wu, and F. Liu, “Dynamic response of buried pressurized pipelines when subjected to transverse impact loading: experimental study,” Materials, Vol. 18, No. 6, p. 1362, Mar. 2025, https://doi.org/10.3390/ma18061362
-
P. Zhang, “Dynamic reliability of buried pressure pipelines subjected to random space-time earthquake load,” International Journal of Performability Engineering, Vol. 15, No. 1, pp. 179–190, Jan. 2019, https://doi.org/10.23940/ijpe.19.01.p18.179189
-
C. Qiu, S. Tian, and Y. Wang, “Structural failure and mechanical response of buried pipelines under offshore fault dislocation,” Applied Sciences, Vol. 15, No. 17, p. 9450, Aug. 2025, https://doi.org/10.3390/app15179450
-
D. Zhang et al., “Field experiment and numerical investigation on the mechanical response of buried pipeline under traffic load,” Engineering Failure Analysis, Vol. 142, p. 106734, Dec. 2022, https://doi.org/10.1016/j.engfailanal.2022.106734
-
T. Wu, N. Jiang, C. Zhou, X. Luo, H. Li, and Y. Zhang, “Experimental and numerical investigations on damage assessment of high-density polyethylene pipe subjected to blast loads,” Engineering Failure Analysis, Vol. 131, p. 105856, Jan. 2022, https://doi.org/10.1016/j.engfailanal.2021.105856
-
B. Davydov, K. Kablukova, and A. Godyaev, “Prediction of the train traffic in a transport corridor,” Procedia Engineering, Vol. 165, pp. 1430–1436, Jan. 2016, https://doi.org/https://doi.org/10.1016/j.proeng.2016.11.875
-
P. Pokorski, P. Radziszewski, and M. Sarnowski, “Fatigue life of asphalt pavements on bridge decks,” Procedia Engineering, Vol. 153, pp. 556–562, Jan. 2016, https://doi.org/10.1016/j.proeng.2016.08.191
-
I. Polyakova and E. Vasilyeva, “Benefits of public-and-private partnership for the creation of the infrastructure of the urbanized territories in Russia,” Procedia Engineering, Vol. 165, pp. 1380–1387, Jan. 2016, https://doi.org/10.1016/j.proeng.2016.11.868
About this article

The authors have not disclosed any funding.
The datasets generated during and/or analyzed during the current study are available from the corresponding author on reasonable request.
The authors declare that they have no conflict of interest.
