Abstract
The article presents modern methods for reinforcing the embankment in the zone of the interface between the coastal bridge piers and the earth bed of the high-speed railway section. It has been established that as a result of driving reinforced concrete piles into the railway embankment, the natural vibrations of the earthwork decrease by up to 15 %. A frequency equal to the frequency of vibrations arising from the speed of high-speed railways with the help of vibrators on models of the earth bed for determining the amplitude-frequency characteristics of various design points has been created and the values of this frequency have been processed by fixing them with the help of seismometric sensors SM-3 in all design points. A significant decrease of shear at the main site after driving of reinforced concrete piles and approaching of this value to microseismic value based on the values of sensors located at the main site and at a distance of 1.5 m from the foundation is determined. It has been established that by driving reinforced concrete piles into the railway embankment, the vertical settlement of the earthwork decreases by 33 % and 50 % depending on the soil type. Also, the methodology of experimentation for the study of vibrations of the earth bed piled from different soils on high-speed railroads is given.
Highlights
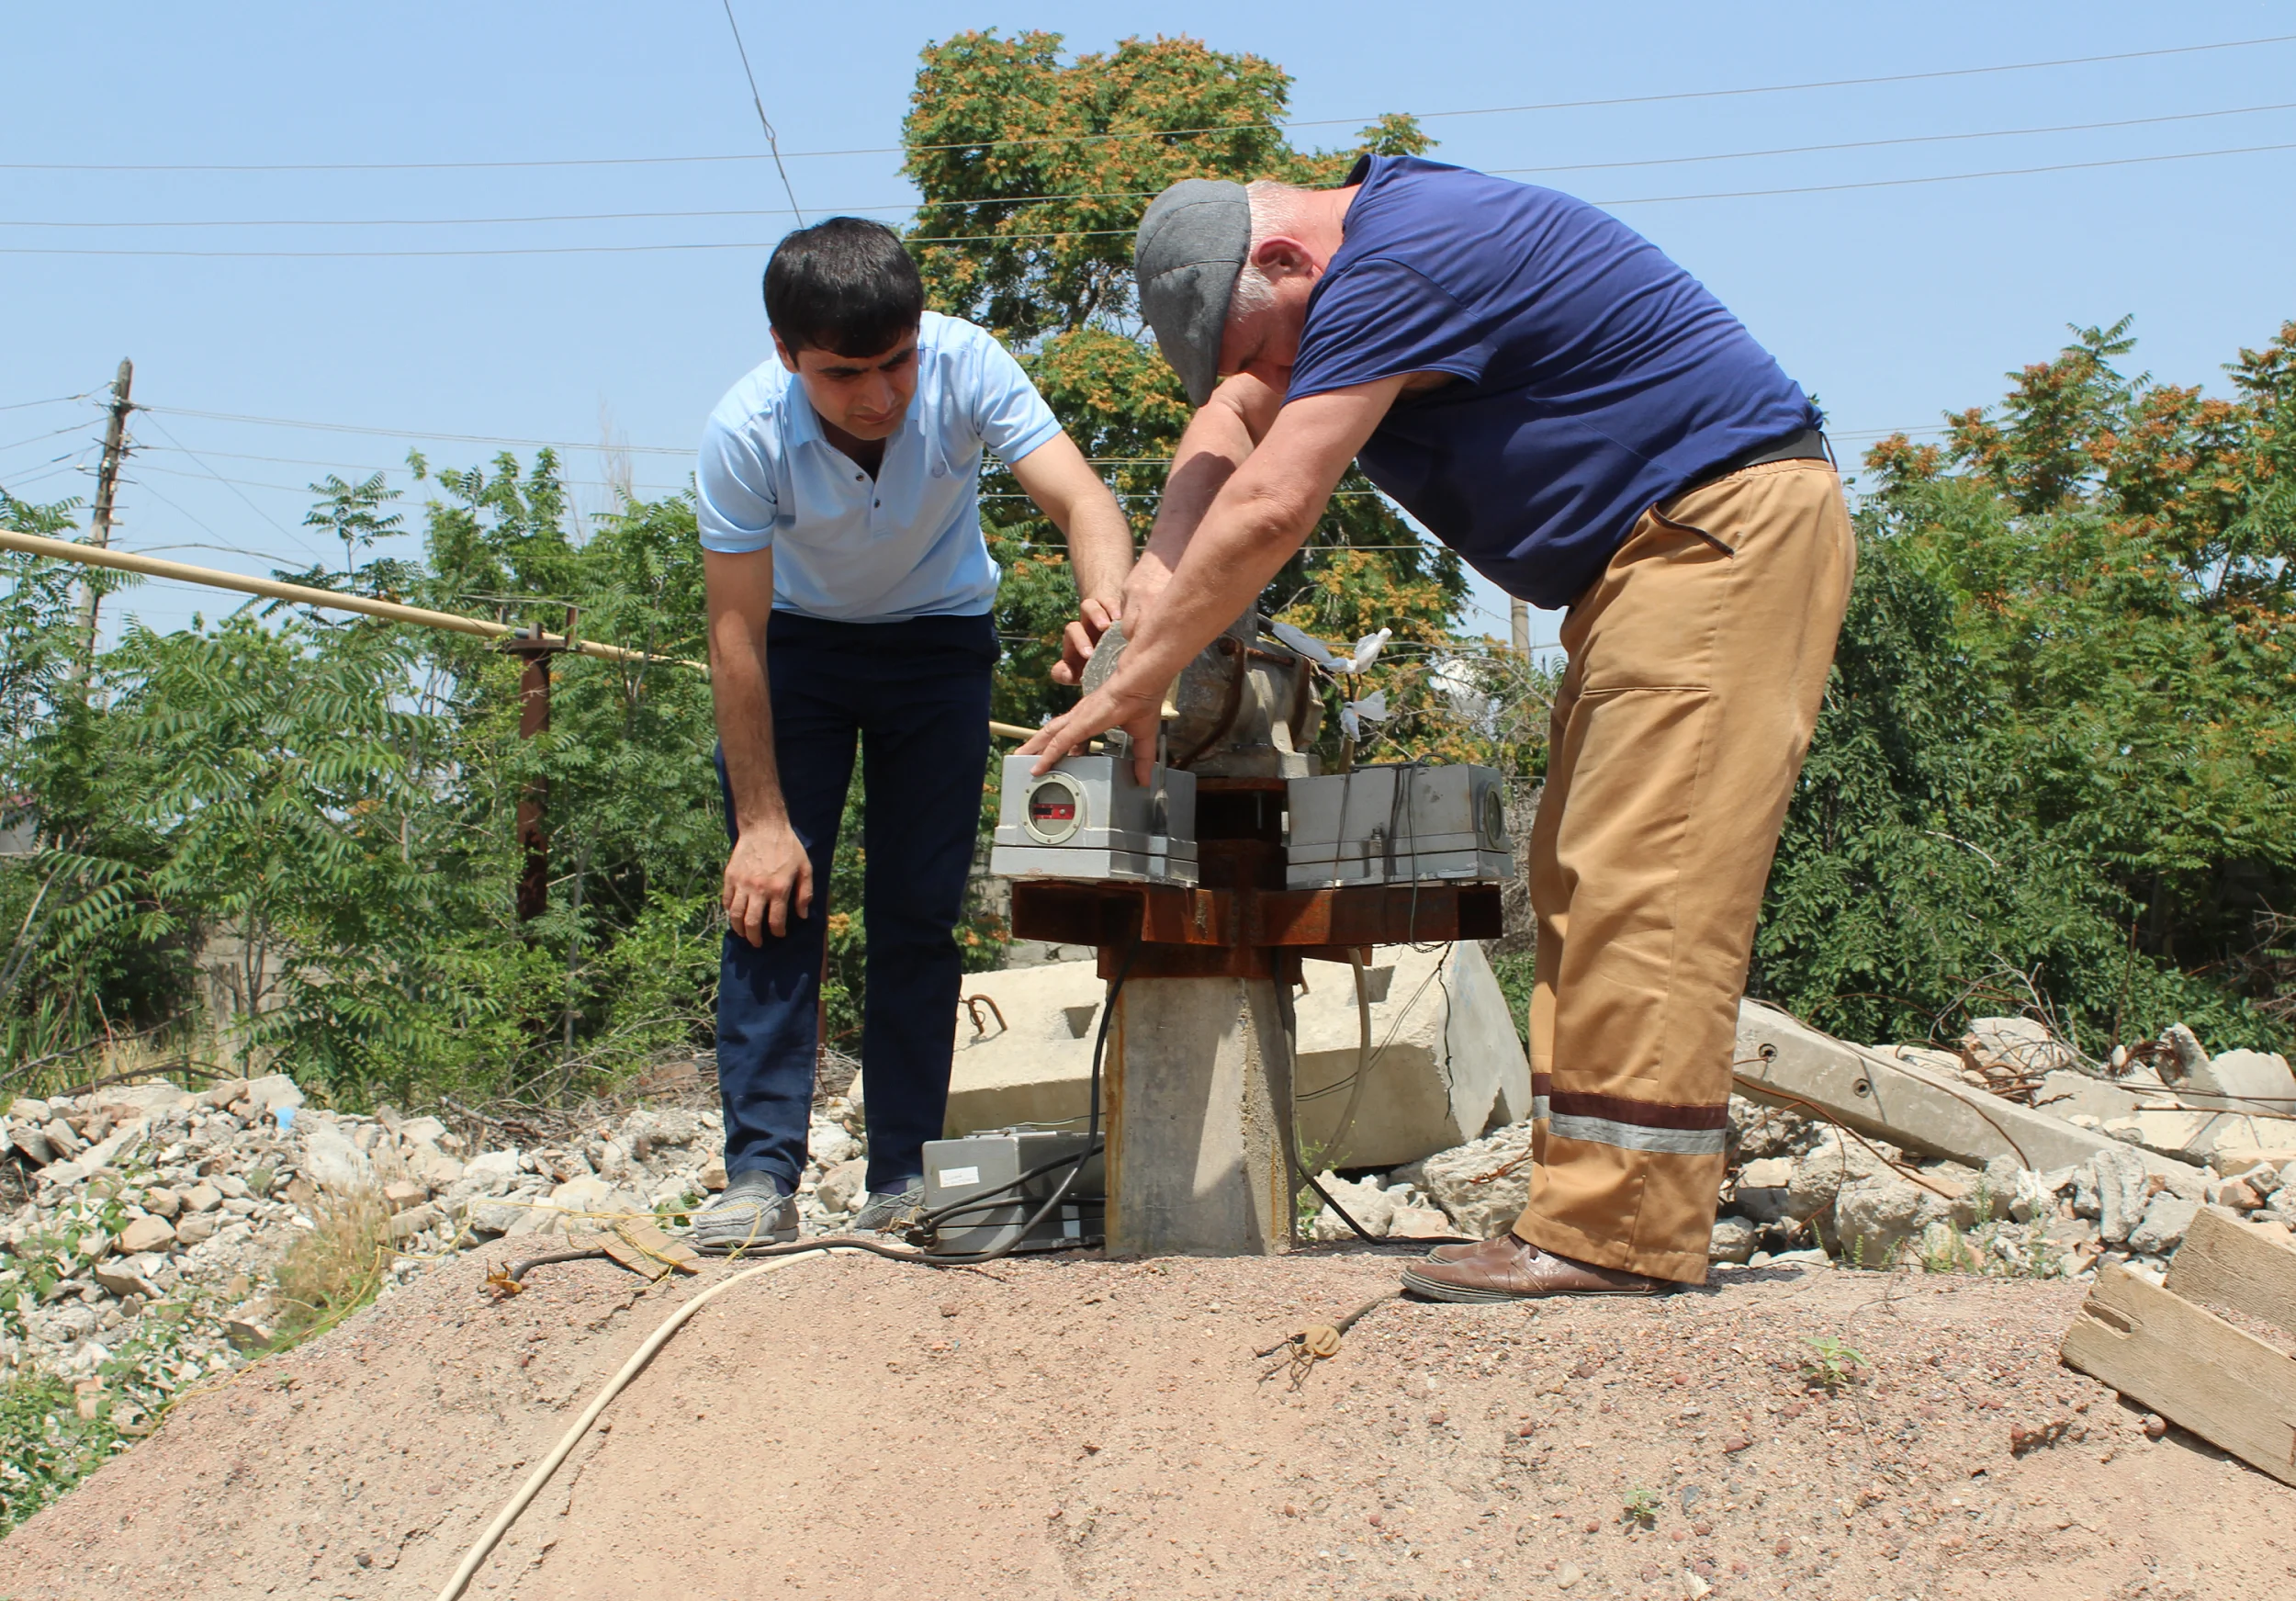
- The photograph taken by the first author on May 19, 2022, depicts a general view of a seismometric station that records the process of ground vibrations.
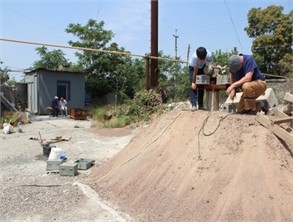
- In the photograph taken by the first author on May 19, 2022, a model of the earthwork prepared by the author is shown, and the process of vibrations was recorded.
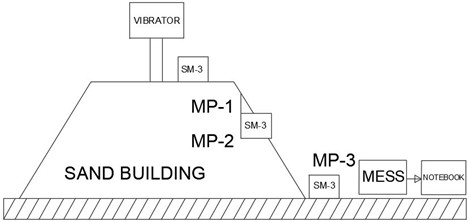
- General schematic view of the test model: 1 – reinforced concrete pile, 2 – earthwork, 3 – weak soil at the base, 4 – sensors (SM-3), 5 – vibration vibrator (VI-9-8A).
1. Introduction
Most of the experimental research is conducted on models using a seismic platform and a centrifugal modeling machine, based on the “Theory of Similarity of Solid Deformable Bodies” developed by Academician A.G. Nazarov, as well as the “Device for Reproducing Dynamic Effects on Underground Structures” designed by Ph.D. in Technical Sciences and Senior Researcher Z.R. Teshabayeva. Additionally, full-scale and model railway embankment structures are used [1], [2].
To measure the transmission of dynamic characteristics from the vibrator through the sand embankment, a mobile engineering seismometric station (MESS) was used. This station was developed in 2016 at the Institute of Mechanics and Seismic Stability of Structures. Detailed information on the station’s structure, operating principles, preparation for operation, calibration methodology for measurement channels, and the method for recording vibrations of an object during dynamic processes is provided in the scientific and technical report [3].
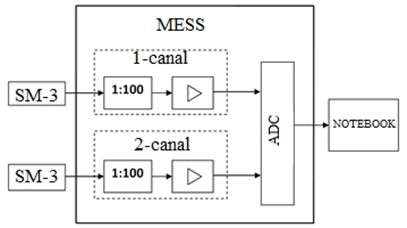
Fig. 1 shows the structural diagram of the two-channel mobile engineering seismometric station. Each measurement channel includes: an input divider, amplifier, analog-to-digital converter (ADC) shared across all channels, and a laptop with dedicated software [4-6]. A seismometer is connected to the input of each measurement channel. The voltage divider limits the input electromotive force (EMF) of the seismometer to ensure the signal remains undistorted. The amplifier strengthens the weak signals from the seismometers. The ADC converts the analog signals into digital code for computer processing [7]. The software stores incoming data from the seismometers, processes it, and displays it as vibration graphs of the studied embankment section in real time on the laptop monitor [8].
During the measurements, two channels were used, with SM-3 seismometers connected to their inputs to record the displacements of the sand embankment and the underlying hard soil caused by the operation of a vibrator installed on a pile fixed within the sand embankment [9], [10].
Fig. 1Structural diagram of the two-channel mobile engineering seismometric station. The photograph taken by the first author on May 19, 2022, depicts a general view of a seismometric station that records the process of ground vibrations

To study the dynamic characteristics of vibrations in the sandy embankment and the solid ground at the base of the embankment, three measurement points were selected (Fig. 2). Measurement point MP-1 is located at the top of the sandy embankment, measurement point MP-2 is located in the middle of the embankment slope, and measurement point MP-3 is located on the solid ground at the base of the embankment. The geometric dimensions of the earthwork are shown in Fig. 3.
Fig. 2Location of measurement points with seismometers. In the photograph taken by the first author on May 19, 2022, a model of the earthwork prepared by the author is shown, and the process of vibrations was recorded
According to this methodology, the test object is a railway embankment with a height of 1.5 meters, and the physical and mechanical properties of the soils are as follows:
– Soil type: medium sand
– The specific weight of the soil, 2,65 t/m3.
– The soil porosity coefficient 0.45.
– The angle of internal friction of the soil 40°.
– The natural moisture content of the soil 18 %.
– The cohesion of the soil 3 kPa.
Fig. 3General schematic view of the test model: 1 – reinforced concrete pile, 2 – earthwork, 3 – weak soil at the base, 4 – sensors (SM-3), 5 – vibration vibrator (VI-9-8A)

2. Materials and methods
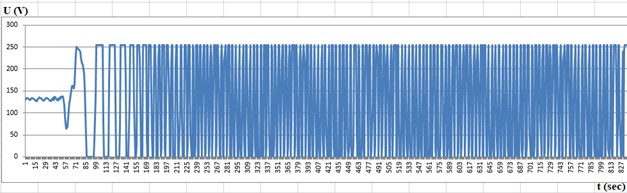
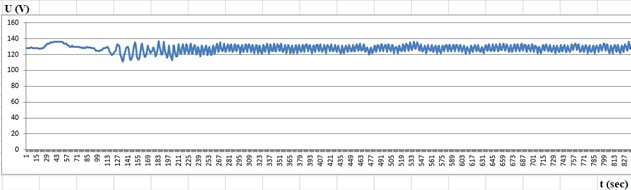
Let us consider the methodology for calculating displacements during vibrations of the embankment and soil of high-speed railways, caused by the operation of the vibrator. Figs. 4 shows the vibration graphs from two seismometers, located at measurement points MP-1 and MP-3, recorded by the mobile engineering seismometric station (MESS).
Fig. 4Activation of the vibrator and recording of vibrations from a) seismometer at MP-1 and b) seismometer at MP-3. Sensitivity attenuation coefficients of the channels: β1= 100 and β2= 100
a)
b)
In the seismogram (Fig. 4(a)) at MP-1, the moment of vibrator activation is shown, and an increase in the vibration frequency of the embankment surface up to 50 Hz is observed after 1 second. The amplitude of vibrations on the embankment surface near the pile is very large, which is evident in the graph by the amplitude cuts at the top and bottom with a maximum sensitivity attenuation of the measuring channel by 100 times ( 100).
3. Results and discussion
The proposed method of reinforcing the earthwork with reinforced concrete piles differs from existing reinforcement methods, such as concreting the upper part of the earthwork, reinforcing with reinforced concrete boxes, and using geosynthetic materials, in that it is more economical and highly earthquake-resistant. With an increase in the weight of the structure, the value of the seismic force increases directly proportionally. The proposed strengthening method, namely reinforcing the earthwork with reinforced concrete piles, is based on a lower specific weight and elastic deformation capacity.
In the seismogram (Fig. 4(b)) at MP-3, the moment of vibrator activation is delayed by 0.24 seconds compared to the registration in MP-1. This can be explained by the fact that a significant portion of the distance between the measurement points is composed of sand, in which the wave propagation speed is lower than in solid ground. Therefore, the vibration caused by the vibrator at measurement point MP-2 will be recorded later than at measurement point MP-1. In this seismogram, an increase in the vibration frequency of the embankment surface to 50 Hz is observed after 1 second. The amplitude of vibrations on the solid ground is recorded at the maximum attenuation of the sensitivity of the measuring channel by 100 times ( 100). Continuation of the seismogram is shown in Fig. 5.
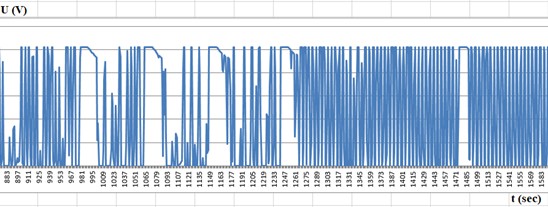
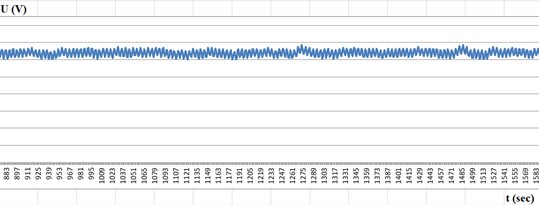
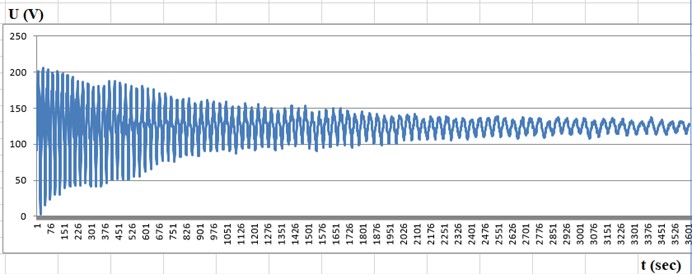
The seismogram presented in Fig. 5(a) shows oscillations before driving piles into the earthwork. The value of the oscillatory motion at point 127 was 250 V. The seismogram presented in Fig. 5(b) shows oscillations after driving piles into the earthwork. In this case, the value of the oscillatory motion at point 127 was 20 V. These values indicate a decrease in the amplitude of oscillations after the piles were driven.
Fig. 5Turn-off of the vibrator and recording of oscillations from a) seismometer at IT-1 and b) seismometer at IT-3. Sensitivity attenuation coefficients of the channels β1= 100 and β2= 100
a)
b)
In Figs. 5(a) and 5(b), the decrease in the frequency of oscillations after the vibrator is turned off (point 1709) is shown. Initially, the amplitude increases, then decreases. After the vibrator is turned off, the amplitudes of the recorded oscillations decreased and entered the calibration zone, allowing for the calculation of displacements caused by the oscillations. Let’s examine the first maximum oscillation at the measurement point IT-1 in Fig. 6(a).
The maximum amplitude value is 250, the minimum amplitude value is 0, and the total amplitude range is: 250 - 0 = 250.
The full scale 250 corresponds to 2.5 V (electrical unit - volt), the full amplitude range 250 corresponds to (V):
250 – 2.5 V
250 – (V), from where:
The calculation of the object’s (soil’s) displacement during oscillations is performed using the formula [1]:
where – true displacement in mm; – attenuation coefficient established on the mobile station channel, (dimensionality); – signal amplitude from maximum to minimum (double amplitude of the average signal value calculated by the program), V; – channel sensitivity coefficient, V/mm.
Table 1 shows the channel gain coefficients obtained during MESS calibration.
Table 1Channel amplification factors
Increase coefficient | 1-canal | 2-canal |
V/mm | 654 | 678 |
Fig. 6Recordings after the vibrator is switched off: a) seismometer is located above the embankment in IT-1 (β= 100); b) seismometer is located on hard ground in IT-3 (β= 10)
a)
b)
Using Eq. (2), we determined the maximum movement of sand at the measuring point IT-1 according to the data of channel 1: 100; 2.5 V; 654 V/mm:
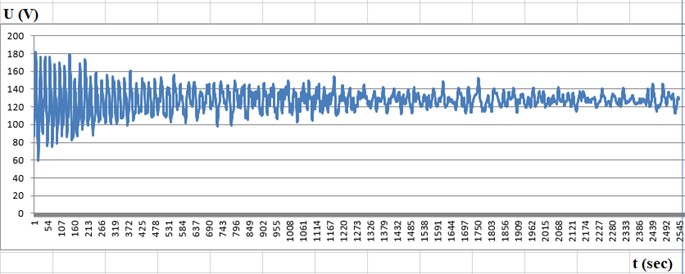
The seismogram presented in Fig. 6(a) shows oscillations before driving piles into the earthwork. The magnitude of the oscillatory motion at the first point was 200 V. The seismogram presented in Fig. 6(b) shows oscillations after driving piles into the earthwork. The value of the oscillatory motion at the first point was 180 V. These values indicate a decrease in the amplitude of oscillations.
Let’s consider the first maximum oscillation at the measurement point IT-3 in Fig. 6(b).
Maximum amplitude value 180, minimum amplitude value 59, total amplitude range 180 - 59 = 121.
The full scale 200 corresponds to 2.5 V, the full amplitude range 121 corresponds to (V):
200 – 2.5 V
121 – (V), from where:
Using Eq. (2), we determined the maximum displacement in the solid soil at the measuring point IT-3 according to the data of channel 2: 10; 1.512 V; 678 V/mm:
Determine how many times the sand mixing caused by the vibration at the measuring point IT-1 is greater than the mixing of the solid soil at the measuring point IT-3, caused by the same vibration:
Now let’s return to Fig. 4(b) and calculate the maximum displacement in solid soil at the moment of disconnection (points 1989-2003).
Maximum amplitude value 155, minimum amplitude value 112, total amplitude range: .
The full scale 160 corresponds to 2.5 V, the full amplitude range 43 corresponds to (V):
160 – 2.5 В
43 – (V), from where:
Using Eq. (2), we determined the maximum displacement in the solid soil at the measurement point IT-3 according to the data of channel 2: 100; 0.67 V; 678 V/mm:
According to Eq. (6), a fixed oscillation at the measuring point IT-1 causes a displacement of 13 greater than at the measuring point IT-2. Therefore, the maximum displacement of sand at the measuring point IT-1 (1989-2003 points) is equal to:
To determine the shifting of sand in the middle of the slope, the seismometer from the top of the embankment (IT-1) was moved to the measuring point IT-2.
4. Conclusions
As a result of processing the experiment’s results, the amplitude of the soil vibrations of the embankment decreased, the period of natural vibrations of the roadbed reduced by 15 %, and the vibration velocity and vibration acceleration decreased by 10 % and 15 %, respectively. As a result, it was determined that the logarithmic decrement of the vibrations decreases to 20 %. Depending on the steepness of the riverbed or embankment slopes and the properties of the foundation soil and roadbed, the settlement of the roadbed and ballast prism occurs, averaging up to 15 cm over three months. When reinforced with piles, the settlement is reduced to 5-7 cm, which reduces the costs of railroad track repairs by 2 times and helps improve the accident-free maintenance of the track.
Research was conducted on the displacements of the crest of the sandy embankment of high-speed railways, in the middle of the sand slope, and in the firm soil next to the embankment from oscillations caused by the vibrator, fixed on reinforced concrete piles in the center of the sandy embankment. The results of the study showed that the maximum oscillations were recorded at the moments of the vibrator's activation and deactivation at the top of the sandy embankment at measurement point IT-1 near the reinforced concrete pile on which the vibrator was installed. The maximum oscillation and corresponding displacement of the sand reached 0.167 mm. As the oscillations passed through the sand, their energy decreased, causing a displacement of 0.33 mm at measurement point IT-2. In firm soil at measurement point IT-3, the vibrator-induced oscillations caused a displacement of 0.098 mm, which is 17 times smaller than at measurement point IT-1, located near the vibrator.
The studies showed that the displacement of the foundation in high-speed railway sections with an embankment height of 1.5 meters is capable of damping the vibrational energy and reducing the displacement by approximately 17 times. Thus, vibrations in firm soil caused by earthquakes will cause less damage to the embankment if the high-speed railway embankment is reinforced with a reinforced concrete pile. Thus, it has been experimentally proven that reinforcing the railway earthwork with reinforced concrete piles by determining vibrodynamic oscillations can ensure long-term stability, resilience, and durability of the railway embankment. A significant reduction in stresses within the earthwork soil has been substantiated as a result of transmitting vibrodynamic oscillations, which arise during the movement of high-speed trains, to the base of the embankment.
References
-
K. Lesov, M. Kenjaliyev, A. Mavlanov, and S. Tadjibaev, “Stability of the embankment of fine sand reinforced with geosynthetic materials,” in E3S Web of Conferences, Vol. 264, p. 02011, Jun. 2021, https://doi.org/10.1051/e3sconf/202126402011
-
H. Wang and V. L. Markine, “Analysis of the long-term behaviour of track transition zones,” in The 3rd International Conference on Railway Technology: Research, Development and Maintenance, Vol. 110, pp. 203–220, Jul. 2025, https://doi.org/10.4203/ccp.110.203
-
M. Mekhmonov, S. Makhamadjonov, and A. Uralov, “Stabilization of embankments and coastal bridges with reinforced concrete piles,” in E3S Web of Conferences, Vol. 508, No. 9, p. 08018, Apr. 2024, https://doi.org/10.1051/e3sconf/202450808018
-
M. Mekhmonov, S. Makhamadjonov, and A. Uralov, “Efficiency of reinforcement of transition sections on the railroad by the developed constructions,” in E3S Web of Conferences, Vol. 508, No. 9, p. 08017, Apr. 2024, https://doi.org/10.1051/e3sconf/202450808017
-
A. Abdujabarov, M. Mekhmonov, P. Begmatov, F. Eshonov, and M. Khamidov, “Consideration of the environmental impact on the seismic inertial forces of the railway track in difficult conditions,” in Problems in the Textile and Light Industry in the Context of Integration of Science and Industry and Ways to Solve Them: PTLICISIWS-2, Vol. 3045, p. 030097, Jan. 2024, https://doi.org/10.1063/5.0197332
-
A. Abdujabarov, P. Begmatov, F. Eshonov, M. Mekhmonov, and M. Khamidov, “Determination of state of avalanche protection gallery during seismic impact and avalanches,” in E3S Web of Conferences, Vol. 401, p. 02042, Jul. 2023, https://doi.org/10.1051/e3sconf/202340102042
-
M. Mekhmonov and S. Makhamadjonov, “Investigation of the period of natural oscillations of the embankment on approaches to bridges,” in E3S Web of Conferences, Vol. 401, p. 05032, Jul. 2023, https://doi.org/10.1051/e3sconf/202340105032
-
M. Mekhmonov and A. Uralov, “Reducing impact of embankment soils on shore support of bridge on the approaches to bridges,” in E3S Web of Conferences, Vol. 401, p. 02040, Jul. 2023, https://doi.org/10.1051/e3sconf/202340102040
-
K. Umarov, Y. Tursinaliyeva, I. Khurramov, and S. Shayakhmetov, “Mathematical model for prediction of cargo flow during the construction of the railway line Uzbekistan-Kyrgyzstan-China,” in E3S Web of Conferences, Vol. 401, p. 03018, Jul. 2023, https://doi.org/10.1051/e3sconf/202340103018
-
G.-A. Khalfin, K. Umarov, I. Purtseladze, and M. Yembergenov, “System for determining state of continuous welded track,” in E3S Web of Conferences, Vol. 401, p. 02050, Jul. 2023, https://doi.org/10.1051/e3sconf/202340102050
About this article

The authors have not disclosed any funding.
The datasets generated during and/or analyzed during the current study are available from the corresponding author on reasonable request.
The authors declare that they have no conflict of interest.
