Abstract
In high-intensity focused ultrasound (HIFU) therapy, the differing signs of the acoustic velocity-temperature coefficients in multilayered heterogeneous tissues (such as fat-muscle) lead to inherent systematic errors in traditional single-frequency ultrasound thermometry methods and make them susceptible to motion artifacts. Therefore, this study proposes a non-invasive temperature reconstruction theory based on the relative phase difference of dual-frequency ultrasound. By establishing a multiphysics model coupling nonlinear acoustic wave propagation and the Pennes bioheat transfer equation, and using the finite-difference time-domain (FDTD) method for simulation, the performance of this method was systematically evaluated in a three-layer tissue (skin-fat-muscle) model. Simulation results show that under 20 seconds of HIFU irradiation, the focal temperature rise reached 35.3 °C; the root-mean-square error of the temperature reconstructed by the dual-frequency phase difference method was only 0.076 °C, while the error of the traditional single-frequency time-of-flight method was as high as 8.531 °C, representing an accuracy improvement of approximately 99.1 %. Furthermore, the sensitivity of the dual-frequency method to overall axial tissue displacement was only 22.2 % of that of the single-frequency method, demonstrating excellent resistance to motion artifacts. This study provides a theoretical basis and a new design paradigm for developing high-precision and robust non-invasive thermometry systems for HIFU.
Highlights
- A dual-frequency ultrasound phase-difference method is proposed to mitigate temperature reconstruction errors induced by acoustic heterogeneity in multilayered tissues.
- The method achieves a high-precision temperature reconstruction with an RMSE of 0.076°C, representing a 99.1% accuracy improvement over conventional single-frequency thermometry.
- Enhanced robustness against motion artifacts is demonstrated, with the sensitivity to axial tissue displacement reduced to 22.2% of the single-frequency baseline.
1. Introduction
With its special benefits of non-invasiveness, deep focused heating, and precise ablation, high-intensity focused ultrasound (HIFU) technology has emerged as a cutting-edge technique in areas like neuromodulation and tumor treatment [1-3]. The exact regulation of temperature within the focus zone is crucial to the effectiveness of HIFU treatment; too high of a temperature can harm nearby healthy tissue, while too low of a temperature results in incomplete ablation. Therefore, one of the main obstacles to HIFU's transition from the lab to general clinical use is the development of real-time, precise, and non-invasive temperature monitoring equipment.
Magnetic resonance thermometry, or MR-thermometry, is currently the clinically recognized “gold standard” for non-invasive temperature assessment. However, because HIFU treatment involves costly equipment, complex system integration, and low temporal precision (often with a delay of several seconds), it is difficult to meet the stringent requirements for real-time feedback. However, ultrasonic thermometry technology is considered the most promising alternative because to its low cost, high real-time performance (millisecond level), and seamless connection with HIFU treatment equipment.
Current ultrasonic thermometry techniques mostly rely on temperature-induced changes in tissue acoustic characteristics. The most traditional approach is based on ultrasonic echo time-shift, which makes use of the idea that rising temperatures alter sound velocity and thermal expansion, which in turn affects Time-of-Flight (ToF). Recent years have seen a major advancement in the use of ToF thermometry systems based on piezoelectric micromachined ultrasonic transducers (PMUTs) in in vitro investigations. By employing a dual-piezoelectric PMUT array to accomplish non-contact surface temperature measurement based on the change in ToF in pulse-echo mode, Shao et al. showed the potential of ultrasonic thermometry in a range of media. Regardless of the surface emissivity of the item being monitored, they were able to achieve a sensitivity of 143 ns/°C in air [4]. Chen et al. further extended this technology to simulated living tissue (PDMS) by measuring the changes in temperature caused by an internal heating plate. This allowed them to get temperature monitoring with an average error of 0.58 °C [5] and confirmed the viability of PMUTs in hyperthermia conditions. By employing a ScAlN PMUT array to achieve high-precision (average error 1.4 °C) ambient temperature sensing at a distance of 30 cm without signal amplification to increase the measuring distance and conditions, Sarafianou et al. illustrated the advantages of PMUTs in remote monitoring [6].Furthermore, by putting forth the concept of a PMUT network, which accomplishes “volumetric” continuous temperature monitoring of indoor spaces by measuring the sound velocity over a 5-meter path with an error within ±0.5 °C [7], Teng et al. demonstrated the potential of ultrasonic thermometry in building integrated and networked monitoring systems. Chen et al. recently developed PMUT thermometry technology to a more clinically relevant scenario in a real biological tissue HIFU heating experiment. Strong validation for real-time temperature feedback in HIFU treatment was provided by their achievement of continuous monitoring of the focal region temperature based on ultrasonic echo time delay changes, with an average error of 0.76 °C. They also used a multi-parameter neural network model to further reduce the measurement error by 36 % [8]. In addition to ToF, other quantitative ultrasound thermometry approaches, such as the change in backscattered energy (CBE) and thermal strain imaging (TSI), have also been extensively investigated for non-invasive temperature mapping [9-11]. Comprehensive reviews of these modalities highlight their theoretical potential in monitoring thermal therapies [12, 13]. Despite these advancements, conventional single-parameter techniques – including both ToF and backscatter-based methods – struggle in complex clinical environments due to two fundamental problems: 1) Tissue heterogeneity: Human tissues, such as muscle and fat, have very different sound speed temperature coefficients (). Muscle tissue that is rich in water has a positive , but fat has a negative one (about –0.3 m/s/°C). When the ultrasonic channel travels across multiple tissue layers, the positive and negative cancelation of this effect might result in considerable systematic temperature measurement errors. 2) Motion sensitivity: Echo time shifts are directly generated by tissue movement brought on by physiological processes like breathing and heartbeat, creating motion distortions that are hard to discern from temperature changes and seriously impairing the accuracy of temperature measurements.
This work creatively suggests a dual-frequency relative phase-shift thermometry theory to address these issues. This theory's main notion is to send two ultrasonic waves at similar frequencies at the same time and then measure the relative phase difference between them after they have propagated. Since temperature-induced changes in sound speed affect both frequencies in a comparatively comparable way, this method offers two advantages. However, the phase difference is extremely sensitive to even small changes in sound speed along the path. First, differential measurement achieves excellent anti-interference capability by effectively canceling out common-mode phase drift introduced by factors like overall tissue movement; second, the high sensitivity of phase measurement itself allows for the detection of minute temperature changes.
This work aims to statistically and methodically demonstrate the feasibility and theoretical superiority of the dual-frequency phase difference approach by developing a rigorous multi-physics coupled numerical model. When compared to previous studies, our work's primary innovations and distinctions are: 1) Directly addressing the heterogeneity issue: Using a multi-layer skin-fat-muscle model, we methodically and scientifically examined the precise mechanisms by which various sound speed temperature coefficients impact ultrasonic thermometry accuracy. 2) Providing a sound solution: We statistically evaluated the enhancement in motion artifact resistance of a differential thermometry method based on dual-frequency phase difference compared to the traditional single-frequency ToF methodology. 3) Creating a thorough theoretical framework: We created a thorough sound-thermal coupling model that included the HIFU sound field, biological heat conduction, and dual-frequency ultrasonic sensing. This model provides a thorough tool and basis for the theoretical development and performance forecasting of novel ultrasonic thermometry methods.
2. Materials and methods
2.1. Theoretical model
This study’s theoretical model is a multiphysics coupled system that mainly consists of a bio-heat transfer model and an acoustic wave propagation model. The temperature-dependent sound speed and the HIFU acoustic source term provide a bidirectional coupling between the two models.
2.2. Dual-frequency sound wave propagation and phase difference
The acoustic wave equation, which accounts for relaxation effects, describes how ultrasound travels through biological tissue [14, 15]:
Sound pressure (), reference sound speed (), sound diffusion coefficient (), nonlinearity coefficient (), and tissue density () are all represented by these variables. This equation provides a complete description of sound wave propagation, absorption, and nonlinear effects.
Two continuous sine waves with similar frequencies and equal amplitudes are superposed to provide the detecting signal used in this investigation:
The two center frequencies (Hz) in this instance are and ( > ), while the amplitude is denoted by . After this composite signal passes through the tissue via path , the received signal can be explained as follows, taking into consideration the temperature-dependent sound speed distribution :
The amplitudes following attenuation are and . The two frequency components, and , have the following instantaneous phases:
where the wavenumber is denoted by . The dual-frequency instantaneous phase difference is defined as follows [9]:
When the organizational temperature changes from a uniform starting temperature () to a distribution of , the phase difference () changes as follows [10, 16]:
The temperature measurement in this study is based on this equation. The temperature coefficient of tissue sound velocity (m/s/°C), or , is normally positive for water-rich tissues (0.1-1.0 m/s/°C) and negative for adipose tissue. is a representation of the temperature change. This formula shows that a weighted integral along the acoustic path, where the weighting is determined by the temperature coefficient of the sound velocity, yields the recorded phase difference change.
2.3. Biological heat conduction equation
The heat transmission process within the tissue is described by the conventional Pennes bioheat transfer equation (BHTE), which adequately takes into consideration heat conduction, heat dissipation from blood circulation, and external heat sources [17, 18]:
where, and represent the tissue’s specific heat capacity and thermal conductivity, respectively. The mass of blood flowing through a unit volume of tissue per second is represented by the symbol , which stands for the tissue’s blood perfusion rate, a critical measure of the tissue’s capacity to dissipate heat. represents the blood’s specific heat capacity. Specific simulation parameters are shown in Table 1. It is commonly assumed that the arterial blood temperature, represented by the symbol , is a constant 37 °C. The amount of heat deposited by HIFU per unit time and unit volume of tissue is known as the acoustic source term or .
2.4. Acoustic-thermal coupling source term computation
The HIFU source term, which acts as an energy bridge between the acoustic and bioheat equations, has a physical meaning of the rate of acoustic energy dissipation per unit volume. This work's finite-difference time-domain (FDTD) multiphysics coupling computation no longer uses the simplified ideal Gaussian beam model; instead, the sound intensity distribution is computed directly from the transient sound pressure field that is produced by solving Eq. (1). This makes it possible for the model to precisely depict the effects of reflection, refraction, and focal zone distortion brought on by the mismatch in acoustic impedance between the layers of muscle, fat, and skin. The following formula can be used to determine the sound source term [19]:
where is the acoustic absorption coefficient (Np/m) of the tissue. The time-averaged sound intensity is computed using the steady-state sound pressure amplitude from the FDTD solution [20, 21]:
To mimic the HIFU transducer in the FDTD grid, we set the boundary conditions of the computational region to be a curved piston source with geometric focusing qualities. The driving signal for the transducer surface is set up as follows:
were, = 1 MHz is the HIFU driving frequency, and is the starting acoustic pressure amplitude on the transducer surface. By calibrating this value, the spatial peak time-averaged sound intensity at the focus location is set to . Using this full-wave numerical modeling technique, the heat source distribution can accurately depict the distinct influence of multilayered heterogeneous tissues on acoustic energy deposition, providing exact input for additional temperature field calculations.
2.5. A model for the temperature coefficient of sound velocity in multilayered tissues
The temperature coefficients of sound velocity in actual biological tissues fluctuate greatly amongst tissues. Based on the most recent experimental data, we employ a temperature-dependent sound velocity model. The following is the relationship between sound velocity and temperature for tissues with a high water content (muscle, skin) [22]:
The speed of sound at reference temperature is represented by . The following is the relationship between temperature and sound speed for adipose tissue [23]:
This discrepancy leads to significant errors in traditional single-frequency methods when used to multilayer tissues; however, dual-frequency techniques effectively eliminate this systematic error through differential measurement.
2.6. Motion interference suppression theory
When the tissue undergoes an overall axial displacement due to physiological activity, the phase change for a single-frequency probing wave can be approximately computed as follows [11]:
The shift in the relative phase difference of dual-frequency detection waves is provided by [24]:
It is evident from these two first-order approximation formulas that is far less sensitive than to displacement . = is the theoretical suppression ratio. This theoretical ratio is roughly 9.5 for the frequencies employed in this investigation ( = 4.75 MHz, = 0.5 MHz).
The aforementioned derivation, which yields a theoretical suppression ratio of ≈ 9.5, is predicated on the idea that plane waves propagate in a homogeneous medium in one dimension. However, this optimum value will be impacted by wavefront distortion and intricate phase integration paths in real multilayered, concentrated sound fields. In order to obtain an assessment that is more in line with the real-world situation, this work will use high-fidelity FDTD full-wave simulation to quantitatively ascertain the motion interference suppression effect of this differential technique in a realistic tissue model (see Section 3.2). Even though the simulated values can differ quantitatively from the theoretical ideal values, it is expected that the basic physical principle and qualitative advantages of differential measurement in suppressing common-mode motion interference would be confirmed.
2.7. Simulation settings and tissue model
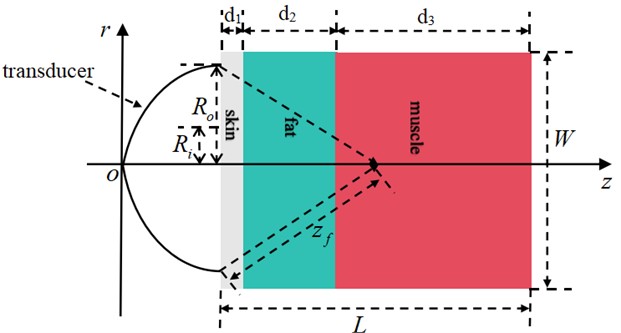
In order to focus on examining the effects of multilayer biological tissues on sound propagation and temperature reconstruction, as well as to simplify the computational model, this study assumes ideal coupling between the HIFU transducer and the skin layer, ignoring the ultrasound propagation path in the coupling fluid (such as water). Therefore, the geometric focal length 15 mm that is examined in this paper is the distance between the skin's surface and the focal point. This simplification has no bearing on the basic evaluation of the dual-frequency phase difference method's efficacy in monitoring temperature in heterogeneous tissue media.
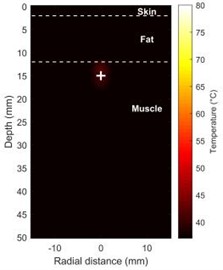
Based on the previously indicated assumptions, we constructed a two-dimensional axisymmetric tissue model (Fig. 1) with dimensions of = 50 mm (depth) × = 30 mm (width). Three layers of biological tissue make up this model from the inside out: skin ( = 2 mm), fat ( = 10 mm), and muscle ( = 38 mm).
Fig. 1A multilayer biological tissue model exposed to HIFU radiation
The table below displays the thermophysical and auditory characteristics of each tissue layer [25-27].
The HIFU transducer’s parameters are as follows: Geometric focal length = 15 mm (measured from the skin surface), outer radius = 7.5 mm, and inner radius = 1.5 mm. At the focus, = 1000 W/cm2 is the spatial peak time-averaged acoustic intensity. The frequency of operation is = 1.0 MHz. The temperature measurement dual-frequency ultrasonic probe is positioned coaxially with the HIFU transducer, using transmission frequencies of = 4.5 MHz and = 5.0 MHz. By precisely adjusting the tissue parameters and transducer properties, this model guarantees a methodical evaluation of the dual-frequency phase difference method's temperature measuring performance in multilayered heterogeneous tissues. This gives future simulations of acoustic-thermal interaction a solid physical foundation. By employing a uniform grid with a time step of = 0.5 ns and a spatial step size of = = 0.05 mm (about /20), the FDTD simulation meets the Courant-Friedrichs-Lewy (CFL) stability requirements [20]. Throughout the 20-second simulation, the temperature field is updated every 10 ms and the acoustic field is updated every 1 ms to provide a quasi-static iteration of the acoustic-thermal coupling.
Table 1Thermal and acoustic characteristics of biological tissue
Tissue type | Density / (kg/m3) | Speed / (m/s) | Absorption coefficient / (Np/m/MHz) | Nonlinear coefficient / | Thermal conductivity / (W/m/°C) | Specific heat capacity / (J/kg/°C) | Infusion rate / (kg/m³/s) |
Skin | 1109 | 1612 | 9.8 | 4.5 | 0.37 | 3391 | 0.95 |
Fat | 911 | 1436 | 5.1 | 6.1 | 0.21 | 2348 | 0.48 |
Muscle | 1041 | 1586 | 14.5 | 4.6 | 0.49 | 3421 | 2.12 |
3. Results
We accurately replicated the physical process of HIFU treatment by numerically solving the acoustic-thermal coupling model using the FDTD approach. Figs. 2-3 display the simulation findings.
3.1. Physical field simulation of the heating process
In order to generate a dynamic physical setting for evaluating the efficacy of temperature monitoring techniques, we first simulated the deposition and thermal consequences of HIFU energy in a three-layer tissue model, as shown in Fig. 2.
As demonstrated by the sound intensity distribution cloud maps in Fig. 2(a) and Fig. 2(b), the results of the FDTD simulation clearly reflect the propagation behavior of focused ultrasound in multilayer tissues. Even though it experiences reflection and refraction at the interfaces between layers, the 1.0 MHz acoustic beam is accurately focused at the predetermined depth within the muscle layer ( ≈ 15 mm) after passing through the skin and fat layers ( < 12 mm). The focus region exhibits a typical ellipsoidal distribution at the –6 dB level, with an axial length of approximately 8 mm and a radial width of around 1.5 mm. The lack of noticeable side lobes or severe defocusing caused by tissue heterogeneity confirmed this frequency's penetrating ability in deep tissue treatment.
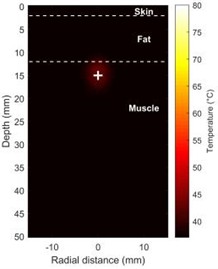
Fig. 2(c) and Fig. 2(d) show the distribution of the temperature field as a function of time. The center temperature of the targeted region rapidly increased from its initial value of 37 °C to approximately 55 °C after five seconds of heating (Fig. 2(c)), forming a noticeable hot spot. With a stark temperature differential at its edges, the heat was primarily contained within the focal area. As irradiation continued, the high-temperature area’s volume rose dramatically, and the effects of heat conduction became apparent over time. By the end of the 20-second treatment, the center of the focused region had reached a peak temperature of 72.3 °C (a temperature increase of 35.3 °C) (Fig. 2(d)), completely covering the lethal dose required for tumor thermal ablation (> 60 °C) without inadvertently heating the outermost layers of fat and skin.
3.2. Performance evaluation and comparison of dual-frequency phase difference thermometry methods
To objectively evaluate the dynamic performance of the temperature measuring method, we used the temperature time-series data at the focal center point ( = 0, = 15 mm) in the temperature field shown in Fig. 2 as the “ground truth” (Fig. 3(a)). Based on this, we systematically compared the dual-frequency phase difference method with the traditional single-frequency ToF method and confirmed its efficacy. Fig. 3 provides a detailed comparison of the performance and key findings of this dynamic simulation.
Fig. 2Shows how the temperature and acoustic field change over time during HIFU therapy a), b) maps of the distribution of acoustic intensity, with a maximum acoustic intensity of 1000 W/cm2, clearly show how concentrated the HIFU energy is in the focal region (depth ~15 mm); c) temperature field distribution at t = 5 s; d) temperature field distribution at t = 20 s (Notes: + marks the HIFU focal point, and dashed lines represent tissue boundaries)
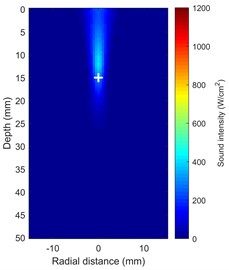
a) Sound intensity distribution at 5 s
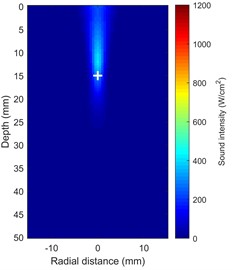
b) Sound intensity distribution at 20 s
c) Temperature distribution at 5 s
d) Temperature distribution at 20 s
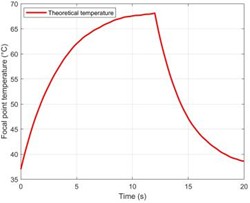
Fig. 3(a) shows how the temperature changes over time at the ground truth focal point ( = 0, = 15 mm). Starting from 37 °C, the temperature at the focal point rises approximately exponentially to a peak of 72.3 °C at = 20 s, corresponding to a total increase of = 35.3 °C. Fig.3(b), which compares the change in sound speed () at two points along the central axis, visually reveals the complex effects caused by heterogeneous tissue: is positive at the focal point in the muscle layer ( = 15 mm) (increasing with temperature) and negative in the deeper fat layer ( = 11.9 mm) (decreasing with temperature). Critically, the dual-frequency instantaneous phase difference calculated from the simulation data exhibits a high synchronization with the focal temperature change (Fig. 3(c)). Furthermore, a linear fit of to the ground truth temperature yields a coefficient of determination = 0.993 (Fig. 3(d)), indicating a strong linear correlation between the two under simulation conditions and serving as the foundation for the calibration of phase difference thermometry.
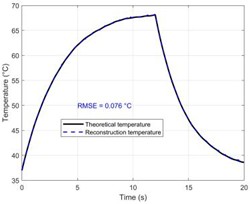
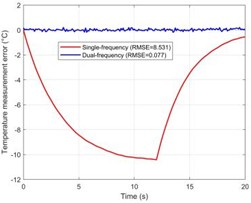
Fig. 3(e) and Fig. 3(f) compare the accuracy of temperature reconstruction using the two methods, which is the primary finding of this work. The black solid line in Fig. 3(e) represents the ground truth derived from the bioheat transfer equation, whereas the red curve in Fig. 3(e) reflects the reconstruction result of the dual-frequency phase difference method proposed in this study. The red curve's substantial visual overlap with the black ground truth curve, which accurately traces the whole heating process from 37 °C to 72.3 °C, demonstrates how well this approach can overcome the phase distortion caused by propagation through multi-layered tissues.
Fig. 3Performance evaluation of the dual-frequency phase difference thermometry method. a) The “theoretical temperature” progression curve at the focal center (r = 0, z = 15 mm) shows the heating process over a complete 20 seconds. Eventually, the temperature rises exponentially and gets closer to thermal equilibrium. At 20 seconds, the temperature at the focal center reaches its maximum of 35.3 °C, or 72.3 °C, in absolute terms. b) The change in sound speed (Δc) at the focal point in the muscle layer (z =15 mm) and the deepest point in the fat layer (z = 11.9 mm) with time along the central axis (r = 0). It is clear that the fat layer causes a negative shift in sound speed. c) The response curve for dual-frequency phase differences, which shows a significant connection with temperature change (R2 = 0.993). d) The calibration connection between temperature and phase difference exhibits good linearity. e)–f) A comparison of the temperature reconstruction results from the two methods. g) The temperature measurement error distribution illustrates the significant advantage of the dual-frequency technique. h) The single-frequency and dual-frequency phase responses are examined when the tissue undergoes a step-like axial displacement ΔL = 1 μm. Compared to the single-frequency method, the dual-frequency method is only 22.2 % as sensitive to motion interference as the single-frequency method. i) A quantitative analysis of overall performance shows a 99.1 % increase in accuracy
a) Temperature time history curve of the focal region
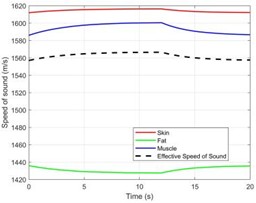
b) Changes in sound velocity in different tissue layers
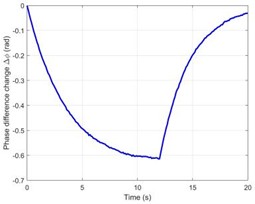
c) Dual-frequency phase difference time history curve
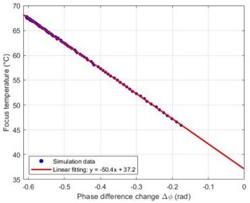
d) Temperature-phase difference calibration relationship
e) Temperature measurement results using the single-frequency method
f) Temperature measurement results using the dual-frequency method
g) Comparison of temperature measurement errors
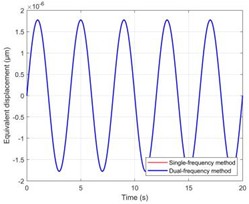
h) Equivalent displacement of motion disturbance
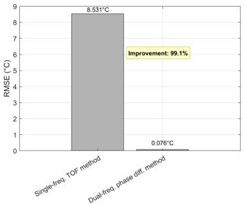
i) Comparison of method performance
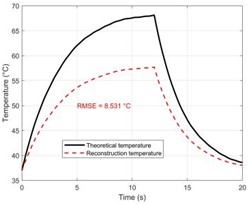
In contrast, Fig. 3(f) shows the reconstruction result of the traditional single-frequency ToF method (the black solid line represents the ground truth, and the blue dashed line represents the reconstruction result). It is clear that as heating time increases, the single-frequency method reconstruction results show a systematic negative deviation, meaning that the measured value is less than the true value. The physical reason for this error is that when heat diffuses from the focal point (muscle layer) to the anterior (fat layer) through thermal conduction, the single-frequency method understates the overall temperature rise because the fat layer’s negative sound speed temperature coefficient partially cancels out the positive time shift created by the muscle layer.
Fig. 3(g) shows the error distribution histograms that objectively compare the performance of the two methodologies. The error of the dual-frequency approach has a quasi-normal distribution with a mean of zero and a root mean square error (RMSE) of 0.076 °C. However, the error distribution of the traditional single-frequency technique is far more dispersed and heavily skewed towards negative values, with an RMSE as high as 8.531 °C. This suggests that the canceling effect of positive and negative sound velocity temperature coefficients renders the single-frequency ToF approach completely ineffective in multi-layered heterogeneous tissues. This exceeds the error of the dual-frequency technique by more than two orders of magnitude. Furthermore, to address the clinically common problem of motion artifacts, Fig. 3(h) simulates the signal response when the tissue undergoes a 1 μm axial overall displacement. According to the data, the single-frequency method produces a huge phase jump that is mistakenly interpreted as a false temperature increase, whereas the dual-frequency approach effectively eliminates the motion phase in both signals as common-mode noise due to its differential measuring methods. In Fig. 3(i), the effectiveness of the two methods is fully measured. The dual-frequency method (RMSE = 0.076 °C) performs 99.1 % better than the single-frequency method (RMSE = 8.531 °C) in terms of temperature measuring accuracy. The sensitivity of the dual-frequency method to total tissue movement is only 22.2 % of that of the single-frequency method, while it achieves a 4.5-fold suppression of motion interference. When combined, these two quantitative results demonstrate the substantial benefits of the dual-frequency phase difference technique over tissue heterogeneity and motion artifacts.
4. Discussion
Through the creation of a rigorous multi-physics coupling model and high-fidelity numerical simulations, this work methodically demonstrates from a theoretical perspective the superior performance of the dual-frequency ultrasound phase difference method in non-invasive temperature measurement of multi-layered tissues during HIFU treatment. Our results provide important physical insights into the fundamental limitations of existing ultrasonic thermometry techniques, in addition to proving the method's theoretical effectiveness.
The study's main scientific contribution is the identification and resolution of the temperature measurement challenge caused by tissue acoustic heterogeneity. The traditional single-frequency ToF technique assumes that the sound velocity temperature coefficient () along the acoustic channel is uniform or has a consistent sign, which is clearly not the case in real human tissue. Our full-wave simulation results (Fig. 3(f), Fig. 3(g), Fig. 3(i)) provide conclusive quantitative evidence of the severe impact of tissue heterogeneity: due to the substantial cancellation between positive and negative sound velocity temperature coefficients, the single-frequency ToF method yields a RMSE of up to 8.531 °C along a skin-fat-muscle acoustic path. This error figure not only fully exceeds the clinical temperature measurement tolerance level, which normally calls for better than ±1 °C, but it also shows that the temperature values obtained using the single-frequency approach in these circumstances no longer have a quantitative reference value. This offers strong proof that a fundamental physical barrier to the therapeutic application of traditional ultrasonic thermometry techniques is tissue heterogeneity [12, 13, 28]. However, the integral of () along the path is proportional to the signal response of the dual-frequency phase difference method, which evaluates the relative phase difference of two frequencies (Eq. (7)). Even if along the integration path has both positive and negative values, the overall phase difference change can accurately and dominantly reflect the temperature increase in the focus region since the temperature rise () is mostly concentrated there. This effectively lowers the method’s error to 0.076 °C, demonstrating its great potential as a next-generation temperature measuring technique and providing it with “immunity” to tissue heterogeneity.
The results of the study are promising to be significant therapeutically because the dual-frequency technique provides a very dependable solution to the motion artifact problem that has long plagued ultrasound thermometry. Physiological motions, such as breathing and heartbeat, inevitably affect clinical HIFU treatments [29, 30], especially in the chest and abdomen. Tissue displacement from these motions (from millimeters to centimeters) immediately results in ultrasonic time shifts and creates distortions that are difficult to distinguish from temperature changes. This is one of the main reasons why the clinical performance of the current ultrasonic thermometry techniques is lacking. Our theoretical studies and simulations show that dual-frequency differential measurement has an inherent common-mode rejection capability against this entire tissue movement, which reduces its sensitivity to motion by 4.5 times compared to the single-frequency technique (Fig. 3(h)). Therefore, the dual-frequency approach is expected to provide more consistent and reliable temperature monitoring than any existing ultrasound thermometry technology in HIFU therapy of moving organs (such as the liver, kidneys, and pancreas). This is essential for guaranteeing treatment safety and extending HIFU technology’s clinical indications. However, additional randomized clinical trial tests are required for in vivo confirmation before its practical therapeutic application, as the current findings are mainly based on a theoretical multiphysics model.
Furthermore, this theoretical work provides strong guidance for experimental research. For instance, Chen et al. [8] achieved an average error of 0.76 °C in a homogeneous tissue model. In contrast, our simulations in a heterogeneous model reveal a more challenging scenario: without addressing heterogeneity, the single-frequency method's error (8.531 °C) is an order of magnitude higher. In this context, the performance of our dual-frequency method (RMSE = 0.076 °C) is particularly noteworthy for two reasons. First, this accuracy represents an order-of-magnitude improvement over the 0.76 °C reported in current homogeneous tissue experiments. Second, this value establishes a theoretical precision benchmark that could be approached experimentally after successfully mitigating the effects of tissue heterogeneity. This suggests that in complex tissue contexts observed in real life, the dual-frequency differential approach and state-of-the-art sensing technology could result in revolutionary performance advances. The 0.076 °C inaccuracy found in this simulation is the theoretical precision limit that the dual-frequency differential principle itself can achieve in overcoming tissue heterogeneity under ideal conditions (no noise, no positioning error). Therefore, it is clear from this study that the dual-frequency differential approach in conjunction with advanced PMUT technology provides a clear technological path to further overcome the 0.76 °C experimental precision bottleneck. It provides clear theoretical goals and a physical basis for developing signal processing algorithms and designing future hardware systems.
Finally, we must acknowledge our study’s shortcomings as a theoretical model and offer potential avenues for future research. The current two-dimensional axisymmetric model does a good job of capturing the basic physical processes, but it cannot take into consideration effects like scattering, refraction, and mode conversion that can occur in complex three-dimensional anatomical structures [31, 32]. Furthermore, we ignored the substantial, nonlinear, and possibly irreversible changes in tissue thermophysical and acoustic properties that may arise from protein denaturation at temperatures higher than 60 °C by using a linear relationship between temperature and sound speed. Future studies should focus on developing more complex biophysical models that incorporate tissue denaturation effects into a fully three-dimensional, patient-specific heterogeneous anatomical model in order to more accurately forecast and validate the efficacy of this approach in real-world clinical settings. Combining this theory with advanced tomographic reconstruction techniques will be crucial to advancing this technology toward its eventual clinical use and completing the transition from single-point temperature monitoring to two-dimensional/three-dimensional temperature mapping.
5. Conclusions
In conclusion, compared to conventional single-frequency techniques for non-invasive temperature monitoring during HIFU therapy, the suggested dual-frequency ultrasonic relative phase difference method offers notable advantages in terms of accuracy and robustness. This dual-frequency approach successfully reduces errors due to motion interference and tissue heterogeneity by navigating multi-layered heterogeneous tissues. In order to fully validate its therapeutic potential, additional randomized clinical trial tests are planned for in vivo confirmation, even though these simulation results are very encouraging. When compared to existing technologies, the primary contributions of this work are threefold: (i) the development of a comprehensive acoustic-thermal multiphysics model that provides a design framework for novel thermometry techniques; (ii) the proposal of a differential temperature measurement principle based on dual-frequency phase difference, which effectively mitigates the effects of tissue heterogeneity and motion interference; and (iii) the systematic validation of this method’s feasibility and superiority in simulated HIFU scenarios. In order to develop next-generation high-reliability ultrasonic thermometry technology, this work provides a solid architectural foundation and a new theoretical framework. In addition to directly influencing the field of HIFU treatment, it has extensive scientific reference value for all medical technologies that need precise ultrasonic thermal monitoring (e.g., hyperthermia, ultrasonic neuromodulation, etc.). Future study will focus on clinical translation studies and experimental validation of this concept in order to eventually promote the practical usage of this state-of-the-art technology.
References
-
S. Wang et al., “Clinical observation and immune effect of high-intensity focused ultrasound (HIFU) treatment on patients with colorectal cancer liver metastasis,” International Journal of Hyperthermia, Vol. 42, No. 1, p. 2519344, Dec. 2025, https://doi.org/10.1080/02656736.2025.2519344
-
X. Zhang et al., “Application of high intensity focused ultrasound combined with nanomaterials in anti-tumor therapy,” Drug Delivery, Vol. 31, No. 1, p. 2342844, Dec. 2024, https://doi.org/10.1080/10717544.2024.2342844
-
M. Chetan et al., “High-intensity focused ultrasound treatment of unresectable soft tissue sarcoma and desmoid tumours – a systematic review,” Clinical Radiology, Vol. 87, p. 106977, Aug. 2025, https://doi.org/10.1016/j.crad.2025.106977
-
Z. Shao, S. Pala, Y. Liang, T. Jiang, and L. Lin, “Non-contact surface temperature sensing based on a single bimorph pMUTs array,” in IEEE 33rd International Conference on Micro Electro Mechanical Systems (MEMS), pp. 861–864, Jan. 2020, https://doi.org/10.1109/mems46641.2020.9056314
-
Y. Chen et al., “Noninvasive measurement of temperature for simulated tissue based on piezoelectric micromachined ultrasonic transducers,” Journal of Micromechanics and Microengineering, Vol. 33, No. 6, p. 065001, Jun. 2023, https://doi.org/10.1088/1361-6439/acca2b
-
M. Sarafianou et al., “In-air long-range environmental temperature sensing with a single scandium-doped aluminum nitride pMUT array,” in 22nd International Conference on Solid-State Sensors, Actuators and Microsystems (Transducers), pp. 128–131, Jun. 2023.
-
M. Teng et al., “Continuous volumetric indoor temperature monitoring via PMUTs,” in 2024 IEEE 37th International Conference on Micro Electro Mechanical Systems (MEMS), pp. 967–970, Feb. 2024, https://doi.org/10.1109/mems58180.2024.10439353
-
Y. Chen et al., “Noninvasive measurement of temperature for tissue based on piezoelectric micromachined ultrasonic transducers,” SSRN, Vol. 258, p. 119498, Apr. 2025, https://doi.org/10.2139/ssrn.5218208
-
M. Bayat, J. R. Ballard, and E. S. Ebbini, “Ultrasound thermography: A new temperature reconstruction model and in vivo results,” in AIP Conference Proceedings, Vol. 1821, No. 1, p. 060004, Jan. 2017, https://doi.org/10.1063/1.4977628
-
C. Simon, P. Vanbaren, and E. S. Ebbini, “Two-dimensional temperature estimation using diagnostic ultrasound,” IEEE Transactions on Ultrasonics, Ferroelectrics and Frequency Control, Vol. 45, No. 4, pp. 1088–1099, Jul. 1998, https://doi.org/10.1109/58.710592
-
M. Nguyen, A. Agarwal, J. C. Kumaradas, M. C. Kolios, G. Peyman, and J. J. Tavakkoli, “Real-time non-invasive control of ultrasound hyperthermia using high-frequency ultrasonic backscattered energy in ex vivo tissue and in vivo animal studies,” Physics in Medicine and Biology, Vol. 69, No. 21, p. 215001, Oct. 2024, https://doi.org/10.1088/1361-6560/ad7f19
-
H. Amiri and B. Makkiabadi, “A review of ultrasound thermometry techniques,” Frontiers in Biomedical Technologies, Vol. 7, No. 2, pp. 82–91, Aug. 2020, https://doi.org/10.18502/fbt.v7i2.3852
-
S. Li, Z. Zhou, S. Wu, and W. Wu, “A review of quantitative ultrasound-based approaches to thermometry and ablation zone identification over the past decade,” Ultrasonic Imaging, Vol. 44, No. 5-6, pp. 213–228, Aug. 2022, https://doi.org/10.1177/01617346221120069
-
Y. Zhou, X. Gong, and Y. You, “Prediction of high-intensity focused ultrasound (hifu)-induced lesion size using the echo amplitude from the focus in tissue,” Physical and Engineering Sciences in Medicine, Vol. 47, No. 4, pp. 1349–1359, Jun. 2024, https://doi.org/10.1007/s13246-024-01449-2
-
J. Seo, S. Shim, D. Jeung, and B.-J. Kim, “Spherical lesion formation in HIFU using robotic assistance for controlled focal point manipulation,” Scientific Reports, Vol. 15, No. 1, p. 5294, Feb. 2025, https://doi.org/10.1038/s41598-025-89763-x
-
D. J. Jang, H. K. Park, and M. C. Lee, “Experimental investigation on the measurement performance of high-speed ultrasonic wave thermometry in ambient – and high-temperature environments,” Applied Thermal Engineering, Vol. 242, p. 122484, Apr. 2024, https://doi.org/10.1016/j.applthermaleng.2024.122484
-
M. Azhdari et al., “Refining thermal therapy: Temperature distribution modeling with distinct absorption in multi-layered skin tissue during infrared laser exposure,” International Communications in Heat and Mass Transfer, Vol. 157, p. 107818, Sep. 2024, https://doi.org/10.1016/j.icheatmasstransfer.2024.107818
-
M. Singh, “Modified Pennes bioheat equation with heterogeneous blood perfusion: A newer perspective,” International Journal of Heat and Mass Transfer, Vol. 218, p. 124698, Jan. 2024, https://doi.org/10.1016/j.ijheatmasstransfer.2023.124698
-
R. Roohi, S. Baroumand, R. Hosseinie, and G. Ahmadi, “Numerical simulation of HIFU with dual transducers: The implementation of dual-phase lag bioheat and non-linear Westervelt equations,” International Communications in Heat and Mass Transfer, Vol. 120, p. 105002, Jan. 2021, https://doi.org/10.1016/j.icheatmasstransfer.2020.105002
-
B. Hao et al., “Focused ultrasound enables selective actuation and Newton-level force output of untethered soft robots,” Nature Communications, Vol. 15, No. 1, p. 5197, Jun. 2024, https://doi.org/10.1038/s41467-024-49148-6
-
J.-F. Aubry et al., “Benchmark problems for transcranial ultrasound simulation: Intercomparison of compressional wave models,” The Journal of the Acoustical Society of America, Vol. 152, No. 2, pp. 1003–1019, Aug. 2022, https://doi.org/10.1121/10.0013426
-
K. A. Wear, “Temperature dependence of ultrasonic attenuation in human calcaneus,” Ultrasound in Medicine and Biology, Vol. 26, No. 3, pp. 469–472, Mar. 2000, https://doi.org/10.1016/s0301-5629(99)00135-0
-
R. Seip and E. S. Ebbini, “Noninvasive estimation of tissue temperature response to heating fields using diagnostic ultrasound,” IEEE Transactions on Biomedical Engineering, Vol. 42, No. 8, pp. 828–839, Jan. 1995, https://doi.org/10.1109/10.398644
-
K. B. Malekzadeh, H. Behnam, and J. J. Tavakkoli, “Noninvasive monitoring of tissue temperature changes induced by focused ultrasound exposure using sparse expression of ultrasonic radio frequency echo signals,” Journal of Medical Signals and Sensors, Vol. 14, No. 3, p. 8, Mar. 2024, https://doi.org/10.4103/jmss.jmss_23_23
-
M. Mokhtari-Dizaji and S. Mortazavi, “Threshold of linear and nonlinear behavior of high intensity focused ultrasound (HIFU) in skin, fat, and muscle tissue using computer simulation,” Iranian Journal of Medical Physics, Vol. 19, No. Online First, pp. 181–203, Jun. 2021, https://doi.org/10.22038/ijmp.2021.59077.1992
-
H. Dong, G. Liu, and X. Tong, “Influence of temperature-dependent acoustic and thermal parameters and nonlinear harmonics on the prediction of thermal lesion under HIFU ablation,” Mathematical Biosciences and Engineering, Vol. 18, No. 2, pp. 1340–1351, Jan. 2021, https://doi.org/10.3934/mbe.2021070
-
M. Wang and Y. Zhou, “Simulation of non-linear acoustic field and thermal pattern of phased-array high-intensity focused ultrasound (HIFU),” International Journal of Hyperthermia, Vol. 32, No. 5, pp. 569–582, Jul. 2016, https://doi.org/10.3109/02656736.2016.1160154
-
S. Luan et al., “MRI assisted ultrasonic thermometry: a new strategy for non-invasive temperature monitoring in HIFU therapy,” Ultrasonics Sonochemistry, Vol. 120, p. 107471, Sep. 2025, https://doi.org/10.1016/j.ultsonch.2025.107471
-
W. Shen, Y. Zhang, H. Zhang, H. Zhong, and M. Wan, “Automatic detection of B-lines in lung ultrasound based on the evaluation of multiple characteristic parameters using raw RF data,” Ultrasonic Imaging, Vol. 47, No. 3-4, pp. 134–152, Jun. 2025, https://doi.org/10.1177/01617346251330111
-
J. E. Kiriazi, S. M. M. Islam, O. Boric-Lubecke, and V. M. Lubecke, “Sleep posture recognition with a dual-frequency cardiopulmonary Doppler radar,” IEEE Access, Vol. 9, pp. 36181–36194, Jan. 2021, https://doi.org/10.1109/access.2021.3062385
-
J. Wiskin, B. Malik, D. Borup, N. Pirshafiey, and J. Klock, “Full wave 3D inverse scattering transmission ultrasound tomography in the presence of high contrast,” Scientific Reports, Vol. 10, No. 1, p. 20166, Nov. 2020, https://doi.org/10.1038/s41598-020-76754-3
-
L. Menozzi et al., “Three-dimensional diffractive acoustic tomography,” Nature Communications, Vol. 16, No. 1, p. 1149, Jan. 2025, https://doi.org/10.1038/s41467-025-56435-3
About this article

The authors sincerely thank the anonymous reviewers for their helpful comments and suggestions. This study was funded by the Hunan Provincial Department of Education Key Project (25A0732), and Changsha Natural Science Foundation Project (grant No. kq2202313).
The datasets generated during and/or analyzed during the current study are available from the corresponding author on reasonable request.
Hu Dong: investigation, methodology, writing-original draft. Gang Liu: supervision, writing-review and editing.
The authors declare that they have no conflict of interest.
