Abstract
Novel Ti1-xFexO2 pigments (0-0.2) were successfully synthesized via the sol-gel method. Fe³⁺ doping preserved the rutile phase structure of TiO2 while suppressing crystal growth; as the Fe content increased, the color of the pigments gradually transitioned from light red to deep red and further to reddish-brown. Among them, Ti0.9Fe0.1O2 calcined at 700 ℃ exhibited the optimal red hue (25.7), while Ti0.95Fe0.05O2 treated at 800 ℃ demonstrated the best near-infrared reflectance performance (73.62 %). All samples showed notably higher reflectance in the NIR range compared to a commercial iron-oxide pigment of similar color (44.25 %). Furthermore, chromatic property tests after acid/alkali corrosion, together with thermogravimetric-differential scanning calorimetry analysis, confirmed the good chemical and thermal stability of this series of pigments. These energy-saving pigments show promising potential for application in high-efficiency energy-efficient building materials such as solar heat-reflective functional artificial stones.
1. Introduction
Energy shortage is a global challenge. Buildings account for roughly 40 % of total energy consumption, with summer cooling making up over one-third of building energy use [1]. To reduce energy consumption and emissions, promoting energy-efficient building materials is essential [2]. Thermal-reflective materials can effectively lower building surface temperatures by reflecting solar radiation [3]. However, most existing options are limited to white or light colors, which show poor stain resistance and fail to meet aesthetic demands for color variety.
Solar radiation consists of 43 % visible light (0.4-0.7 μm), 52 % near-infrared (NIR, 0.7-2.5 μm), and 5 % ultraviolet (0.3-0.4 μm) wavelengths [4]. Crucially, NIR radiation does not affect color perception, and its absorption only causes surface heating. Therefore, by reflecting NIR radiation while preserving the desired visible color, significant heat accumulation can be reduced without compromising aesthetics [5]. Coatings generally contain film-forming agents, additives, and pigments, with pigments playing the most important role in determining the overall solar thermal reflectance. Thus, improving the solar reflectance of pigments is key. Colorful thermal-reflective coatings that incorporate infrared-reflective pigments can retain high solar reflectance compared to conventional coatings of the same color [6], meeting both architectural color requirements and energy-saving objectives [7].
According to the Color Pigment Manufacturers Association (CPMA), commercially available environmentally friendly red pigments include molybdate red, cadmium red, lead antimonate, bismuth vanadate, ferric ferrocyanide, and complex inorganic pigments (mixed metal oxides). However, these pigments generally exhibit poor solar reflectance. Additionally, some pigments such as PbCrO4, PbMoO4, and CdSe are excluded from commercial use by the CPMA due to their toxicity [8]. Therefore, there is an urgent need to develop novel red inorganic pigments that are both near-infrared (NIR) reflective and environmentally friendly [9-10].
TiO2 is widely utilized as a coating filler owing to its excellent chemical and thermal stability, high whiteness, and good hiding power. Moreover, rutile-phase TiO2 demonstrates superior NIR reflectance [11]. Doping TiO2 offers a promising route for developing colorful pigments that retain high NIR reflectivity. The color of TiO2 can be tuned via elemental doping, which modifies its electronic band structure and enables selective photon absorption. For example, increasing the concentration of Fe³⁺ doping can shift the color of TiO2 from white to red [12], making it a potential candidate for high-performance, environmentally benign red pigments.
In this study, we report red pigments based on Ti1-xFexO2 ( 0, 0.05, 0.10, 0.15, and 0.20) synthesized via the sol-gel method at calcination temperatures of 600, 700, 800, and 900 °C. We systematically investigated their crystal structure, surface atomic state, chromatic properties, NIR reflectance performance, and chemical and thermal stability. Finally, this work proposes a novel method for evaluating the comprehensive performance of the colorful energy-saving reflective Ti1-xFexO2 pigments via response surface interaction analysis.
2. Materials and methods
2.1. Synthesis of Ti1-xFexO2 pigments
Synthesis of Ti1-xFexO2pigments (0-0.20) by sol-gel method.
Step 1: Prepare two solutions: Solution A: Take 50 mL tetrabutyl orthotitanate (TBOT, analytically pure) as the titanium source and add it to 100 mL anhydrous ethanol. Then, weigh iron nitrate according to the atomic ratio Ti:Fe (0.97:0.03, 0.095:0.05, 0.92:0.08, 0.9:0.1, 0.85:0.15, 0.8:0.20) and add it to the solution, stir vigorously for 30 minutes. Solution B: Weigh 50 mL of distilled water (Double-distilled water) and 20 mL of glacial acetic acid (analytically pure), add them to 50 mL of anhydrous ethanol, and adjust the pH to 1 with a small amount of nitric acid (analytically pure). Then, stir vigorously for 30 minutes using a magnetic stirrer.
Step 2: Slowly add Solution A to Solution B with stirring, then stir 30 min to form Fe-TiO2 sol via hydrolysis/condensation.
Step 3: Dry gel at 90 ℃ for 24 h, grind, then calcine in air at varied temperatures for 3 h. Sieve to obtain final pigment powders.
Reference: Commercial iron oxide pigments were used for color comparison.
2.2. Characterization methods
Powder XRD (Bruker D8 ADVANCE) was performed using Cu K radiation ( 0.15418 nm) at 40 kV/40 mA. Scans covered 10°-70° 2 with a step size of 0.02° and 0.2 s per step. Surface composition and chemical states were analyzed with a Shimadzu Axis Ultra DLD spectrometer (Al K, 1486.6 eV). The C 1s peak (284.6 eV) served as the energy reference. Analysis chamber pressure was kept at 10⁻9 Pa. Diffuse reflectance spectra (200-2200 nm) were recorded on a Lambda-950 spectrophotometer with an integrating sphere, using PTFE as a reference. NIR solar reflectance (, 700-2500 nm) was calculated according to ASTM G173-03, using the Eq. (1):
where is the measured reflectance and is the solar spectral irradiance from ASTM G173-03.
Color coordinates were obtained with an X-Rite 8200 colorimeter in CIE Labspace. Chroma () was calculated as . Color change () was calculated as .Alkali/acid immersion: Ti0.95Fe0.05O2 was immersed in 10 % (w/v) NaOH and 10 % (v/v) HCl separately, stirred 30 min, washed, dried, and weighed to determine mass loss. TG-DSC was performed on a NETZSCH STA449C under N2 from 50 ℃ to 1000 ℃ at 10 ℃/min, using 9.40 mg of sample.
3. Results and analysis
Fig. 1 presents the XRD patterns of Ti0.95Fe0.05O2 samples calcined at different temperatures (500-1000 ℃) for 3 h. As shown in Fig. 1, the sample calcined at 500 ℃ exhibits a pure anatase phase, while the sample calcined at 600 ℃ shows a mixed phase of anatase and rutile. All samples calcined at temperatures above 700 ℃ are identified as a pure rutile phase.
Fig. 2 presents the XRD patterns of Ti1-xFexO2 samples ( 0 to 0.20) calcined at 700 ℃ for 3 h.
Fig. 1XRD patterns of Ti0.95Fe0.05O2 samples calcined at different temperatures(left)
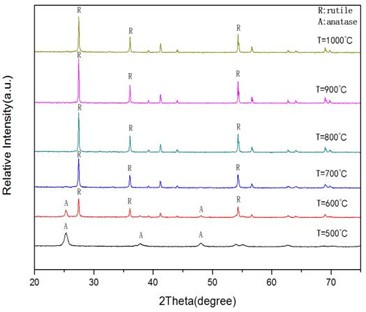
Fig. 2XRD patterns of Ti1-xFexO2 samples (x= 0 to 0.20) calcined at 700 ℃ (right)
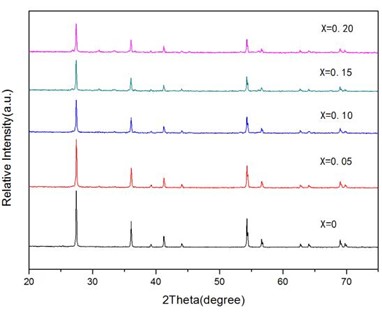
Detailed XRD analysis reveals that all diffraction peaks are well-matched with the standard diffraction pattern of rutile-phase TiO₂ (JCPDS card No. 99-0090), and no additional impurity phases are detected. This result indicates that the rutile crystal structure of TiO₂ remains intact with the increase in Fe3⁺ doping content.
The average grain size of Ti0.95Fe0.05O2 samples was calculated from XRD data using the Scherrer equation, and the results are listed in Table 1. It can be seen that the average grain size increases continuously with the elevation of calcination temperature, rising from 11.3 nm at 500 ℃ to 70.4 nm at 1000 ℃.
Table 1Grain size of Ti0.95Fe0.05O2 powder pigments calcined at different temperatures
(℃) | 500 | 600 | 700 | 800 | 900 | 1000 |
Average grain size (nm) | 11.3 | 41.2 | 46.6 | 60.4 | 66.2 | 70.4 |
Table 2 summarizes the average grain size of Ti1-xFexO2 samples (0-0.20) calcined at 800 ℃, which shows a gradual decrease with the increase in Fe3⁺ doping content, from 69.4 nm at 0 to 54.9 nm at 0.20. This phenomenon suggests that Fe3⁺ doping can effectively inhibit the crystal growth of TiO2. The underlying reason is that the ionic radius of Fe3⁺ (0.63 Å) is slightly smaller than that of Ti4⁺ (0.68 Å) [11], which disrupts the regular atomic arrangement of the TiO2 lattice and thus restricts the crystal growth process. Samples sintered at temperatures above 700 ℃ exhibited a pure rutile phase with smaller average particle size compared to those sintered at 800 ℃. Therefore, the sintering temperature for subsequent studies was set at 700 ℃.
Table 2Grain size of Ti1-xFexO2 (x ranges from 0 to 0.2) powder pigments
0 | 0.05 | 0.10 | 0.15 | 0.20 | |
Average grain size (nm) | 69.4 | 60.4 | 58.5 | 55.8 | 54.9 |
3.1. XPS analysis
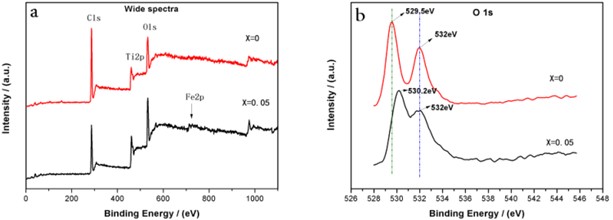
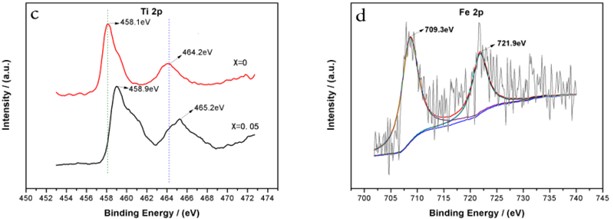
XPS analysis was performed on Ti0.95Fe0.05O2 and undoped TiO2 samples. The characteristic peaks of the main elements are clearly visible in the wide-scan spectrum (Fig. 3(a)) and the fitted Fe 2p spectrum (Fig. 3(d)), confirming the presence of Fe in the material. The highest peak appears at 532 eV, attributed to the signal of hydroxyl groups in trace organic residues remaining on the sample surface. This peak remains unchanged after doping. Fig. 3(b) compares the high-resolution O 1s spectra of undoped TiO2 and Ti0.95Fe0.05O2. The stronger peak at 529.5 eV is attributed to metal oxide (O2⁻) in the TiO2lattice. The metal oxide peak of Ti0.95Fe0.05O2 is observed at 530.2eV, which is higher than that of undoped TiO2 (529.5 eV). This increase in binding energy is attributed to the formation of Fe-O bonds in the lattice [12]. Fig. 3(c) shows the Ti 2p doublet XPS spectra. The Ti 2p1/2 and Ti 2p3/2 binding energies of Ti0.95Fe0.05O2 are located at about 465.2 eV and 458.9 eV, respectively, shifting to higher binding energies compared to undoped TiO2 (464.2 eV and 458.1 eV). The Ti 2p spectra mainly correspond to the Ti4⁺ oxidation state [13]. The observed shifts are attributed to the reduced coordination number of Ti and the shortening of Ti-O bonds, indicating the formation of Fe-O-Ti bonds in the doped sample. In summary, the XPS results confirm the successful incorporation of Fe3⁺ cations into the TiO2 lattice.
Fig. 3XPS spectra of the undoped TiO2 and Ti0.95Fe0.05O2 samples calcined at 800 ℃: a) wide spectra b) O 1s, c) Ti 2p, d) Fe 2p
3.2. Chromatic properties analysis
The CIE 1976 color coordinate values of Ti1-xFexO2 samples (0-0.20) calcined at 700 ℃ are presented in Table 3. The chromatic parameters are defined as follows: for lightness, for redness, for yellowness, and for chroma.
It can be clearly seen from Table 3 that with the systematic increase in Fe3⁺ doping content from 0.05 to 0.20, the lightness value () and yellowness value () of the pigments show a continuous decreasing trend. The redness value () increases first to the maximum of 25.70 at 0.10 and then decreases to 20.38 at 0.20, while the chroma value () follows the same variation trend as , peaking at 34.89 at 0.10 and then dropping to 24.77 at 0.20. As a result, the color tone of the Ti1-xFexO2 pigments changes gradually from light red to deep red and then to brownish red with the increase in Fe³⁺ doping content. The coloring mechanism of the prepared Ti1-xFexO2 pigments is mainly based on the O2p→Ti3d charge transfer transition of the TiO2 lattice, and this electron transition is further enhanced by the substitution of Ti4⁺ with Fe3⁺ in the TiO2 crystal structure [14].
Table 3Color coordinates of Ti1-xFexO2 calcinated at 700 ℃ and commercial pigment
Iron offered () | ||||
0.05 | 60.00 | 22.39 | 25.27 | 34.14 |
0.1 | 50.58 | 25.70 | 23.60 | 34.89 |
0.15 | 45.87 | 21.60 | 15.86 | 26.80 |
0.2 | 44.38 | 20.38 | 14.08 | 24.77 |
Commercial pigment | 34.57 | 21.95 | 11.22 | 24.65 |
3.3. NIR reflectance analysis
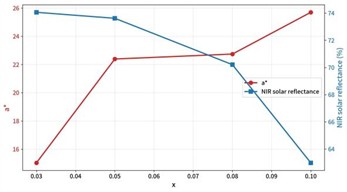
Ti0.9Fe0.1O2 exhibits the highest color coordinate value. To clarify the correlation between the color and reflectivity of Ti1-xFexO2, further optimization of Fe doping levels was conducted. Table 4 present the color coordinate and NIR solar reflectance values of Ti1-xFexO2 pigments (0.03-0.10) calcined at 700 ℃, together with the data of the commercial iron oxide pigment for comparison.
Table 4The detail values of NIR reflectance and color coordinates a* of Ti1-xFexO2 (x= 0.03-0.10)
Pigment composition | 0.03 | 0.05 | 0.08 | 0.10 | Commercial pigment |
15.03 | 22.39 | 22.74 | 25.70 | 21.95 | |
NIR solar reflectance (%) | 74.06 | 73.62 | 70.21 | 62.99 | 44.25 |
As shown in Table 4 and Figs.4-5, when the Fe3⁺ doping content increasing from 0.03 to 0.10, the NIR solar reflectance of Ti1-xFexO2 pigments shows a continuous decreasing trend from 74.06 % to 62.21 %, and the color coordinate a* value increasing from 15.03 to 25.7. The fundamental reason for this phenomenon is that the valence state of Fe3⁺ is lower than that of Ti4⁺ (the main metal cation in the lattice), and the substitution of Ti4⁺ with Fe3⁺ induces charge imbalance in the TiO2 lattice, thus promoting the formation of crystallographic point defects (e.g., oxygen vacancies) [15]. With the increase in Fe3⁺ doping content, the number of lattice defects accumulates continuously, which significantly strengthens the absorption of visible light and NIR light and weakens its reflection. Notably, all the prepared Ti1-xFexO2 samples (0.03, 0.05, 0.08, 0.10) exhibit a much higher NIR solar reflectance than the commercial iron oxide pigment with similar color (44.25 %).
Fig. 4The pigments photographs of Ti1-xFexO2(x= 0.03-0.10) (left)
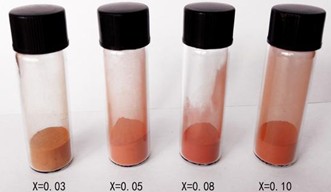
Fig. 5The relationship between NIR reflectance values and a* with Fe doping content x (right)
3.4. Chemical and thermal stability analysis
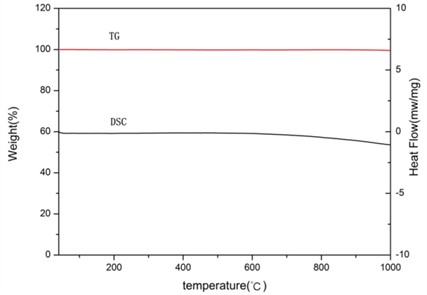
Table 5 presents the color properties of the pigments after acid/alkali tests, compared with untreated samples, the values of , , and showed minimal differences after washing with 10 % HCl and 10 % NaOH. The total color difference () was calculated using . The values was less than 2 % (the qualification requirement for the coating or exterior wall pigment industry is less than 2 %), indicating good chemical stability against the tested acid/alkali. And TG-DSC test results (Fig. 6) showed that the negligible weight change and phase transition indicate that the pigment has good thermal stability.
Table 5Color coordinates of the Ti0.95Fe0.05O2 after acid/alkali resistance tests
Condition | ||||
Raw | 61.55 | 19.82 | 25.61 | 0 |
10 % HCl | 60.41 | 19.68 | 25.63 | 1.14 |
10 % NaOH | 61.43 | 18.97 | 24.90 | 1.11 |
Fig. 6TG-DSC curves of Ti0.95Fe0.05O2 pigment
4. Conclusions
The Ti1-xFexO2 red pigment series (0-0.20) was successfully synthesized via the sol-gel method. Research shows that the color of the pigments gradually shifts from light red to deep red and eventually to brownish red as the Fe3⁺ doping content increases. Among the samples, Ti0.9Fe0.1O2 calcined at 700 ℃ exhibits the optimal red hue (redness value 25.70), while Ti0.95Fe0.05O2 treated at 700 ℃ demonstrates the best near-infrared reflectance performance (reflectance of 73.62 %). All samples significantly outperform commercially available iron-oxide pigments of similar color (reflectance of 44.25 %). Acid and alkali corrosion resistance tests, along with thermal analysis, further confirm the good chemical and thermal stability of this pigment series. in summary, this energy-saving inorganic pigment, which also possesses solar heat-reflective functionality, shows promising potential for applications in new energy-efficient building materials such as solar heat-reflective artificial stone.
References
-
Y. Li, W. Wang, Y. Wang, Y. Xin, T. He, and G. Zhao, “A review of studies involving the effects of climate change on the energy consumption for building heating and cooling,” International Journal of Environmental Research and Public Health, Vol. 18, No. 1, p. 40, Dec. 2020, https://doi.org/10.3390/ijerph18010040
-
C. Arumugam and S. Shaik, “Transforming waste disposals into building materials to investigate energy savings and carbon emission mitigation potential,” Environmental Science and Pollution Research, Vol. 28, No. 12, pp. 15259–15273, Nov. 2020, https://doi.org/10.1007/s11356-020-11693-0
-
J. Wang, S. Liu, Z. Liu, X. Meng, C. Xu, and W. Gao, “An experimental comparison on regional thermal environment of the high-density enclosed building groups with retro-reflective and high-reflective coatings,” Energy and Buildings, Vol. 259, p. 111864, Mar. 2022, https://doi.org/10.1016/j.enbuild.2022.111864
-
T. Kono, Y. Naruse, J. Yamada, and U. M. Rajagopalan, “Exchange of heat radiation between human body and urban environment: characterization in visible, near-infrared, and far-infrared regions,” Applied Sciences, Vol. 12, No. 20, p. 10412, Oct. 2022, https://doi.org/10.3390/app122010412
-
A. Lanfranchi, H. Megahd, P. Lova, and D. Comoretto, “Multilayer polymer photonic aegises against near-infrared solar irradiation heating,” ACS Applied Materials and Interfaces, Vol. 14, No. 12, pp. 14550–14560, 2022, https://doi.org/10.1021/acsami.1c25037
-
W. Zhang, Y. Zhuang, and Q. Zhang, “Preparation and properties of multi-color coatings with ultra-low near-infrared reflectivity,” Infrared Physics and Technology, Vol. 136, p. 105122, 2024, https://doi.org/10.1016/j.infrared.2024.105122
-
K. Lv, X. Liang, L. Zhang, Z. Zhang, and Y. Gao, “A black pigment that shows strong near-infrared reflectivity for solar heat control,” Ceramics International, Vol. 50, No. 10, pp. 16901–16908, May 2024, https://doi.org/10.1016/j.ceramint.2024.02.164
-
J. Li, S. Kumari, and M. A. Subramanian, “Solid state inorganic color pigments: ancient to modern,” in Comprehensive Inorganic Chemistry III, Elsevier, 2023, pp. 560–593, https://doi.org/10.1016/b978-0-12-823144-9.00168-0
-
V. Elakkiya and S. Sumathi, “Vanadium substituted AlPO4 as environmentally benevolent cool yellow pigment,” Optical Materials, Vol. 141, p. 113946, 2023, https://doi.org/10.1016/j.optmat.2023.113946
-
S. Abima and S. Sumathi, “Influence of method of synthesis on the colour and NIR reflective properties of bismuth and vanadium doped cerium phosphate,” Journal of Solid State Chemistry, Vol. 324, p. 124140, Aug. 2023, https://doi.org/10.1016/j.jssc.2023.124140
-
A. Mancuso et al., “Photocatalytic degradation of crystal violet dye under visible light by Fe-doped TiO2 prepared by reverse-micelle sol-gel method,” Nanomaterials, Vol. 13, No. 2, p. 270, 2023, https://doi.org/10.3390/nano13020270
-
E. H. N. S. Thaines, A. C. Oliveira, L. A. Pocrifka, H. A. Duarte, and R. G. Freitas, “Influence of Fe-doping on the structural and electronic properties of the TiO2 anatase: rutile,” the Journal of Physical Chemistry C, Vol. 127, No. 46, pp. 22518–22529, 2023, https://doi.org/10.1021/acs.jpcc.3c01780
-
R. Zhu et al., “Engineering high-efficient phosphorus-doped TiO2 photocatalyst employed for a sophisticated visible-light driven photocatalytic coating,” Progress in Organic Coatings, Vol. 189, p. 108272, 2024, https://doi.org/10.1016/j.porgcoat.2024.108272
-
A. Liboon, S. R. Cabo, R. B. Unabia, F. R. G. Bagsican, and R. T. Candidato, “Phase composition, microstructure, and optical characteristics of spin-coated La-TiO2 and Fe-TiO2,” Physica Status Solidi (a), Vol. 220, No. 11, p. 2200756, 2023, https://doi.org/10.1002/pssa.202200756
-
G. Han, J. Y. Kim, K.-J. Kim, H. Lee, and Y.-M. Kim, “Controlling surface oxygen vacancies in Fe-doped TiO2 anatase nanoparticles for superior photocatalytic activities,” Applied Surface Science, Vol. 507, p. 144916, 2020, https://doi.org/10.1016/j.apsusc.2019.144916
About this article

The research described in this paper was financially supported by 2022 Science and Technology Innovation Plan Project of Guangdong Provincial Department of Housing and Urban-Rural Development (Grant No 2022-K25-534807), Science and technology planning project of Guangzhou Municipal Construction Group Co., Ltd (Granted No [2022]-KJ009).
The datasets generated during and/or analyzed during the current study are available from the corresponding author on reasonable request.
The authors declare that they have no conflict of interest.

