Abstract
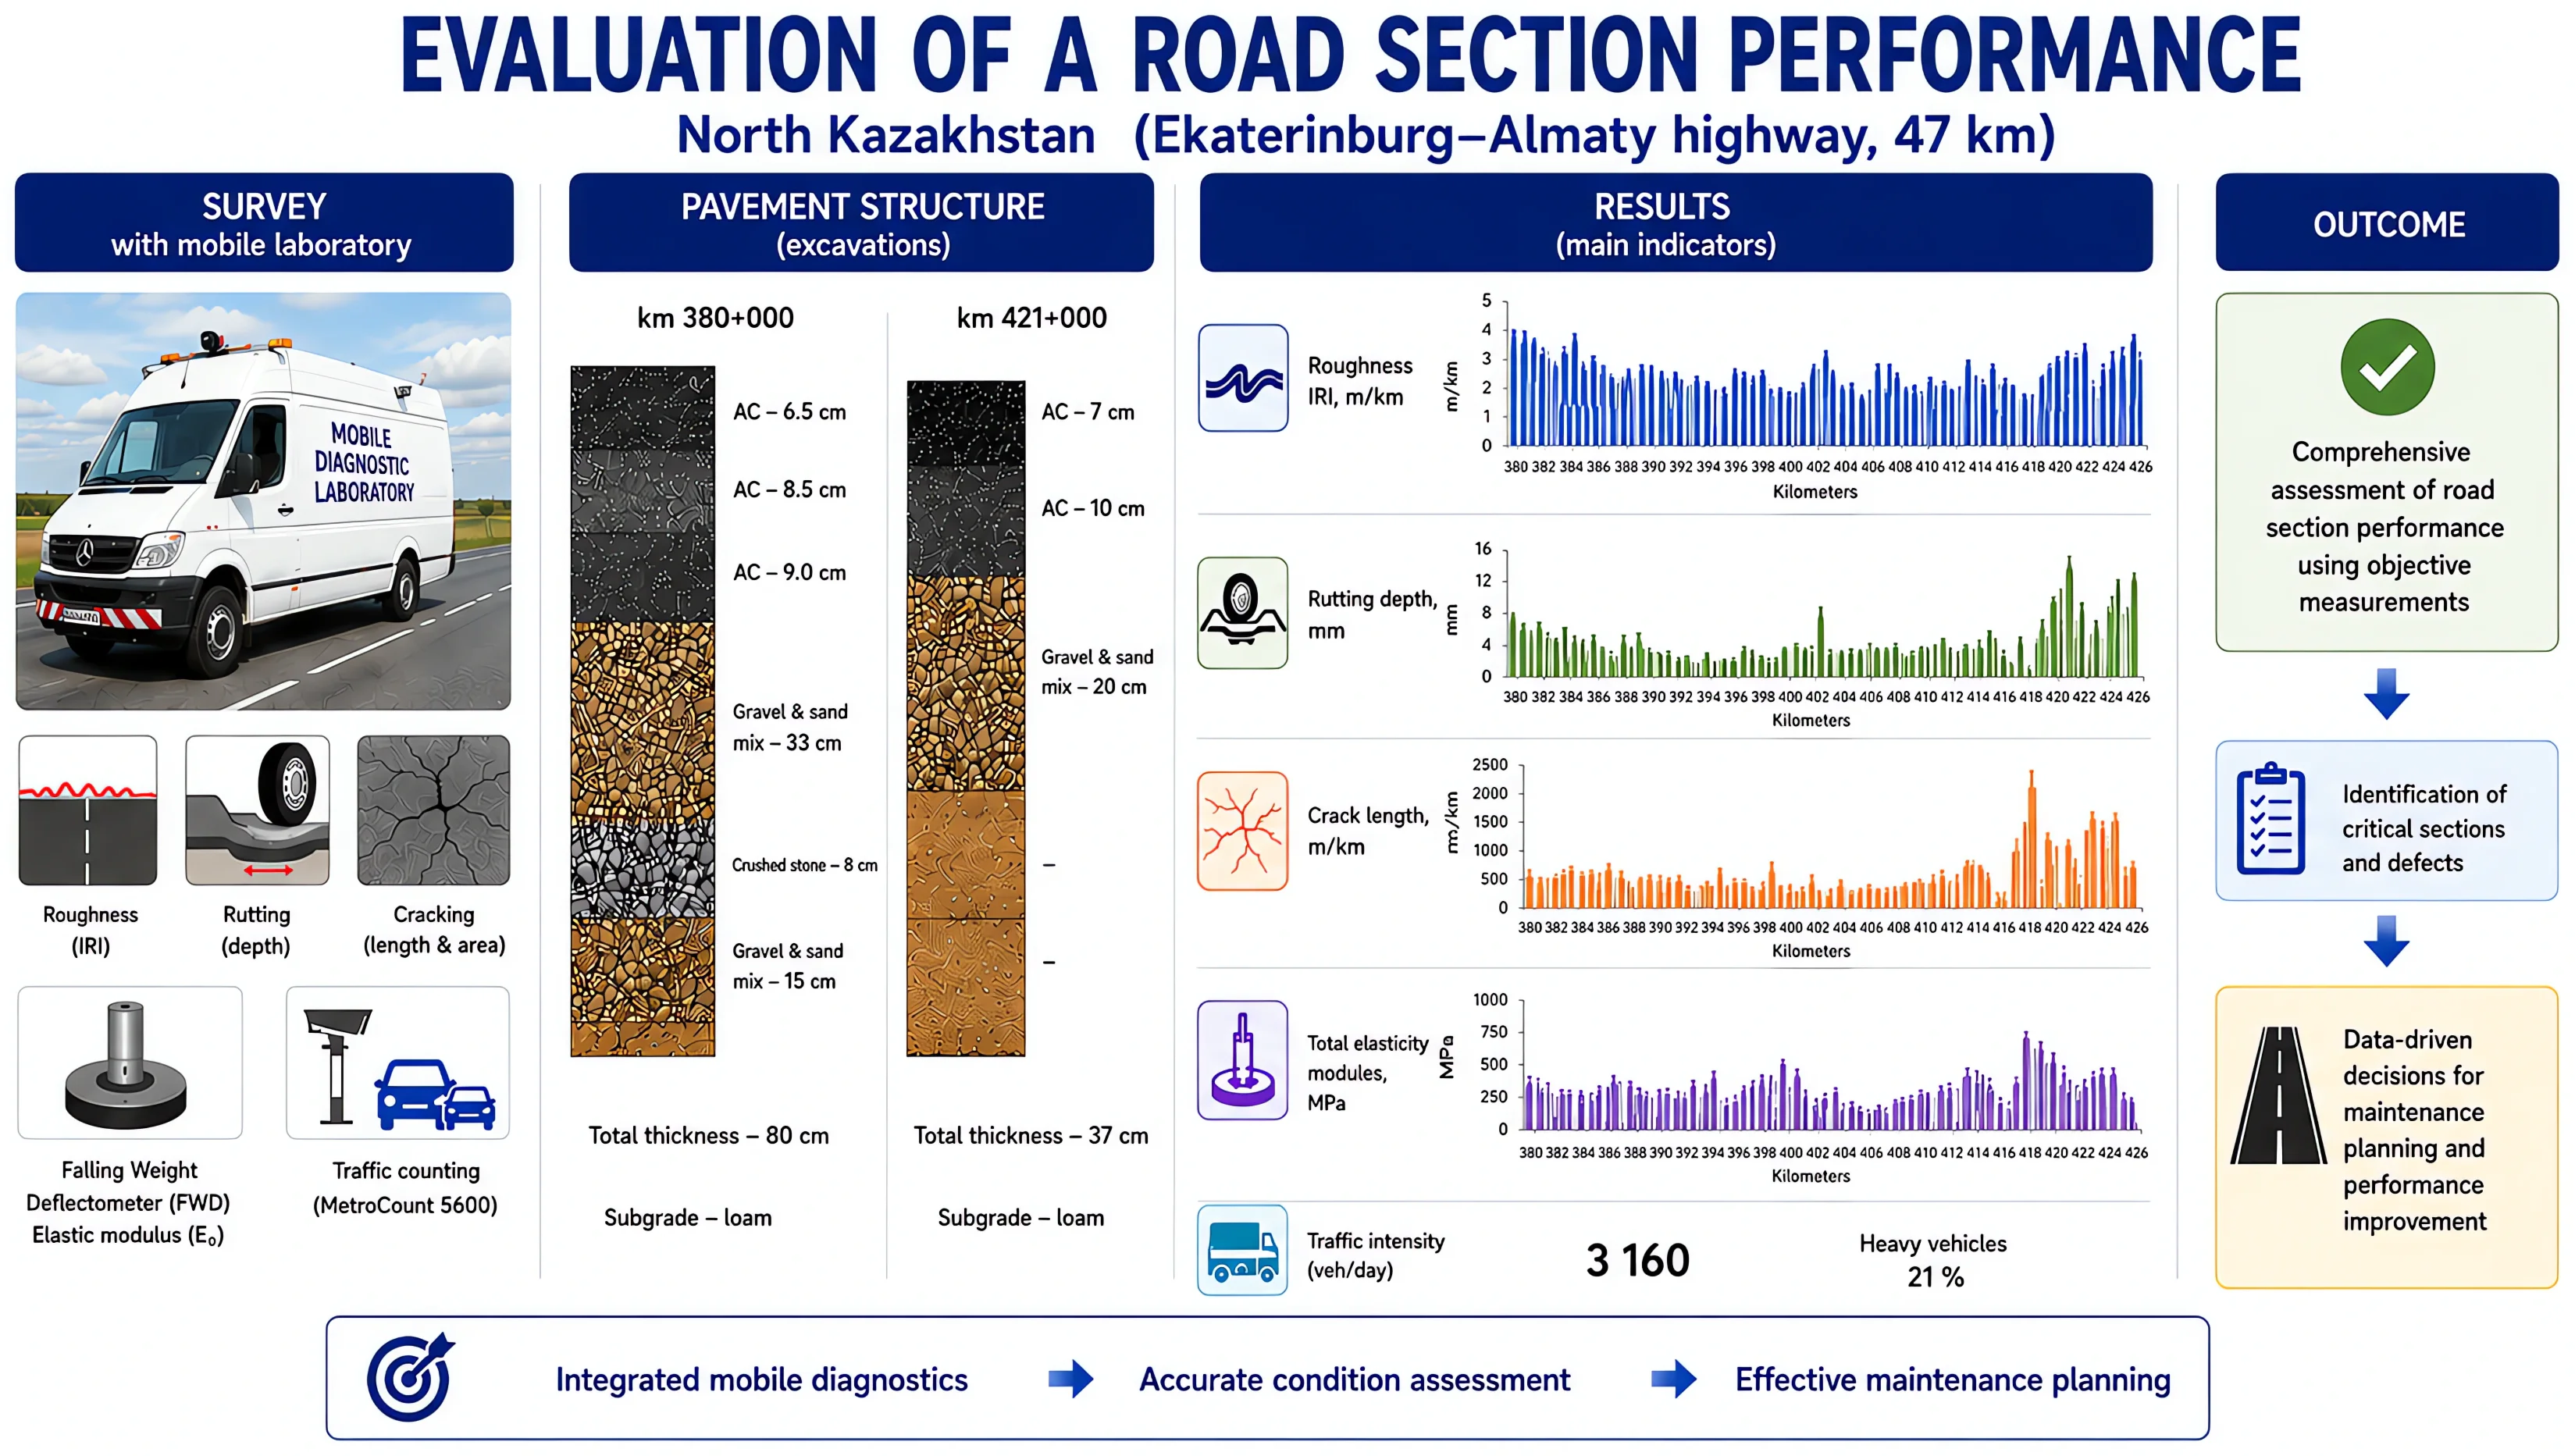
In this work using a mobile laboratory the operational condition of a road section (length: 47 km) of the “Ekaterinburg-Almaty” road located in the Kostanay region (northern Kazakhstan) was carried out. During the survey of the road section the main indicators as roughness, rut depth, total length of longitudinal and transverse cracks, areas of asphalt concrete pavement with a block cracking, elasticity modulus of the pavement structure have been evaluated. Intensity and composition of traffic is carried out by the MetroCount 5600.
Highlights
- A 47-km highway section was evaluated using a mobile diagnostic laboratory and traffic monitoring system.
- Cracking was the dominant pavement distress, whereas rut depth remained below the allowable limit along the entire section.
- More than 87% of the pavement achieved an excellent roughness rating based on the International Roughness Index.
- The combination of extensive cracking and shallow rutting show that the asphalt binder is very stiff for the regional climate.
1. Introduction
In addition to the mechanical impacts of vehicle wheels [1, 2], climatic factors have a significant impact on road pavement structures and subgrades [3-5]. Therefore, all other things being equal, the performance of highways depends on the regional climate. Kazakhstan ranks 9th in the world by area (2,725,000 km2). Its regional climatic conditions vary significantly: in the south the climate is hot in the summer; the central, northern, and eastern regions are characterized by cold winters. Therefore, it is important to evaluate the performance of road pavement structures under different regional conditions [6].
In this work using a mobile laboratory which are currently used in many countries around the world [7, 8] the operational condition of a road section (length: 47 km) of the “Ekaterinburg-Almaty” road located in the Kostanay region (northern Kazakhstan) was carried out.
2. Highway section
2.1. Short description
The length of the observed section is 47 km and is located on the “Yekaterinburg-Almaty” road (380-427 km). The section has the following main indicators: road category – III; number of traffic lanes – 2; carriageway width – 7.0 (2×3.5 m); shoulder width – 2×2.50 m. The section is located at a distance of 85 km from Kostanay city (Northern region of Kazakhstan) in the direction to Yekaterinburg (Russia). In 2005, a full depth repair of pavement was carried out on the section, and in 2014-2015 midterm repair was carried out-seal coat surface treatment was arranged.
2.2. Pavement structure
To determine the existing structure of the pavement, excavations of the pavement and subgrade were carried out at two places (Table 1): 1 – km 380+000; 2 – km 421+000. The excavation results are presented in Table 1.
Table 1Pavement structure
Km 380+000 | Km 421+000 |
Asphalt concrete – 6,5 | Asphalt concrete – 7 cm |
Asphalt concrete – 8,5 | Asphalt concrete – 10 cm |
Asphalt concrete – 9,0 | Gravel and sand mix – 20 cm |
Gravel and sand mix – 33 cm | – |
Crushed stone – 8 cm | – |
Gravel and sand mix – 15 cm | – |
Total thickness – 80 cm | Total thickness – 37 сm |
Subgrade – loam | Subgrade – loam |
3. Methods
3.1. Mobile diagnostic laboratory
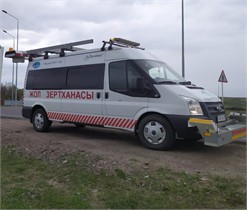
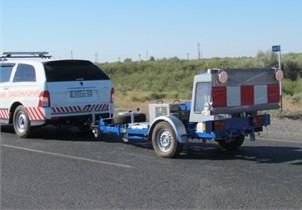
A mobile diagnostic laboratory (Fig. 1(a)) which is equipped with laser and electronic systems for measuring and processing the roughness of a pavement, rutting and defects (cracks) on a pavement surface was used in the work [9]. This mobile laboratory also includes a falling weight deflectometer (FWD) to assess a pavement capacity (Fig. 1(b)).
Fig. 1a) A mobile diagnostic laboratory; b) a falling weight deflectometer. The photographs presented in this paper were taken by the co-author Azamat Zhaisanbayev during field studies carried out in July 2017 on a road section (length: 47 km) of the “Ekaterinburg-Almaty” highway located in the Kostanay region, Kazakhstan
a)
b)
The following indicators were determined by the laboratory: rut depth, roughness, cracking and bearing capacity of the road section. The roughness of the section pavement surface is characterized by the International Roughness Index (IRI, m/km) [10].The cracking is estimated by two indicators: the pavement surface which is occupied by block cracks and the total length of longitudinal and transverse cracks.
The bearing capacity of the pavement structures is characterized by the total elasticity modulus [11] (MPa) determined by the formula:
where is a specific load on a pavement surface, MPa; is a diameter of a loading plate, mm; is an average value of the Poisson’s ratio of the pavement structure, equal to 0.3; is a maximum deflection of the pavement surface, mm.
3.2. Intensity and composition of traffic
The MetroCount 5600 vehicle classifier system with two rubber pneumatic tubes (two pneumatic tubes) [12] was used to determine the intensity and classification of traffic on the road section. This system defines all vehicles passing on the selected section and divides them into 12 classes.
4. Results and discussion
4.1. Intensity and composition of traffic
On the considered highway section the intensity and composition of traffic measured in 2017. Results of measured intensity are shown in Table 2: light vehicles (cars and minibuses) predominate (more than 50.1 %) in the traffic; single trucks with axle loads up to 2 tons – 31.7 %, single trucks with axle loads 5-10 tons – 3.5 %, trucks with trailers and tractors with semi-trailers – 14.7 %.
Thus, it can be considered that the pavement structure on the section is under average mechanical loading conditions.
Table 2Traffic composition in 2017
Type of vehicle | Traffic intensity | ||
veh/day | % | ||
Light vehicles and minibuses | 2175 | 50,1 | |
Single trucks | ˂ 2 ton | 1378 | 31,7 |
5-10 ton | 150 | 3,5 | |
Trucks with trailers and tractors with semi-trailers | 639 | 14,7 | |
Total | 4342 | 100 | |
4.2. Cracks and cracks network
The asphalt concrete pavement degradation in the form of cracks was characterized by the following two indicators: 1) the area of the asphalt concrete pavement on which there is a network of cracks and 2) the total length of longitudinal and transverse cracks.
Fig. 2Pavement area with a cracks network
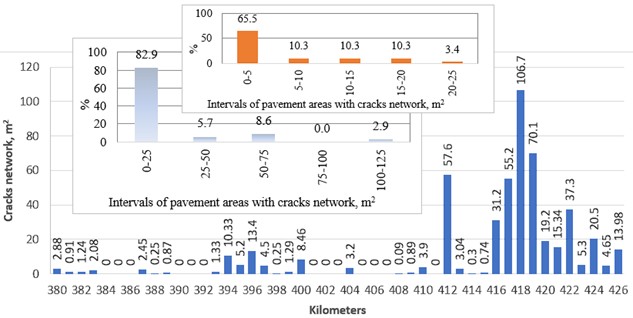
The areas of the asphalt concrete pavement with a cracks network at different kilometers of the highway section are shown in Fig. 2 which shows that the values of cracks network areas vary over a very wide range: from 0.25 m2 (388) to 106.7 m2 (418 km). At the same time, half of all areas with a cracks network (82.9 %) have a value of up to 25 m2 (Fig. 2).
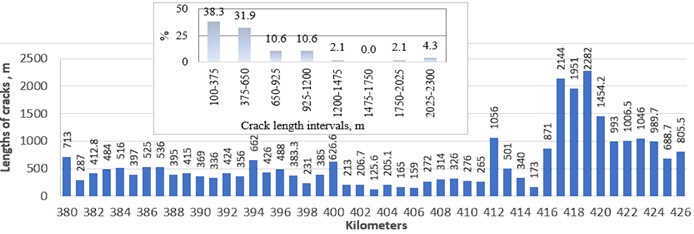
The values of the total lengths of longitudinal and transverse cracks on the asphalt concrete pavement are shown in Fig. 3. This figure shows that the lengths of cracks at different kilometers of the highway section are not uniformly distributed, they have large spreads: from 125.6 m (a minimum value) to 2282 m (a maximum value). At the same time, 70.2 % of the cracks lengths are in the range from 100 m to 650 m (Fig. 3). In this interval, the average length of cracks is 375 m.
Fig. 3Total lengths of longitudinal and transverse cracks
4.3. Rut depth
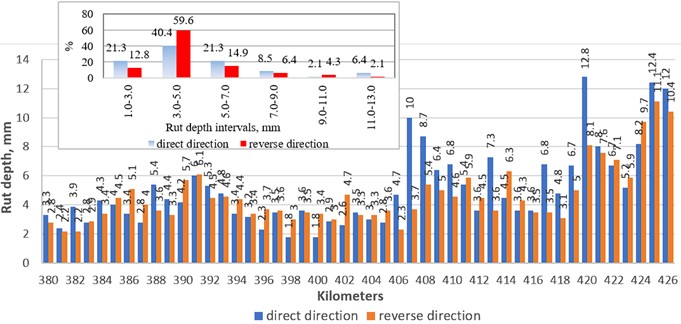
It is clearly seen (Fig. 4) that both in the direct and reverse directions the rut depth on puts lines of the asphalt concrete pavement along the length of the section is distributed significantly not uniformly. The minimum and maximum rut depths in the direct direction are 1.8 mm and 12.8 mm, respectively, and in the reverse direction: 2.2 mm and 11.1 mm, respectively. It should be noted that nowhere in the section under consideration the rut depth no exceeds the permissible maximum value of 20 mm [13].
Fig. 4Rut depths on the asphalt concrete pavement
4.4. Roughness
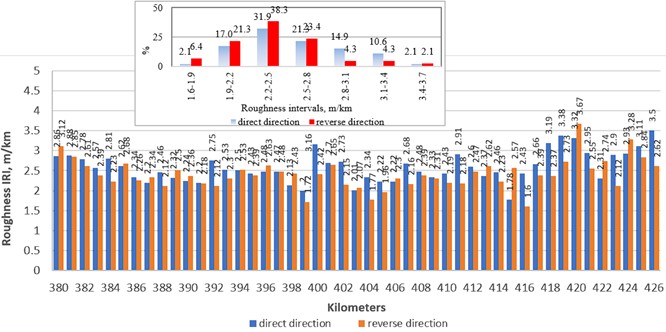
From the histogram (Fig. 5) it can be seen that the IRI value in the direct and reverse directions has an approximately the same distribution over the highway section. Minimum and maximum IRI values in the direct direction equal to 1.7 m/km and 4.2 m/km, respectively, and in the reverse direction –1.7 m/km and 4.2 m/km, respectively. As can be seen from Fig. 5, in the direct direction, more than 50 % (in fact 53.2 %) of the IRI values are in the range from 2.2 to 2.8 m/km; in the reverse direction, more than 60 % (61.7 % in fact) of the IRI values are in the range from 2.2 to 2.8 m/km.
According to the standard on pavement surface roughness in Kazakhstan [10], at traffic intensity from 3000 to 4500 veh/day, highway sections with IRI value up to 3.1 m/km are rated as “excellent” and with IRI value from 3.1 to 3.6 m/km – as “good”. According to Fig. 5, we determine that 87 % and 94 % of the section in the direct and reverse directions, respectively, have an “excellent” rating in roughness, and 13 % and 6 %, respectively, have a “good” rating. Thus, it can be concluded that the highway section at the time of the survey had a good operational condition.
Fig. 5Roughness of the asphalt concrete pavement
4.5. Elasticity modulus
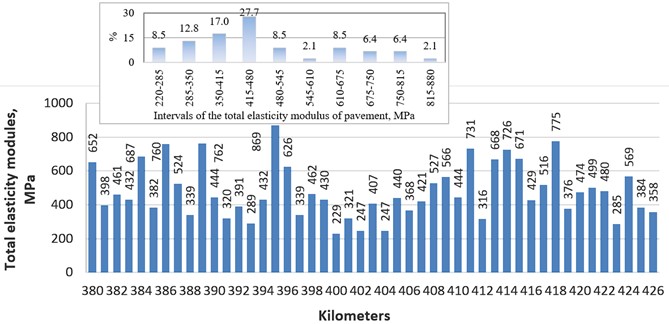
On the considered road section the total elasticity modulus of the pavement was measured only in direct (Kostanay-Yekaterinburg) direction. The values of the total elasticity modulus are shown in Fig. 6. Note that the modulus values have large spreads: minimum total elasticity modulus is 229 MPa (400 km), maximum total elasticity modulus is 869 MPa (395 km); the maximum value of the modulus is 3.8 times greater than its minimum value. At the same time, more than half (57.5 %) of the modulus values are in the range of 285-480 MPa.
Fig. 6Total elasticity modulus of the pavement
5. Conclusions
1) The number of cracks (longitudinal and transverse) on the asphalt concrete pavement is excessive; these cracks appeared due to low temperatures during cold periods.
2) The rut depth along the entire section does not exceed the permissible value.
3) The roughness of the asphalt concrete surface is good.
4) An excessively large number of cracks and minimal rut depths suggest that the bitumen binder is significantly stiff, i.e., not suitable for the climatic conditions of the region.
5) To slow down further destruction of the asphalt concrete pavement it is recommended to seal all types of cracks on it with a bitumen mastic and treat its surface with a rejuvenating material.
References
-
E. J. Yoder and M. W. Witczak, Principles of Pavement Design. New Jersey: Wiley, 2008, p. 736, https://doi.org/10.1002/9780470172919
-
A. T. Papagiannakis and E. A. Masad, Pavement Design and Materials. New Jersey: Wiley, 2012, p. 560, https://doi.org/10.1002/9780470259924
-
B. B. Teltayev and E. A. Suppes, “Temperature and moisture in a highway in the south of Kazakhstan,” Transportation Geotechnics, Vol. 21, p. 100292, Dec. 2019, https://doi.org/10.1016/j.trgeo.2019.100292
-
B. Teltayev, J. Liu, and E. Suppes, “Distribution of temperature, moisture, stress and strain in the highway,” (in Russian), Magazine of Civil Engineering, Vol. 83, No. 7, pp. 102–113, 2018, https://doi.org/10.18720/mce.83.10
-
B. B. Teltayev, A. I. Baibatyrov, and E. A. Suppes, “Characteristics of highway subgrade frost penetration in regions of Kazakhstan,” Japanese Geotechnical Society Special Publication, Vol. 2, No. 47, pp. 1664–1668, 2016, https://doi.org/10.3208/jgssp.kaz-08
-
B. Teltayev, A. Massanov, Y. Aitbayev, and A. Zhaisanbayev, “Performance of a semi-rigid pavement: A North Kazakhstan case study,” Engineered Science, Vol. 29, p. 1089, Jan. 2024, https://doi.org/10.30919/es1089
-
D. M. Barbieri and B. Lou, “Instrumentation and testing for road condition monitoring – A state-of-the-art review,” NDT and E International, Vol. 146, p. 103161, 2024, https://doi.org/10.1016/j.ndteint.2024.103161
-
X. Yang, J. Zhang, W. Liu, J. Jing, H. Zheng, and W. Xu, “Automation in road distress detection, diagnosis and treatment,” Journal of Road Engineering, Vol. 4, No. 1, pp. 1–26, Mar. 2024, https://doi.org/10.1016/j.jreng.2024.01.005
-
“Recommendations for instrumental examination of the transport and operational condition of highways by multifunctional mobile laboratory complexes,” R RK 218-136-2017, Astana, Kazakhstan, 2017.
-
“Instructions for assessing roughness of road surfaces,” PR RK 218-03-2016, Astana, Kazakhstan, 2016.
-
“Roads and airfields. Methods for determining the elasticity modulus of flexible pavements and their classification,” ST RK 1293-2019, Nur-Sultan, Kazakhstan, 2019.
-
“MetroCount 5600 Vehicle Classifier System.” Telway.pl, 2022, https://telway.pl/wp-content/uploads/2022/03/metrocount-5600-data-sheet.pdf
-
“Instructions for diagnosis and assessment of the transport and operational condition of highways,” PR RK 218-27-2014, Astana, Kazakhstan, 2014.
About this article

The authors have not disclosed any funding.
The datasets generated during and/or analyzed during the current study are available from the corresponding author on reasonable request.
The authors declare that they have no conflict of interest.

