Abstract
This research demonstrates a simple and economical way to assess road pavement conditions through any common smartphone. The phone was safely mounted inside a vehicle and sensor readings had been recorded during vehicle travel along different road segments. The vertical movement had been computed from the phone’s accelerometer and its location had been monitored through GPS. These two measurements made it feasible to predict pavement conditions without access to expensive instruments. As a data observation tool, a python script calculated Roughness Index (RI) based on vertical acceleration's root mean square (RMS) in short time windows. The output RI measures were categorized into three groups: smooth, moderate, and rough. The data were represented in green, yellow, or red dots onto a map and represented road quality well along the corridor. To better measure pavement condition, the campus road network was disaggregated into distinct sections based on natural corridor conditions such as intersections, curves, and direction changes. Breaking it down in this way enabled each section to be studied independently. The data showed strong variation between sections. Road segments near entrances and access points had repeatedly high Roughness Index (RI) values, indicating surface deterioration, patching, and unevenness. Straight internal segments and long corridors, on the other hand, had low RI values, which meant relatively smooth and well-maintenance pavement. This section-by-section analysis pinpointed areas in the campus network in need of maintenance and highlighted conditions based on pavement usage and location.
1. Introduction
Roads maintenance is a must for transportation safety, ride comfort and asset management. Conventional approaches like visual inspections or specialized profiling equipment are widely considered to be manual, costly and tedious. As the availability of sensor-enabled mobile devices such as smartphones increases, they have been investigated to provide cost-effective alternatives for examining pavement conditions.
Smartphones can record motion and geographical data in real time since they have accelerometers, gyroscopes, and GPS built in. By monitoring vertical acceleration, which indicates surface roughness, and connecting it to position data, these features enable the evaluation of road conditions. Smartphones can use GIS technologies to map pavement conditions and assess road roughness with little computing power [1].
Using data from smartphone sensors, this study assesses the surface roughness of the roads on the Near East University campus. The main output is the Roughness Index (RI), calculated from the RMS of the vertical acceleration. Using RI values, the road segments can be classified as Smooth, Moderately Rough and Severely Deteriorated which will help for planning maintenance supplying better experience to users. The other data was collected along three zones (Campus 1, Campus 2, and Campus 3) from planned routes that were driven in the car with motion and GPS recording.
Many institutions are unable to promptly identify road deterioration because they lack access to advanced pavement monitoring equipment, which raises repair costs. This emphasizes the necessity of a workable and expandable solution. This study provides a low-cost way to identify damaged road segments within a localized network utilizing smartphone sensors and a section-based analysis strategy. One goal of the research is splitting up the road system, then measuring every part using RI values before showing findings through a color coded map. Better roadway conditions do more than boost rider ease and security – they lower exhaust output, fuel consumption, and journey duration at once [2]. Rather than relying on human observation, tools with sensors deliver exact assessments backed by numbers. Finding surface flaws early via RI inspection leads to faster repairs; these timely actions stretch out usable lifespan while shrinking expenses over years.
2. Related work
Pavement condition monitoring is essential for infrastructure management in order to guarantee safety and enable efficient repair. Traditional methods such as visual inspections, Falling Weight Deflectometer (FWD) testing, and profilometer surveys are widely used, despite the fact that they are often costly, time-consuming, and often subjective. Alternative methods, especially vibration-based and in-situ procedures, have been developed as a result of these constraints.
By sensing vibrations from the car body or wheels, vehicle-mounted accelerometers have been used to identify road surface roughness. Similar to this, smartphone-based monitoring makes use of integrated gyroscopes and accelerometers, providing an affordable and expandable option [2]. The viability of employing mobile devices for road condition evaluation has been confirmed by studies that have found substantial similarities between indices produced from smartphones and conventional metrics like the International Roughness Index (IRI). For ongoing pavement monitoring, embedded wireless sensor networks (WSNs) have also been investigated. Real-time strain, temperature, and vibration measurements can be made using sensors built into pavements. Wireless accelerometers can efficiently record structural vibrations and facilitate long-term pavement and bridge condition monitoring, according to research [3].
To analyze vibration data and identify defects like potholes and fractures, sophisticated signal processing techniques like Wavelet Transforms and Fast Fourier Transform (FFT) are often utilized. Recently, machine learning methods like Support Vector Machines (SVM), Random Forests (RF), and deep learning models like Convolutional Neural Networks (CNNs) and Long Short-Term Memory (LSTM) networks have improved the accuracy of pavement condition classification [8], [9]. Performance is further improved by sensor fusion techniques that combine vibration and visual data. There are still difficulties in spite of these developments. Consistency in vibration data can be impacted by variations in vehicle type, speed, and environmental factors [10]. Crowdsourced data may also have quality issues due to variations in smartphone types and user behavior [11]. Furthermore, the lack of benchmark datasets and standardized data collection methods hinders study comparison. Researchers emphasize the need for standardized frameworks, real-world validation, and large-scale deployment to boost reliability.
3. Methodology
This chapter presents research design, sampling procedure, data collection tool, and analysis techniques employed for the assessment of pavement surface condition on the campus of the NEAR EAST University by utilizing smartphone sensor data.
3.1. Research design
This work used a quantitative, observational field design. This was based on the collection of motion and position data by a mobile sensing system for road surface roughness measurement. A smartphone system was used because of its affordability, ease of accessibility, and proven reliability in current studies. In-vehicle sensing and post-processing by pavement condition assessment through varied roadway segment types were highlighted.
3.2. Data collection tools/materials
An iPhone with installed-onboard accelerometer, gyroscope, and GPS sensors was the primary data acquisition tool. A rigid fixed dash holder was used to rigidly fasten the phone for minimum motion noise. Physics Toolbox mobile app was employed for data recording, which stored:
1) Three-axis acceleration (, , ).
2) Angular velocity (, , ).
3) PS coordinates (latitude, longitude).
4) Speed and timestamp.
Data was recorded during car motion on several predefined routes on the campus. Each route was segmented according to its purpose, for instance:
1) Main roads (high-traffic corridors).
2) Entry and exit points (most worn areas).
3) Service routes (delivery and maintenance vehicle routes).
4) Data for each of the segments were exported in CSV format and stored for further analysis.
3.3. Sensor sensitivity and measurement reliability
The vibration data in this study was collected using a smartphone’s built-in Micro-Electro-Mechanical System (MEMS) accelerometer. Modern smartphone accelerometers can detect small motion changes, with a typical range of ±2 g to ±16 g and sufficient sensitivity for transportation and structural monitoring applications.
Acceleration data was recorded at a sampling frequency of about 50 Hz to capture vibrations caused by vehicle pavement interaction. This is within the typical range of 20 to 100 Hz for detecting pavement roughness. To reduce unwanted movement and guarantee constant measurements throughout the data gathering procedure, the smartphone was firmly fixed on the dashboard. Studies have demonstrated substantial correlations between smartphone-based measures and established indices like the International Roughness Index (IRI), despite the fact that smartphone sensors are less accurate than specialized pavement equipment. They are therefore an affordable choice for first pavement evaluation. However, variables like suspension, device placement, and vehicle speed can affect outcomes. By keeping the speed and device placement constant throughout the data collecting process, these effects were reduced in our investigation.
3.4. Data analysis procedures
The most prevalent condition measurement for evaluating pavement condition was the Roughness Index (RI). RI was calculated from the root mean square (RMS) of vertical acceleration () for a 50-sample moving window. In the equation used:
where: RI – roughness index, – individual vertical acceleration values, – number of samples per window (50).
This process is in agreement with existing vibration-based pavement analysis models [1] and can effectively estimate surface irregularity. For interpretation of results, RI values were grouped in the following classes of roughness:
Table 1Summary statistics of roughness index
RI range | Road condition |
RI < 1.5 | Smooth |
1.5 ≤ RI < 2.5 | Moderate |
RI ≥ 2.5 | Rough |
According to this classification, each segment was assessed visually and by statistics. Areas of high RI typically corresponded to patched pavement, cracks, or dips, especially around intersections, entrances, and aging service roads. Low RI values were observed on main roads and newly resurfaced roads.
4. Results and discussion
4.1. Roughness index statistics
The analysis of Roughness Index (RI) values derived from vertical acceleration readings revealed significant variability in pavement condition across the surveyed campus roads. A statistical summary of the dataset is as follows:
1) Minimum RI: 0.65.
2) Maximum RI: 3.12.
3) Mean RI: 1:84.
4) Standard Deviation: 0.57.
A variety of pavement characteristics, from smooth surfaces to clearly damaged areas, are reflected in the results. Higher RI values (over 3.0) were seen in locations with frequent turning, halting, and concentrated traffic, such as service roads and parking access routes, but low RI values (around 0.65) were seen on major routes with consistent traffic and acceptable pavement condition. Surface roughness varies moderately throughout the network, with a standard deviation of 0.57. While higher localized readings indicate places that need attention, the mean RI of 1.84 indicates a generally mild state. These findings serve as a foundation for categorizing pavement conditions and identifying areas that might require resurfacing or maintenance.
4.2. Classification thresholds
To translate RI values into actionable pavement condition categories, the data was classified into three levels of surface roughness. This approach is based on industry practices and research in sensor-based pavement evaluation [2], [1], and was tailored to the distribution of the recorded data.
Table 2Roughness index classification categories
RI range | Road condition |
RI < 1.5 | Smooth |
1.5 ≤ RI < 2.5 | Moderate |
RI ≥ 2.5 | Rough |
The campus road network was assessed using this classification. predominant routes and long, straight roads with stable surfaces, good construction quality, and steady traffic flow were the predominant locations of smooth portions (RI < 1.5). Side roads and low-traffic regions frequently had moderate sections (1.5 ≤ RI < 2.5), which had minor flaws and surface deterioration but had little effect on ride quality. The majority of rough sections (RI > 2.5) were found close to loading zones, junctions, building entrances, and older service roads. Because of flaws including cracks, potholes, and patchwork, these sites exhibited increased vibration levels, suggesting that maintenance or rehabilitation is necessary. In addition to supporting focused, data-driven maintenance decisions to enhance performance and safety, this segment-based classification offers a more accurate evaluation of the network.
Fig. 1Interactive map to visualize the distribution in space of RI values for every section on campus. Data points were color-coded by the RI classification
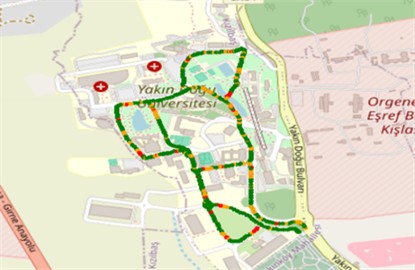
An interactive map was created in order to visualize the distribution in space of RI values for every section on campus. Data points were color-coded by the RI classification:
1) Green: Smooth pavement (RI < 1.5).
2) Yellow: Moderate roughness (1.5 ≤ RI < 2.5).
3) Red: Rough pavement (RI ≥ 2.5).
This map can be used for easy identification of sections that need to be maintained or inspected.
4.3. Identification of rough patches
The checking of RI values within functionally distinct segments of roads found that given areas consistently recorded high levels of roughness (RI ≥ 2.5) These areas were highlighted red on the interactive map and were concentrated predominantly within areas of common stress and wear – the likes of entries, tight corners, and service lanes. That high-RI values are found repeatedly within such areas is indicative of underlying structural decay, patching, or non-uniform overlays.
By contrast, segments categorized as main roads and long internal connectors typically showed lower RI values, indicating smoother and more consistent pavement conditions. These findings align with expected traffic patterns and maintenance practices, where high-usage core roads receive more frequent upkeep compared to peripheral or functional entry areas.
4.4. Correlation with road use and visual observation
Although no systematic post-survey visual inspection was conducted, on site observations agreed on the validity of roughness detection with sensors. High levels of RI were often simultaneous with areas visually exhibiting pavement stress, including:
1) Speed bumps and traffic calming zones.
2) Recurring turning of vehicles at driveway entries.
3) Sites that were treated with surface patching.
4) Areas of edge wear or shoulder roads.
These correlations validate previous research findings [2], [1] to provide justification to deploy smartphone-based sensors to aid the identification of pavement deterioration under real-world conditions.
4.5. Insights and key observations
1) Several zones classified as moderate by RI had no visible surface damage, indicating that minor surface irregularities can be felt by the vehicle but may escape visual detection.
2) Temporary RI spikes were observed in sloped and curved segments, likely due to short-term changes in vehicle acceleration or tilt, not actual pavement issues.
3) The simplicity of the smartphone setup made it possible to monitor detailed pavement behavior at a fine resolution, proving its potential for scalable and affordable road network assessment.
Fig. 2Average RI values for each functional road segment, showing highest roughness at entrances and service roads
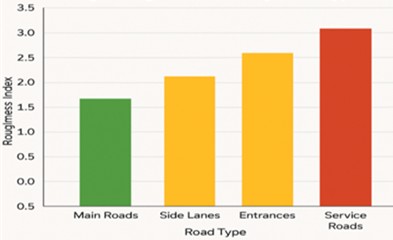
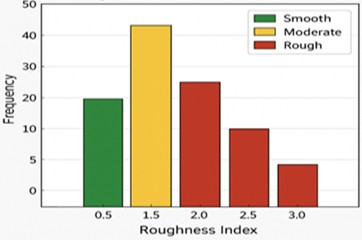
Fig. 3Shows the distribution of road roughness index (RI) values, highlighting that most road segments fall in the “Moderate” category, with fewer classified as “Smooth” or “Rough”
4.6. Measurement of sensitivity and limitations
Although smartphone-based sensing is an easily available pavement monitoring technique, its metrological constraints need to be taken into account. Consumer-grade accelerometers lack the stability of specialized sensors and are susceptible to noise from vehicle dynamics like braking or turning because they are made for electronics rather than precise engineering. This study used a single device to assure uniformity and reduce manufacturer-set calibration biases. Notwithstanding these limitations, the data effectively detected variations in roughness, especially at intersections and service roads. Research should incorporate speed normalization, rigorous calibration, and multi-device validation to increase future reliability.
4.7. Interpretation of findings
The Roughness Index (RI) values were used in the analysis to differentiate road sections. Due to frequent use and little stress, the main roadways and internal sections typically have low (RI < 1.5), suggesting good condition. On the other hand, entry locations, service roads, and intersections showed increased (RI ≥ 2.5), indicating wear from repeated loading, braking, and turning. This functional classification is consistent with research by Yang and Zhou, [7] and Liu et al. [8], which identified access roads and intersections as hotspots for vibration. Furthermore, it was confirmed by Douangphachanh and Oneyama [1] that smartphone sensors are capable of detecting these roughness patterns in regions that are repeatedly subjected to dynamic loading.
5. Conclusions
The overall assessment suggested a mixture of various pavement conditions within the internal road network of the campus. Smooth pavements were clustered on internal main roads and linear corridors, where construction quality and maintenance were found to be superior. On the other hand, entry points, access roads, and utility routes registered higher RI values, characteristic of wear-and-tear due to concentrated pressure, aging, and repeated turnings.
Based on the RI classification and segment-wise analysis, the following areas were identified as needing maintenance attention:
1) Entrance and exit zones where consistent high-RI readings suggest recurring surface wear.
2) Service roads and side access lanes, particularly those near buildings or loading areas.
3) Speed bump and intersection zones, which demonstrated frequent vibration spikes and possible surface irregularities.
Recommendations:
1) Regular monitoring using smartphone sensors should be implemented to track surface condition trends over time.
2) Consistent driving speed and phone mounting is essential for reliable data collection and to minimize artificial noise.
3) Future studies should consider incorporating additional factors such as vehicle load, pavement material type, and weather conditions, which can further influence sensor-based roughness detection.
4) A longitudinal monitoring program using this method could help prioritize repairs, optimize budgets, and extend pavement lifespan.
References
-
V. Douangphachanh and H. Oneyama, “Using smartphones to estimate road pavement condition,” in International Symposium for Next Generation Infrastructure, Jan. 2014, https://doi.org/10.14453/isngi2013.proc.16
-
Y. Du, C. Liu, D. Wu, and S. Li, “Application of vehicle mounted accelerometers to measure pavement roughness,” International Journal of Distributed Sensor Networks, Vol. 12, No. 6, p. 8413146, Jun. 2016, https://doi.org/10.1155/2016/8413146
-
“Relating Ride quality and structural adequacy for pavement rehabilitation/design decisions,” Federal Highway Administration Research and Technology, FHWA-HRT-12-035, Nov. 2012.
-
K. Chatti, A. H. Alavi, H. Hasni, N. Lajnef, and F. Faridazar, “Damage detection in pavement structures using self-powered sensors,” in 8th RILEM International Conference on Mechanisms of Cracking and Debonding in Pavements, pp. 665–671, May 2016, https://doi.org/10.1007/978-94-024-0867-6_93
-
R. Rahbari, J. Niu, J. M. W. Brownjohn, and K. Y. Koo, “Structural identification of Humber Bridge for performance prognosis,” Smart Structures and Systems, Vol. 15, No. 3, pp. 665–682, Mar. 2015, https://doi.org/10.12989/sss.2015.15.3.665
-
A. Sabato, C. Niezrecki, and G. Fortino, “Wireless MEMS-based accelerometer sensor boards for structural vibration monitoring: a review,” IEEE Sensors Journal, Vol. 17, No. 2, pp. 226–235, Jan. 2017, https://doi.org/10.1109/jsen.2016.2630008
-
Q. Yang and S. Zhou, “Identification of asphalt pavement transverse cracking based on vehicle vibration signal analysis,” Road Materials and Pavement Design, Vol. 22, No. 8, pp. 1780–1798, Aug. 2021, https://doi.org/10.1080/14680629.2020.1714699
-
L. Liu et al., “Evenness-aware data collection for edge-assisted mobile crowdsensing in internet of vehicles,” IEEE Internet of Things Journal, Vol. 10, No. 1, pp. 1–16, Jan. 2023, https://doi.org/10.1109/jiot.2021.3095285
-
B. Agyei Kyem, E. Denteh, J. K. Asamoah, D. Tolliver, and A. Aboah, “PaveCap: A multimodal framework for comprehensive pavement condition assessment with dense captioning and PCI estimation,” Journal of Transportation Engineering, Part B: Pavements, Vol. 152, No. 2, Jun. 2026, https://doi.org/10.1061/jpeodx.pveng-1945
-
Z. Ye, Y. Wei, B. Yang, and L. Wang, “Performance testing of micro-electromechanical acceleration sensors for pavement vibration monitoring,” Micromachines, Vol. 14, No. 1, p. 153, Jan. 2023, https://doi.org/10.3390/mi14010153
-
J. Eriksson, L. Girod, B. Hull, R. Newton, S. Madden, and H. Balakrishnan, “The pothole patrol: using a mobile sensor network for road surface monitoring,” in 6th International Conference on Mobile Systems, Applications, and Services, pp. 29–39, Jun. 2008, https://doi.org/10.1145/1378600.1378605
-
N. A. Prabatama, P. Hornych, S. Mariani, and J. M. Laheurte, “Development of a zigbee-based wireless sensor network of MEMS accelerometers for pavement monitoring,” in 10th International Electronic Conference on Sensors and Applications, p. 29, Nov. 2023, https://doi.org/10.3390/ecsa-10-16236
About this article

The authors have not disclosed any funding.
The datasets generated during and/or analyzed during the current study are available from the corresponding author on reasonable request.
The authors declare that they have no conflict of interest.
