Abstract
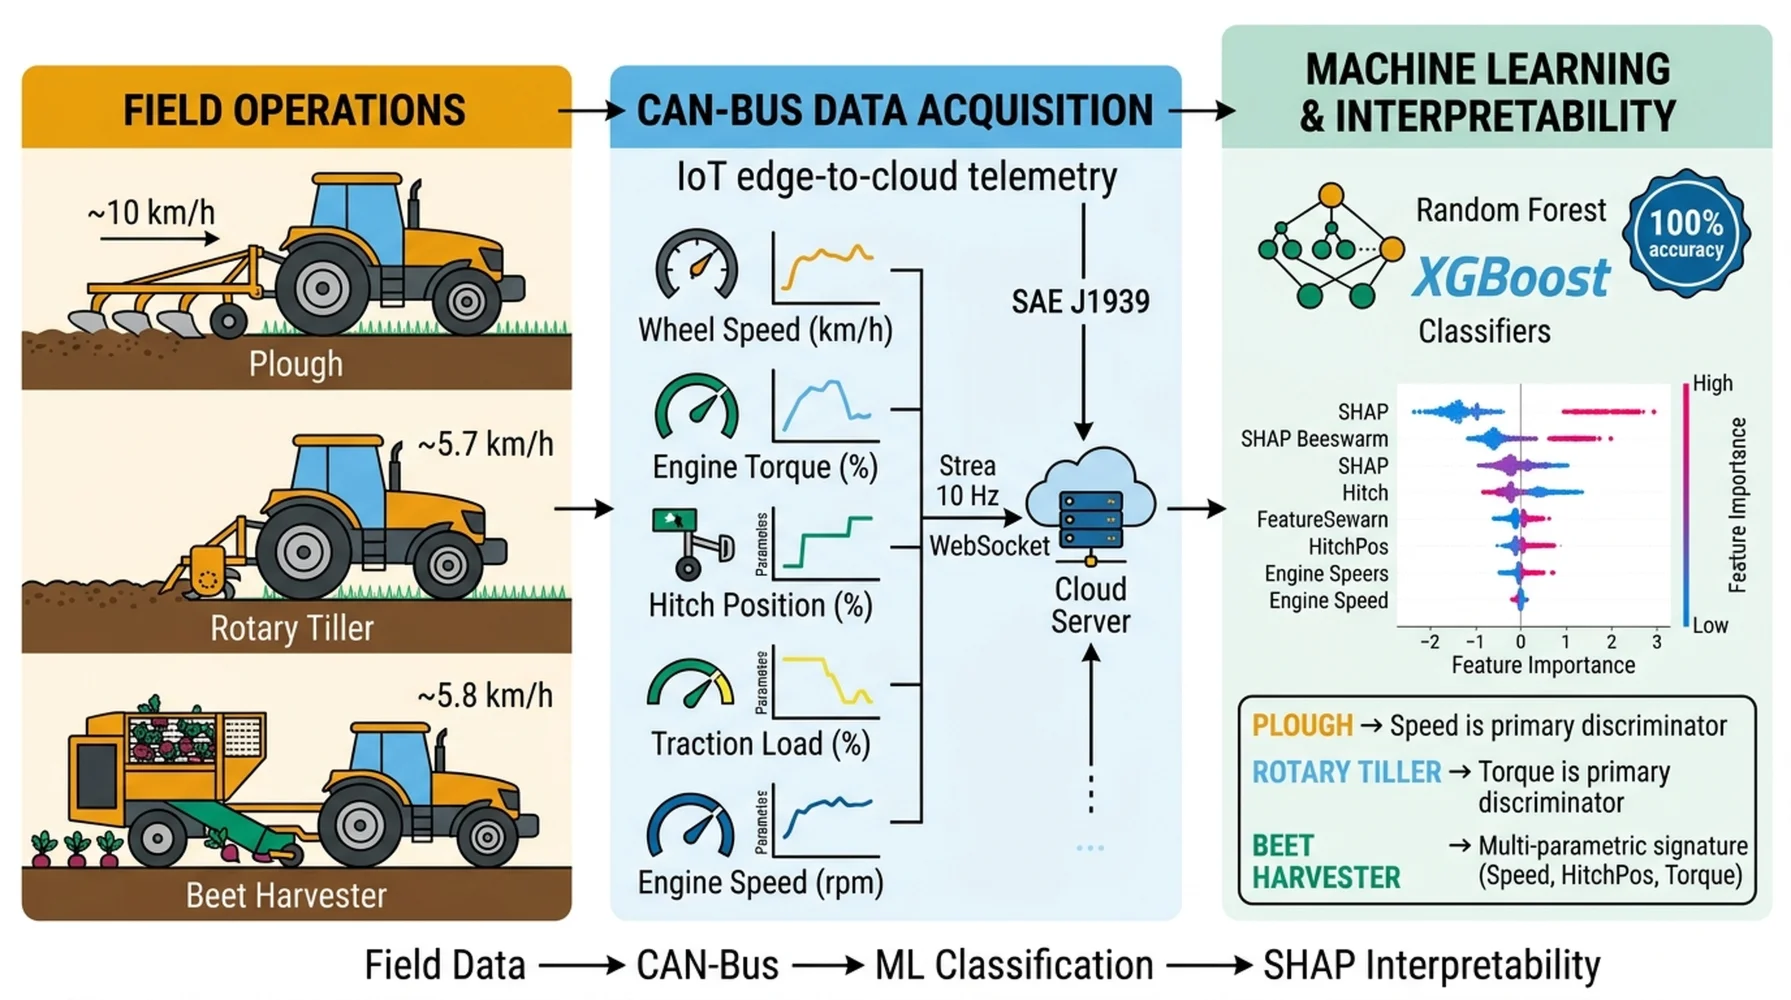
Determining the implement in use during agricultural tractor operations from onboard data alone represents a practical challenge in field equipment utilization monitoring. This study investigates whether standard tractor CAN-Bus signals are sufficient to automatically identify the active implement without additional sensing hardware or manual operator input. Field tests were conducted with a 105 HP agricultural tractor performing three distinct operations ploughing, rotary tilling, and beet harvesting under real field conditions. A dataset was recorded at 10 Hz via an IoT-based edge-to-cloud telemetry system across five SAE J1939 parameters: wheel-based vehicle speed, engine torque percentage, hitch position, traction load, and engine speed. Random Forest and XGBoost classifiers were trained on the collected field data, and both achieved perfect classification performance on stratified hold-out test data. SHAP-based sensitivity analysis was subsequently applied to quantify the contribution of each parameter to the classification decisions and to validate the physical interpretability of the learned models. Class-level analysis further revealed that each operation is governed by a distinct feature hierarchy: speed is the primary discriminator for ploughing, torque dominates rotary tillage identification, and beet harvesting exhibits a distributed multi-parametric signature. These results demonstrate that routine CAN-Bus field data contains sufficient information to reliably predict equipment utilization, offering a scalable and infrastructure-free approach to implement identification in agricultural machinery.
Highlights
- The proposed IoT edge-to-cloud telemetry framework offers a scalable, infrastructure-free solution for automatic equipment utilization monitoring in precision agriculture.
- Five standard SAE J1939 CAN-Bus parameters (vehicle speed, engine torque, hitch position, traction load, engine speed) contain sufficient information to reliably distinguish agricultural field operations without additional sensors.
- Random Forest and XGBoost classifiers both achieved 100% accuracy in identifying the active implement (plough, rotary tiller, beet harvester) using only on-board telemetry data.
- SHAP-based sensitivity analysis revealed that vehicle speed and engine torque are the two most discriminative features globally across all field operations.
- Each implement type exhibits a distinct feature hierarchy: speed dominates plough classification, torque dominates rotary tiller identification, and beet harvesting shows a distributed multi-parametric signature.
1. Introduction
Agricultural tractors are multi-purpose machines that perform a wide range of field operations through interchangeable implements. Ploughing, rotary tilling, and crop harvesting each impose fundamentally different mechanical demands on the powertrain, resulting in distinct operational signatures in terms of travel speed, engine loading, hitch behaviour, and traction characteristics. The ability to automatically identify which implement is in use directly from onboard data, without additional sensors or manual input has practical implications for fleet management, operational monitoring, and data-driven decision-making in precision agriculture contexts [1]. Current tractor electronic architectures broadcast a continuous stream of operational parameters over the CAN-Bus network following the SAE J1939 protocol. These signals are primarily intended for engine and transmission management, yet they inherently encode information about the mechanical state of the tractor–implement system. Whether this embedded information is sufficient to reliably infer implement identity is an open question that the present study directly addresses. Despite the growing application of machine learning to agricultural machinery encompassing fault detection, yield prediction, and autonomous navigation the specific problem of implement identification from standard CAN-Bus telemetry has not been systematically investigated. Existing studies on tractor data acquisition have focused on system architecture and communication protocols [2-6] rather than on extracting implement-level intelligence from the recorded signals. This gap motivates the present work. This study investigates whether five commonly available SAE J1939 parameters wheel-based vehicle speed, engine torque percentage, hitch position, traction load, and engine speed are sufficient to classify field operations and thereby identify the active implement. An IoT-based edge-to-cloud telemetry system was developed to acquire field data from a 105 HP tractor performing three distinct operations under real field conditions. Supervised machine learning classifiers were trained on the collected dataset, and SHAP-based sensitivity analysis was applied to identify which parameters carry the greatest discriminative information and to ensure that the resulting models are physically interpretable.
Three research questions structure the investigation:
1) Do different field operations produce distinct, quantifiable signatures in standard tractor CAN-Bus parameters?
2) Can machine learning classifiers reliably distinguish between these operations using only five commonly available CAN-Bus parameters?
3) Which CAN-Bus parameters contribute most to implement identification, and do their contributions align with the physical characteristics of each operation?
The remainder of the paper is organised as follows. Section 2 reviews relevant prior work on CAN-Bus data acquisition and machine learning applications in agricultural machinery. Section 3 describes the experimental setup, data acquisition system, and machine learning methodology. Section 4 presents the classification results and SHAP-based interpretability analysis. Section 5 draws conclusions and identifies directions for future work.
2. Related work
2.1. Power shuttle transmission control
The power shuttle transmission is a key feature in modern agricultural tractors, enabling rapid forward-reverse direction changes through hydraulically actuated wet clutch packs [7, 8]. Clutch engagement follows a multi-stage profile consisting of pre-fill, initial contact, controlled engagement, and full lock-up phases [9, 10, 11]. Park et al. [12] demonstrated that low oil temperature induces significant delays in clutch control line response. Ahn et al. [13] showed that irregularities in the clutch activation ramp directly affect launch quality. Raikwar and Tewari [14] developed a transmission control algorithm for a power shuttle tractor. Kim et al. [15] analysed the shifting performance of power shuttle transmissions. Despite these advances, the literature lacks studies exploring the connection between the field operation and optimal calibration strategy.
2.2. IoT-enabled CAN-bus data collection in agricultural vehicles
Various approaches to vehicle data collection have been reported. Ochando et al. [2] developed an on-board computer for condition monitoring in tactical vehicles. Banerjee et al. [3] implemented a data acquisition system for motorcycle telemetry using an FPGA-based CAN controller. Kegenbekov and Saparova [4] employed the MQTT protocol for transmitting vehicle telemetry data. Kelle and Yüce [16] demonstrated the integration of MQTT-based IoT communication with machine learning and SHAP analysis. Within the broader context of smart agriculture, IoT-based telemetry systems enable continuous data streaming from agricultural machinery to cloud-based platforms [1, 5, 6]. The present study builds on these IoT principles by implementing an online telemetry system based on the SAE J1939 protocol, following an edge-to-cloud IoT architecture.
2.3. Machine learning for agricultural machinery
Machine learning methods have found increasing application in agricultural machinery. Hojaji et al. [17] applied AI-based prediction to sim racing telemetry data. More broadly, ML-based classification has been applied to engineering systems for fault detection [18], flow prediction [19], and integrated fault diagnosis with remote monitoring [20]. Within the domain of tractor transmission systems, SHAP-based explainable AI has been employed to quantify the influence of operating parameters. However, no study to date has addressed the problem of classifying field operations using standard CAN-Bus signals from a tractor.
3. Materials and methods
This section describes the experimental setup, telemetry-based data acquisition infrastructure, machine learning methodology employed to identify agricultural implement usage from tractor operational data. A real-time CAN-Bus monitoring system was developed to collect vehicle and implement-related parameters during different agricultural operations under actual field conditions. The acquired dataset was processed and analyzed using supervised machine learning algorithms to classify field operations based on tractor behavior.
3.1. Test tractor and data acquisition system
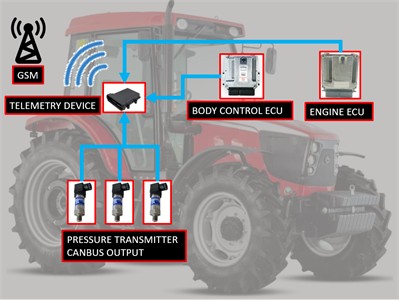
Field tests were conducted using a 105 HP agricultural tractor with a Stage IIIA turbocharged diesel engine and a 16-forward/16-reverse powershuttle transmission. The tractor’s CAN-Bus network (SAE J1939 protocol) was monitored using a custom IoT-enabled telemetry data acquisition system implementing an edge-to-cloud architecture [5, 6]. Data is transmitted in real time via WebSocket protocol to a remote cloud server, where CAN frames are decoded using DBC files and stored as time-series data. The vehicle instrumentation shown in Fig. 1.
Fig. 1Vehicle instrumentation and data acquisition system
3.2. Field experiments and dataset
Three field operations were performed: Plough (ploughing at ~10 km/h, mean torque 73.2 %), Rotary Tiller (rotary tilling at ~5.7 km/h, mean torque 19.5 %), and Beet Harvester (crop harvesting at ~5.8 km/h, mean torque 52.6 %). The dataset comprises 3933 samples at 10 Hz, equally distributed across operations. The parameters list shown Table 1.
3.3. Machine learning methodology
The dataset was split into training (80%) and test (20%) sets using stratified sampling. A Random Forest classifier was trained with 300 trees (max_depth=15, min_samples_split=5). An XGBoost classifier was also trained with 300 estimators (max_depth=10, lr=0.1) for comparison. Performance was evaluated using accuracy, precision, recall, and F1-score.
Table 1Recorded parameters
Parameter | Unit | Description |
Wheel Based vehicle speed | km/h | Ground speed |
Actual engine_perc torque | % | Engine torque percentage |
ER hactual position meas | % | Hitch position |
ERH load percent meas | % | Traction load |
Engine speed | rpm | Engine speed |
Feature | – | Operation label (target) |
3.4. SHAP-based model interpretability
SHAP analysis was applied to the Random Forest model using the TreeExplainer method [16]. SHAP values compute the marginal contribution of each feature to the model's prediction. For multi-class classification, SHAP values were computed separately for each class, producing per-class feature importance distributions.
4. Results and discussion
This section presents the experimental results obtained from the field operation dataset and discusses the effectiveness of the proposed machine learning approach for implement classification. First, exploratory data analysis was performed to investigate the statistical characteristics and distribution patterns of the recorded parameters across different agricultural operations.
4.1. Exploratory data analysis
Descriptive statistics of the recorded operational parameters revealed clear differences among the investigated field activities, indicating that the selected CAN-Bus signals contain distinctive characteristics for each agricultural operation. Mean values and standard deviations of the parameters are summarized in Table 2.
Table 2Parameters statistics during operating each equipment
Parameter | Plough | Rotary tiller | Beet harvester |
Actual engine_perc torque (%) | 73.22±20.91 | 19.54±3.45 | 52.62±12.11 |
Engine speed (rpm) | 1807.63±167.84 | 1691.43±48.30 | 1758.37±110.25 |
Wheel based vehicle speed (km/h) | 10.14±1.04 | 5.66±0.37 | 5.78±0.51 |
ERH actual position meas (%) | 45.68±13.64 | 33.94±8.01 | 51.63±7.42 |
ERH load Percent meas (%) | –12.36±13.32 | 25.64±15.97 | 8.83±4.70 |
The box-plot visualisations shown in Fig. 2. That engine torque and vehicle speed provide the strongest visual separation between operations.
Vehicle speed effectively separates Plough (10.14 km/h) from the two slower operations (5.66 and 5.78 km/h). Traction load shows a distinctive pattern: positive for Rotary Tiller (25.64 %), negative for Plough (–12.36 %).
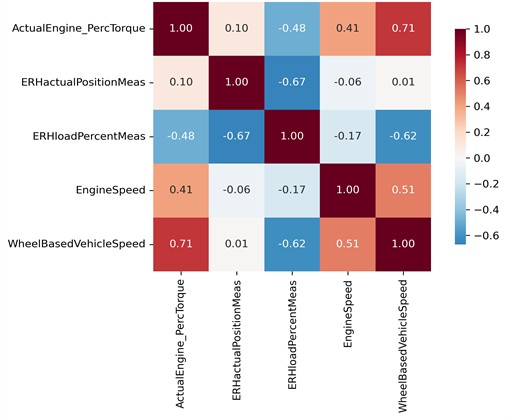
Parameters correlation shown in Fig. 3 illustrates the interrelationships among the monitored parameters during field operations performed with different implements, highlighting how the measured variables correlate with each other across the dataset.
4.2. Classification performance
Random Forest and XGBoost achieved perfect accuracy on the held-out test. The dataset length is 787 samples and scores list in Table 3.
The perfect classification performance merits a discussion of potential overfitting. Several factors confirm that this result reflects genuine class separability: (1) cross-model agreement between bagging and boosting approaches, (2) feature space separability with non-overlapping distribution ranges, (3) stratified hold-out validation on 787 unseen samples, and (4) regularised model architectures.
Table 3Random forest and XGBoost scores
Model | Accuracy | Precision | Recall | F1-Score |
Random Forest | 1.0000 | 1.0000 | 1.0000 | 1.0000 |
XGBoost | 1.0000 | 1.0000 | 1.0000 | 1.0000 |
Fig. 2Parameter distributions across field operations
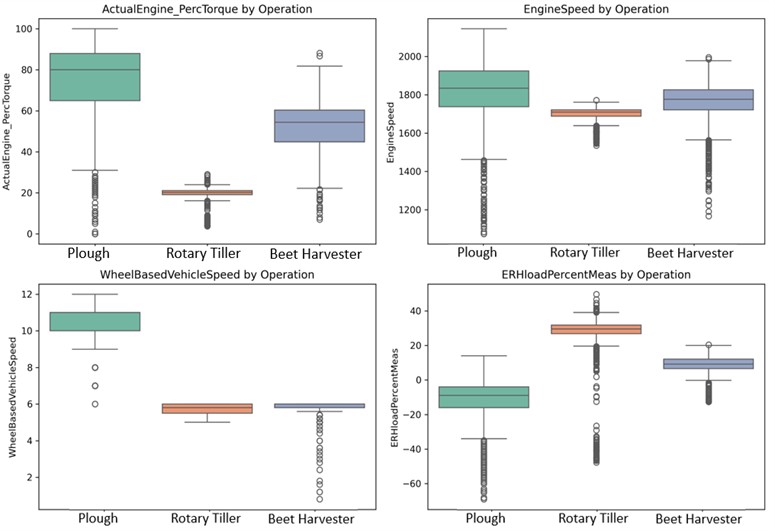
Fig. 3Feature correlation matrix
The confusion matrix of Random Forest and XGBoost shown in Fig. 4 and Fig. 5. The confusion matrix values together with the corresponding performance metrics are summarized in Table 4.
Fig. 4Confusion matrix – random forest

Fig. 5Confusion matrix – XGBoost
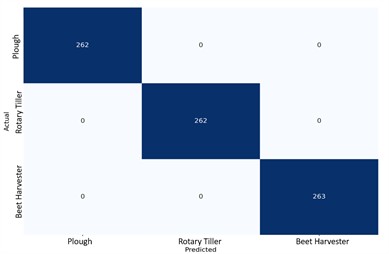
Table 4Field activities scores according to equipment
Operation | Precision | Recall | F1-Score | Support |
Plough | 1.00 | 1.00 | 1.00 | 263 |
Rotary tiller | 1.00 | 1.00 | 1.00 | 262 |
Beet harvester | 1.00 | 1.00 | 1.00 | 262 |
5. Feature importance analysis
SHAP analysis was applied to the Random Forest model. Figs. 6-8 present per-class SHAP beeswarm plots.
Fig. 6SHAP beeswarm – Plough
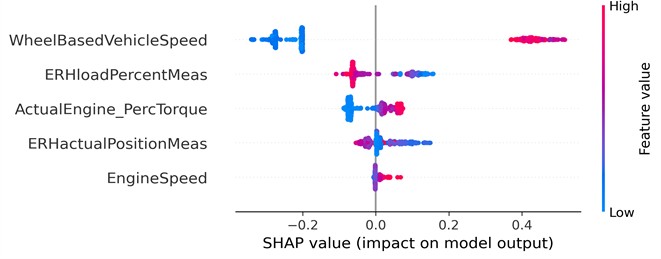
Fig. 7SHAP beeswarm – rotary tiller
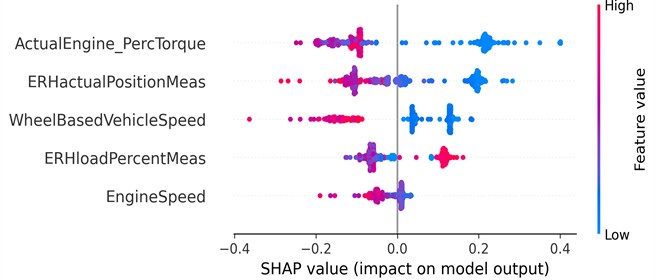
Fig. 8SHAP beeswarm – beet harvester
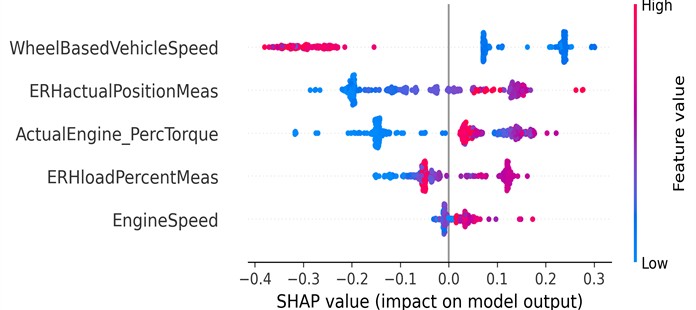
Table 5 presents the SHAP-based feature importance analysis, where the mean absolute SHAP values are used to quantify the contribution of each parameter to the model output. The results indicate that WheelBasedVehicleSpeed is the most influential feature, followed by ActualEngine_PercTorque and ERHactualPositionMeas.
Table 5SHAP feature value lists
Feature | Mean |SHAP| |
WheelBasedVehicleSpeed | 0.2044 |
ActualEngine_PercTorque | 0.1068 |
ERHactualPositionMeas | 0.0931 |
ERHloadPercentMeas | 0.0765 |
EngineSpeed | 0.0199 |
Table 6 summarizes the discriminative levels of the evaluated parameters across different agricultural operations. The results show that each operation is characterized by a distinct set of dominant features. For ploughing, Speed and TractionLoad are the most discriminative parameters, whereas Rotary Tillage is primarily characterized by Torque and Hitch Position. In Beet Harvester operations, Speed again emerges as the primary discriminative feature. These findings demonstrate that operational modes exhibit clearly distinguishable parameter hierarchies, enabling effective classification based on feature-specific behavior.
Table 6The discriminative levels of the evaluated parameters
Operation | 1st | 2nd | 3rd |
Plough | Speed (0.3065) | TractionLoad (0.0759) | Torque (0.0489) |
Rotary Tiller | Torque (0.1602) | HitchPos (0.1119) | Speed (0.1036) |
Beet Harvester | Speed (0.2029) | HitchPos (0.1345) | Torque (0.1113) |
Fig. 9Global feature importance (mean |SHAP|)
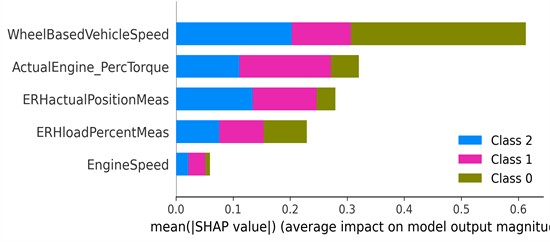
This Fig. 9 illustrates the global feature importance based on mean absolute SHAP values across all classes. WheelBasedVehicleSpeed exhibits the highest overall impact on model predictions, followed by ActualEngine_PercTorque and ERHactualPositionMeas. The stacked contributions show class-specific influences, indicating that each feature affects different operational classes with varying magnitudes and distributions.
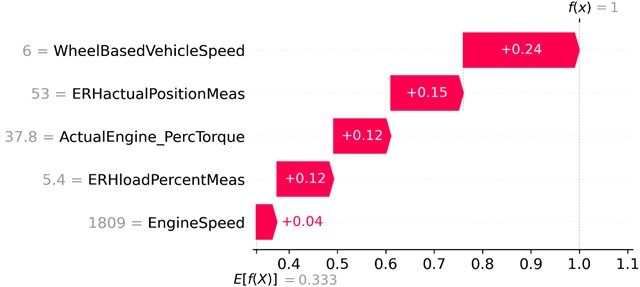
Figs. 10-12 present individual-level SHAP waterfall plots for representative samples drawn from each operational class – Plough, Rotary Tiller, and Beet Harvester, respectively. Unlike global importance metrics, waterfall plots decompose the model output for a single prediction by attributing the deviation from the expected base value ( 0.333) to each input feature, thereby offering a locally faithful explanation of classifier behaviour.
Fig. 10SHAP waterfall – plough sample
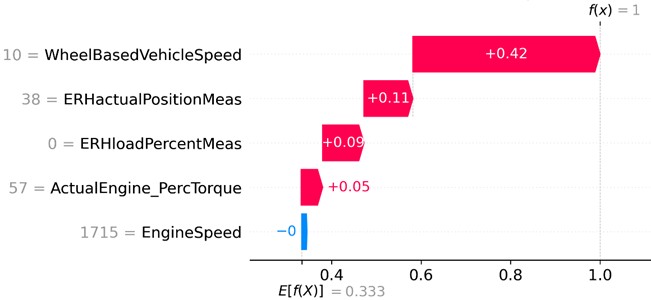
Fig. 11SHAP waterfall – rotary tiller sample
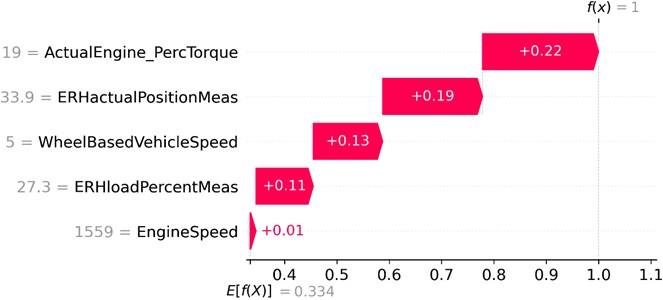
Fig. 12SHAP waterfall – Beet Harvester sample
For the Plough sample Fig. 10, WheelBasedVehicleSpeed (value: 10 km/h) contributes the largest positive shift (+0.42), alone accounting for approximately 63 % of the total deviation from the base value to 1. ERHactualPositionMeas (+0.11) and ERHloadPercentMeas (+0.09) provide secondary positive contributions, while EngineSpeed exerts a negligible negative effect (≈ −0.00). This instance-level result is consistent with the class-level finding reported in Table 6, where Speed ranks as the primary discriminative parameter for ploughing operations.
The Rotary Tiller sample Fig. 11 exhibits a markedly different contribution hierarchy. ActualEngine_PercTorque (value: 19 %) emerges as the dominant feature (+0.22), followed by ERHactualPositionMeas (+0.19), WheelBasedVehicleSpeed (+0.13), and ERHloadPercentMeas (+0.11). The elevated torque-based contribution reflects the mechanical demands of rotary tillage, wherein the power take-off driven implement induces characteristically high relative torque loads at reduced travel speeds. EngineSpeed again contributes minimally (+0.01), corroborating its globally low mean |SHAP| value of 0.0199 reported in Table 5.
For the Beet Harvester sample Fig. 12, the feature contributions are more evenly distributed compared to the Plough case. WheelBasedVehicleSpeed (+0.24) remains the leading contributor, with ERHactualPositionMeas (+0.15), ActualEngine_PercTorque (+0.12), and ERHloadPercent Meas (+0.12) providing comparable secondary contributions. The relative balance among features suggests that beet harvesting is characterised by a multi-parametric signature, where no single signal overwhelmingly dominates the decision boundary, a pattern consistent with the distributed importance structure shown in Table 6.
Collectively, the waterfall analyses confirm that the model’s high classification accuracy is not attributable to a single universal feature, but rather emerges from class-specific feature hierarchies. The dominance of WheelBasedVehicleSpeed for draft-type operations, the prominence of ActualEngine_PercTorque for PTO-driven implements, and the distributed signature of the harvester operation together demonstrate that the Random Forest model captures operationally meaningful and physically interpretable decision patterns, thereby supporting the interpretability and practical transferability of the proposed approach.
6. Conclusions
This study demonstrated that field operations can be reliably classified from standard tractor CAN-Bus signals using machine learning. Three key findings emerge: (1) different operations produce distinct signatures in CAN-Bus parameters; (2) both Random Forest and XGBoost achieved 100 % accuracy using only five parameters; (3) SHAP analysis identified vehicle speed and engine torque as the most discriminative parameters. The principal limitation of the present work is its scope: data were collected from a single tractor platform under controlled field conditions, and the classification framework was evaluated on only three implement types. Generalisation to broader operational envelopes including variable soil conditions, different tractor models, and a wider range of implements remains to be demonstrated. The exclusion of hydraulic pressure and flow parameters from the feature set also represents a potential gap, as these signals may provide additional discriminative information for implement configurations that produce similar powertrain signatures. Future work should therefore prioritise multi-platform validation, dataset expansion to cover a broader implement portfolio, and investigation of hydraulic system parameters as complementary features. Future work should expand to multiple tractor models, additional implementation.
References
-
L. Jiang, B. Xu, N. Husnain, and Q. Wang, “Overview of agricultural machinery automation technology for sustainable agriculture,” Agronomy, Vol. 15, No. 6, p. 1471, Jun. 2025, https://doi.org/10.3390/agronomy15061471
-
F. J. Ochando, A. Cantero, J. I. Guerrero, and C. León, “Data acquisition for condition monitoring in tactical vehicles: on-board computer development,” Sensors, Vol. 23, No. 12, p. 5645, Jun. 2023, https://doi.org/10.3390/s23125645
-
A. Banerjee, A. V. Jindal, A. Shankar, V. Sachdeva, and M. Kanthi, “Motorsport data acquisition system and live telemetry using FPGA based CAN controller,” Journal of Physics: Conference Series, Vol. 2161, No. 1, p. 012041, Jan. 2022, https://doi.org/10.1088/1742-6596/2161/1/012041
-
Z. Kegenbekov and A. Saparova, “Using the MQTT protocol to transmit vehicle telemetry data,” Transportation Research Procedia, Vol. 61, pp. 410–417, 2022, https://doi.org/10.1016/j.trpro.2022.01.067
-
F. J. Ferrández-Pastor, J. M. García-Chamizo, M. Nieto-Hidalgo, and J. Mora-Martínez, “Precision agriculture design method using a distributed computing architecture on internet of things context,” Sensors, Vol. 18, No. 6, p. 1731, May 2018, https://doi.org/10.3390/s18061731
-
Y. Kalyani and R. Collier, “A systematic survey on the role of cloud, fog, and edge computing combination in smart agriculture,” Sensors, Vol. 21, No. 17, p. 5922, Sep. 2021, https://doi.org/10.3390/s21175922
-
H. G. Gunes, T. Bagci, M. Balaban, and S. C. Baslamisli, “A new hydraulically activated forward-reverse system for tractors: Part 1 – construction and prototype tests,” (in Turkish), in Forward-Reverse System Symposium, 2012.
-
S. C. Baslamisli, H. G. Gunes, S. Sari, and M. Balaban, “Hydraulically activated forward-reverse clutch system for tractors: Part 2 – system dynamics analysis,” in Forward-Reverse System Symposium, 2012.
-
B. Xu, Q. Su, J. Zhang, and Z. Lu, “Analysis and compensation for the cascade dead-zones in the proportional control valve,” ISA Transactions, Vol. 66, pp. 393–403, Jan. 2017, https://doi.org/10.1016/j.isatra.2016.10.012
-
G. Liu, W. Xia, D. Qi, and R. Hu, “Analysis of dither in PWM control on electro-hydraulic proportional valve,” TELKOMNIKA Indonesian Journal of Electrical Engineering, Vol. 11, No. 11, pp. 7280–7286, Dec. 2013, https://doi.org/10.11591/telkomnika.v11i12.3698
-
N. D. Manring and R. C. Fales, Hydraulic Control Systems. Hoboken, NJ, USA: Wiley, 2019, https://doi.org/10.1002/9781119418528
-
Y.-N. Park, D.-C. Kim, and S.-J. Park, “Delayed operation characteristics of power shuttle according to hydraulic oil temperature in the hydraulic circuit of agricultural tractor,” (in Korean), Journal of Biosystems Engineering, Vol. 40, No. 2, pp. 95–101, Jun. 2015, https://doi.org/10.5307/jbe.2015.40.2.095
-
D.-V. Ahn et al., “Effect of clutch control to improve launch quality for a power shuttle tractor during launching,” Computers and Electronics in Agriculture, Vol. 224, p. 109235, Sep. 2024, https://doi.org/10.1016/j.compag.2024.109235
-
S. Raikwar and V. K. Tewari, “Development of transmission control algorithm for power shuttle transmission system for an agricultural tractor,” Journal of Biosystems Engineering, Vol. 48, No. 2, pp. 136–151, Jun. 2023, https://doi.org/10.1007/s42853-023-00180-2
-
D. C. Kim, K. U. Kim, Y. J. Park, and J. Y. Huh, “Analysis of shifting performance of power shuttle transmission,” Journal of Terramechanics, Vol. 44, No. 1, pp. 111–122, Jan. 2007, https://doi.org/10.1016/j.jterra.2006.04.001
-
A. C. Kelle and H. Yüce, “MQTT traffic dos attacks classification using machine learning and interpretation of the model with shap,” (in Turkish), Journal of Materials and Mechatronics: A, Vol. 3, No. 1, pp. 50–62, Jun. 2022, https://doi.org/10.55546/jmm.995091
-
F. Hojaji, A. J. Toth, J. M. Joyce, and M. J. Campbell, “AI-enabled prediction of sim racing performance using telemetry data,” Computers in Human Behavior Reports, Vol. 14, p. 100414, May 2024, https://doi.org/10.1016/j.chbr.2024.100414
-
E. Şahin and H. Yüce, “Fault detection in pipelines using graph convolutional networks method (GCN),” (in Turkish), Journal of Gazi University Faculty of Engineering and Architecture, Jun. 2024, https://doi.org/10.17341/gazimmfd.1306916
-
U. Kesen, T. Şişman, and I. Çavuşoğlu, “Prediction of round jet flow with artificial neural networks,” Acta Physica Polonica A, Vol. 135, No. 4, pp. 609–612, Apr. 2019, https://doi.org/10.12693/aphyspola.135.609
-
H. Yüce, “Establishment of diagnosing faults and monitoring system with neural networks in air conditioning systems,” The Journal of Cognitive Systems, Vol. 2, No. 1, pp. 21–27, Jun. 2017.
About this article

The authors have not disclosed any funding.
The authors thank TÜMOSAN Motor ve Traktör A.Ş. for providing the test tractor and field testing facilities.
The datasets generated during and/or analyzed during the current study are available from the corresponding author on reasonable request.
Ali Can Tellioğlu: conceptualization, methodology, software, investigation, data curation, formal analysis, writing-original draft, visualization. Hüseyin Yüce: conceptualization, methodology, validation, formal analysis, writing-review and editing, supervision, project administration. Uğur Kesen: conceptualization, validation, writing-review and editing, supervision. Aykut Dana: resources, data curation, validation, writing-review and editing.
The authors declare that they have no conflict of interest.
