Abstract
This paper proposes a diagnostic method and a mathematical framework for evaluating the operational processes and damping properties of a vehicle suspension based on the experimental free-fall method. To ensure the reproducibility of the tests, a special mobile device (trolley) was designed and manufactured. The structural analysis of the trolley under static loading was performed using the finite element method in SolidWorks Simulation. Experimental studies were carried out on free-fall tests from a height of 12 cm for two vehicle configurations: the base ZAZ-1102 ‘Tavria’ with an internal combustion engine (ICE) and its modified version with an electric drive (EV). Based on the experimental diagrams, logarithmic damping decrements and viscous resistance coefficients were determined, and differential equations for damped oscillations were derived. The method made it possible to quickly identify a qualitative deficiency in the rear-right shock absorber, evidenced by a markedly slower amplitude decay (5 vs. 3 oscillations) relative to the rear-left side.
Highlights
- A rigid, FEA-verified trolley (0.211 mm deflection under 500 kg) provides a reproducible 12 cm free-fall input for field testing of vehicle suspension.
- Damped-oscillation equations were identified from smartphone MEMS accelerometer data; the model reproduced the measured peak acceleration within 2% (–8.94 vs. –8.8 m/s²).
- For a base ZAZ-1102 front wheel, the logarithmic decrement (1.868) and viscous resistance coefficient (2984 N·s/m) were derived from five oscillation cycles.
- In the ICE car, front–rear damping times differed by 0.6–0.8 s; in the EV conversion, with a more balanced axle load, they converged (1.21–1.36 s).
- The method qualitatively flagged a rear-right shock-absorber deficiency in the EV (5 vs. 3 oscillations before decay below sensor resolution) without a stationary test rig.
1. Introduction
A vehicle’s suspension system is a critically important component responsible for ensuring stability, manoeuvrability and the required level of ride comfort. During operation, the suspension’s spring and damping elements are subjected to constant dynamic loads, leading to a gradual loss of their performance characteristics [1-5]. Wear and tear on shock absorbers reduces tyre grip, increases braking distances and adversely affects the performance of active safety systems (ABS, ESP) [6-10]. The object of the study is the vertical suspension system of the vehicle’s quarter-car model (spring and shock-absorber assembly at each wheel station); the subject of the study is the dynamic damping behaviour of this system, characterised through free-fall-induced transient oscillations.
Traditional methods for inspecting the condition of a suspension system are divided into static (measurement of stiffness and deflection), visual and dynamic (on specialised vibration test benches using the EUSAMA or BOGE/MAXA methods) [11], [12]. Despite their high accuracy, diagnostic vibration test benches require significant capital expenditure and are mainly available at large service centres. This highlights the need to develop portable, cost-effective and rapid methods of dynamic inspection [13-17].
Among the alternative methods, free vibration techniques (excitation or release) attract particular attention, as they enable the natural frequencies and damping rates of vibrations to be assessed under conditions close to those of actual operation [21]. Prior studies have applied on-board free-vibration testing to estimate shock-absorber condition from body acceleration decay [19] and have proposed logarithmic-decrement-based diagnostic criteria for automotive dampers [20], while fault-diagnosis frameworks based on pitch/roll response have also been explored [21]; however, these studies either rely on stationary excitation rigs unsuitable for field use [19], [20] or do not address the reproducible generation of a controlled free-fall input via dedicated launch hardware [21]. Thanks to the development of microelectromechanical systems (MEMS), modern mobile devices equipped with high-precision accelerometers now provide an accessible hardware platform for recording such vibration signals, closing the gap between laboratory-grade instrumentation and portable diagnostics. However, insufficient attention has been paid to the integrated combination of a purpose-built, reproducible launch device, closed-form differential-equation modelling of the decay, and assessment of suspension parameter changes under powertrain modification (ICE→EV) – the gap addressed in this work.
The novelty of the proposed approach lies in the combination of (i) a purpose-built, FEA-validated rigid launch trolley enabling a reproducible, field-deployable free-fall input (in contrast to the stationary or excitation-based rigs used in [19], [20]), (ii) closed-form identification of the damped-oscillation differential equation (Eqs. (1-8)) directly from smartphone-grade MEMS accelerometer data rather than laboratory-grade instrumentation, and (iii) demonstration that the method resolves axle-to-axle and side-to-side asymmetries in damping capacity introduced by powertrain conversion (ICE→EV), a diagnostic capability not addressed in prior free-vibration studies [19-21].
To achieve this aim, the following objectives were set: design and validate, by FEA, a rigid free-fall test trolley; record and process free-fall acceleration time-histories for both ICE and EV suspension variants; derive and experimentally verify analytical differential equations of damped oscillations from the logarithmic decrement; assess the diagnostic sensitivity of the method to shock-absorber defects [1-21].
2. Trolley design and structural verification
2.1. Design requirements and trolley design
To carry out free-fall tests in practice, it became necessary to develop a launch device that would ensure the immediate removal of resistance beneath the test wheel without causing lateral jolts or body misalignment. To this end, a special mobile trolley was designed and manufactured.
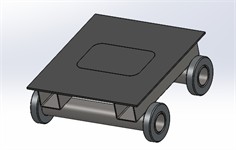
The main design requirements for the trolley were to ensure high rigidity under the weight of a quarter of a car, minimal rolling resistance of the wheels when the trolley is being pulled out, and geometric compatibility with the contact patch width of standard tyres. Based on geometric calculations, the optimum dimensions of the bogie were determined: height – 120 mm, track width – 375 mm, platform width – 300 mm, length – 275 mm. Structurally, the trolley comprises a rigid welded steel platform (deck) carrying the wheel, mounted on four low-friction rollers set in rolling bearings at the platform corners (Fig. 1(a), 1(c)); the platform height (120 mm) defines the drop distance, while the roller arrangement allows the loaded platform to be withdrawn horizontally from beneath the wheel with a single rapid pull. Because the rollers bear the full quarter-car load up to the point of release and offer minimal rolling resistance, withdrawal requires only a brief horizontal jerk rather than a lifting or tilting action, so the wheel is released essentially instantaneously and drops vertically without inducing lateral or angular (body-misalignment) disturbances – a requirement verified qualitatively during trial pulls prior to the recorded tests.
2.2. Strength analysis (FEA) and fabrication of a prototype
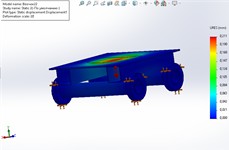
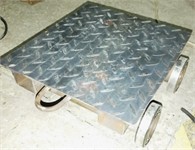
This load was adopted as a conservative design load rather than the actual in-service wheel load: the maximum measured static wheel load among the investigated vehicles is ≈ 222 kg (front axle of the standard ZAZ-1102, Table 1 mass value used in Section 5.2), so the 500 kg case corresponds to a safety margin of approximately 2.25 over the heaviest anticipated wheel load, ensuring adequate structural reserve for dynamic (impact) loading during free-fall release, occasional platform misalignment, and use with heavier test vehicles in future studies. St3 steel ( 235 MPa) was selected as the material. Analysis of the results (Fig. 1(b)) showed a maximum equivalent (von Mises) stress of 20.2 MPa. Given the yield strength of St3 steel ( 235 MPa) and an allowable stress of 117.5 MPa, the resulting factor of safety is ≈ 11.6, confirming that the design satisfies the strength requirement; the total elastic deformation is only 0.211 mm. As this deformation is less than 0.2 percent of the drop height (12 cm), it was concluded that the trolley is absolutely rigid. On this basis, an experimental specimen was fabricated using metal rollers mounted on rolling bearings (Fig. 1(c)).
Fig. 1a) 3D model, b) FEA analysis of the stress-strain state of the trolley under a load of 500 kg, c) experimental specimen
a)
b)
c)
2.3. Vehicles under investigation
Two variants of the ZAZ-1102 were selected to assess the damping characteristics:
1. Standard ZAZ-1102 ‘Tavria’ (internal combustion engine): MeMZ-245 engine (1.1 l), 37.5 kW), kerb weight 745 kg, weight distribution: front axle – 444 kg (59.6 %), rear axle – 301 kg (40.4 %).
2. Modified ZAZ-11024 ‘Tavria EV’ (electric car): traction motor in the engine compartment, battery pack in the boot, kerb weight 709 kg with balanced weight distribution between the axles.
3. Experimental methodology and mathematical modelling
3.1. Experimental setup
The experimental setup comprised the test vehicle (ICE or EV variant), the free-fall trolley described in Section 2 as the wheel-release device, a Bosch BMI220 MEMS accelerometer, and a smartphone running the Accelerometer Meter app for data acquisition; the trolley itself constitutes only the release mechanism within this setup, not the setup as a whole.
The tests were carried out with the tyres inflated to the same pressure (2.0 atm). The test vehicle was raised using a hydraulic jack, and a 12 cm high trolley was placed under the wheel, after which the wheel rested entirely on the platform. A smartphone running Android was secured to the bodywork above the wheel axle.
A Bosch BMI220 MEMS accelerometer (range ±16 g, resolution 0.023 m/s2) built into a smartphone running Android was used with the Accelerometer Meter app (Graph mode, 100 Hz). Factory calibration was relied upon; no additional calibration was performed. The smartphone was rigidly mounted to the body above the wheel axle with its Z-axis aligned vertically; only the vertical channel was analysed. Peak amplitudes (…, …, Eq. (4)) were identified directly from the recorded raw trace without additional filtering. During a rapid horizontal jerk of the trolley, the wheel fell freely from a height of 12 cm, triggering transient damped vertical oscillations, which were recorded for analysis. Tests were performed for all eight wheel positions across the two vehicle variants (RF, LF, RR, LR for both the ICE and EV configurations), with each test repeated five times at every wheel position under identical conditions (tyre pressure 2.0 atm, drop height 12 cm); the value reported in Table 1 for each position corresponds to the representative (median) run among the five repetitions, selected after discarding trials showing visible sensor clipping or trolley misalignment. Five repetitions per wheel position were adopted as a pragmatic balance between statistical reliability and the destructive/repetitive-loading nature of free-fall testing on the physical suspension components; the resulting standard deviations (Table 1) remained small relative to the front–rear differences reported in Section 5.1, supporting the statistical distinguishability of the axle-level trends despite the limited sample size. Recording was terminated once the oscillation amplitude fell below the accelerometer’s resolution threshold (0.023 m/s2), consistent with the criterion used to define . The damping time (Table 1) was taken as the interval between the initial impact peak and the point where the oscillation amplitude fell below the accelerometer's resolution threshold (0.023 m/s2).
4. Mathematical framework
The equation describes free vibrations of the body:
where – suspended mass; – viscous resistance coefficient; – damping coefficient; – natural frequency.
The parameters are calculated from the experimental curves over five oscillation periods :
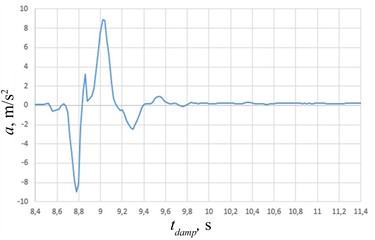
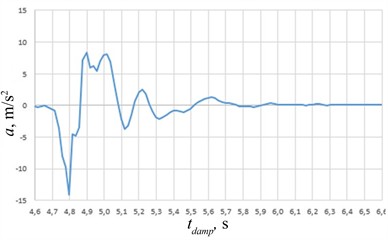
The amplitudes and represent the dominant negative and positive acceleration extrema, respectively, identified directly from five successive oscillation cycles of the experimental transient response (Fig. 2). The initial sharp acceleration peak corresponds to the excitation event and is not included among () and (). The measured signal is not assumed to be an ideal sinusoidal waveform; therefore, the extrema are determined directly from the experimental acceleration record without fitting a theoretical harmonic function to the measured data. Minor local fluctuations within an individual oscillation are not treated as separate cycles. (Eq. (2)) is the observed damped period, defining the damped angular frequency (Eq. (3)). The damping factor (Eq. (5)) and logarithmic decrement (Eq. (4)) then yield the undamped natural frequency via Eq. (6):
where, suspension damping denotes the general dissipative behaviour of the wheel-body system; damping time (, Table 1) is the directly measured interval over which oscillation amplitude decays below sensor resolution; damping capacity refers to the derived viscous resistance coefficient (7), which quantifies the magnitude of dissipation rather than its duration. A reduced at constant manifests as a longer and a smaller decrement .
Since differentiation of a linear SDOF oscillator preserves the characteristic roots (and ), the transient vertical acceleration is modeled directly in the acceleration domain without integration drift:
where and are initial acceleration boundary constants.
5. Experimental results and their discussion
5.1. Analysis of experimental data
A series of drops yielded vertical acceleration diagrams (Fig. 2). The experimental oscillogram is obtained from a large dataset of acceleration measurements recorded by a smartphone equipped with a Bosch BMI220 MEMS accelerometer using the Accelerometer Meter app. The data is imported into Excel and a graph showing the relationship between acceleration and time is plotted.
The period and frequency of the damped oscillations, as well as the amplitudes of successive cycles, are determined from the plotted oscillogram. To ensure the reliability of the results, the parameters are determined over at least three periods; in this study, five complete oscillation cycles were used.
Based on the determined amplitudes, the mean logarithmic decay rate is calculated, followed by the viscous resistance coefficient, the natural frequency and the stiffness of the elastic system; a mathematical model of the damped oscillations is then formulated and verified against the experimental data.
The damping times are given in Table 1.
Table 1Experimental damping time of the ZAZ-1102 suspension vibrations
Car variant | Wheel / Axle | Damping time | Number of oscillations |
Standard ZAZ-1102 (internal combustion engine) | Right front (RF) | 2.05±0.11 | 5 |
Standard ZAZ-1102 (internal combustion engine) | Left front (LF) | 2.31±0.11 | 3 |
Standard ZAZ-1102 (internal combustion engine) | Right rear (RR) | 1.45±0.10 | 5 |
Standard ZAZ-1102 (internal combustion engine) | Left rear (LR) | 1.48±0.10 | 3 |
Modified (EV) | Right front (RF) | 1.36±0.08 | 5 |
Modified (EV) | Left front (LF) | 1.30±0.08 | 3 |
Modified (EV) | Right rear (RR) | 1.24±0.06 | 5 |
Modified (EV) | Left rear (LR) | 1.21±0.06 | 3 |
The analysis shows that, in the standard internal combustion engine (ICE) car, with the front-rear difference (0.6-0.8 s) substantially exceeding the within-position standard deviation 0.06-0.11 s, confirming that the observed axle-level trend is not attributable to measurement scatter. In the EV version, the relocation of the battery pack to the boot provides a more balanced axle weight distribution, which is hypothesized to contribute to the observed convergence of front and rear damping times (1.30…1.36 s front vs. 1.21…1.24 s rear).
5.2. Analytical calculation and diagnosis
For the right-hand front wheel of the base vehicle ( 222 kg), the following values were obtained from the graph (Fig. 2(a)): 1.39 s, 0.278 s, 22.601 rad/s, 1.868, 6.72 s−1, 23.579 rad/s, 2984 N·s/m.
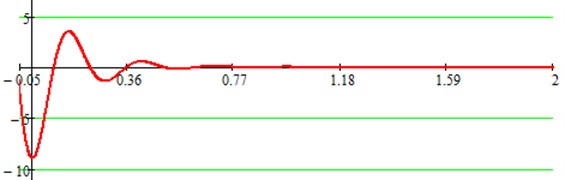
The analytical equation for damping is as follows:
Fig. 2Typical experimental diagrams showing the damping of vertical accelerations for the front wheel of a) the standard ZAZ-1102 and b) the modified ZAZ-11024 EV
a)
b)
The analytical curve (Fig. 3) quantitatively reproduces the key features of the experimental record (Fig. 2(a)): the initial peak acceleration matches within < 2 % (–8.94 m/s2 modeled vs. –8.8 m/s2 measured), the damped period matches exactly ( 0.278 s, 22.601 rad/s), and the signal settles within 0.4-0.5 s. The observed front-rear damping-time equalisation in the EV variant (Section 5.1) is consistent with the redistribution of unsprung/sprung mass ratio reported for battery-relocated EV conversions [3], [5]. However, because inter-vehicle differences in component wear or damping state cannot be fully eliminated outside bench calibration, mass redistribution is interpreted as a plausible primary factor rather than an exclusive causal proof. Plots are displayed separately to maintain visual clarity against high-frequency sensor noise. Point-by-point RMSE was precluded by the app’s graphical export format and is designated for future continuous digitized acquisition.
Fig. 3Theoretical curve showing the damping of suspension oscillations, calculated and visualised
During testing of the electric vehicle, the rear-right suspension underwent 5 oscillations versus 3 for the rear-left before amplitude decay below the sensor resolution threshold, indicating markedly slower damping on the right side. As the raw amplitude traces for these two positions were not retained for full parameter identification (, Eq. (9)), this difference is reported qualitatively, based on and oscillation count (Table 1), as evidence of a shock-absorber deficiency on the rear-right side rather than as a precisely quantified percentage reduction in .
The observed front-rear damping-time equalisation in the EV variant (Section 5.1) is consistent with the redistribution of unsprung/sprung mass ratio reported for battery-relocated EV conversions [3], [5], where a more balanced axle load reduces the disparity in dynamic wheel-load transfer and hence in effective damping response between axles. The method’s sensitivity to the 5-vs-3 oscillation-count asymmetry (Section 5.2) aligns with free-vibration diagnostic approaches reported in [19], [20], while extending them by requiring no stationary test rig – a practical advantage for field diagnostics, at the cost of lower measurement repeatability control (single trolley release vs. rig-controlled excitation) and reliance on smartphone-grade rather than laboratory-grade accelerometry, which limits the attainable precision of derived parameters relative to bench-based methods [19].
6. Conclusions
1) In line with Objective 1, a test trolley was designed and its structural adequacy verified by FEA (deformation of 0.211 mm under a 500 kg load), confirming its suitability as a reproducible free-fall excitation device.
2) In line with Objective 2, MEMS-based acceleration time-histories were recorded for the ICE and EV suspension variants across all wheel positions (Section 3.1, Section 5.1), enabling determination of damping times (Table 1).
3) In line with Objective 3, the derived differential equations of damped oscillation (Eqs. (1-8)) were verified against the experimental curve for the front wheel (Eq. (9), Fig. 3), confirming the mathematical framework’s descriptive adequacy for this record.
4) The balanced axle load distribution in the EV conversion is associated with closer front-rear damping times (1.21-1.36 s vs. 1.45-2.31 s in the ICE), representing a plausible mechanical mechanism consistent with [3], [5], although minor contributions from component wear variations cannot be entirely excluded.
5) In line with Objective 4, the method identified a qualitative shock-absorber deficiency on the rear-right suspension of the EV (5 vs. 3 oscillations before decay below sensor resolution, Section 5.2), demonstrating the method's sensitivity to asymmetric damping faults; a fully quantified reduction in was not established due to the absence of retained raw amplitude data for this position, and is noted as a direction for further work.
6) The discrepancy between the experimental data and the mathematical model derived from the experiment is less than two per cent (–8.94 m/s2 modelled vs. –8.8 m/s2 measured).
References
-
S. Ebrahimi-Nejad, M. Kheybari, and S. V. N. Borujerd, “Multi-objective optimization of a sports car suspension system using simplified quarter-car models,” Mechanics and Industry, Vol. 21, No. 4, p. 412, 2020, https://doi.org/10.1051/meca/2020039
-
A. Aljarbouh and M. Fayaz, “Hybrid modelling and sliding mode control of semi-active suspension systems for both ride comfort and road-holding,” Symmetry, Vol. 12, No. 8, p. 1286, Aug. 2020, https://doi.org/10.3390/sym12081286
-
J. Chen, Y. Wu, X. He, L. Zhang, and S. Dong, “Suspension parameter design of underframe equipment considering series stiffness of shock absorber,” Advances in Mechanical Engineering, Vol. 12, No. 5, pp. 1–12, May 2014, https://doi.org/10.1177/1687814020922647
-
E. Ahmad, J. Iqbal, M. Arshad Khan, W. Liang, and I. Youn, “Predictive control using active aerodynamic surfaces to improve ride quality of a vehicle,” Electronics, Vol. 9, No. 9, p. 1463, Sep. 2020, https://doi.org/10.3390/electronics9091463
-
Q. Chen, X.-X. F. Bai, A.-D. Zhu, D. Wu, X.-C. Deng, and Z.-D. Li, “Influence of balanced suspension on handling stability and ride comfort of off-road vehicle,” Proceedings of the Institution of Mechanical Engineers, Part D: Journal of Automobile Engineering, Vol. 235, No. 6, pp. 1602–1616, Dec. 2020, https://doi.org/10.1177/0954407020976197
-
A. S. Soosairaj and A. Kandavel, “Ride comfort analysis of driver seat using super twisting sliding mode controlled magnetorheological suspension system,” Proceedings of the Institution of Mechanical Engineers, Part D: Journal of Automobile Engineering, Vol. 235, No. 14, pp. 3606–3618, Apr. 2021, https://doi.org/10.1177/09544070211008763
-
E. Palomares, J. C. Bellido, A. L. Morales, A. J. Nieto, J. M. Chicharro, and P. Pintado, “Pointwise-constrained optimal control of a semiactive vehicle suspension,” Optimal Control Applications and Methods, Vol. 42, No. 1, pp. 216–235, 2020, https://doi.org/10.1002/oca.2671
-
T.-C. Nichiţelea and M.-G. Unguritu, “Design and comparisons of adaptive harmonic control for a quarter-car active suspension,” Proceedings of the Institution of Mechanical Engineers, Part D: Journal of Automobile Engineering, Vol. 236, No. 2-3, pp. 343–352, May 2021, https://doi.org/10.1177/09544070211019251
-
G. Papaioannou, D. Koulocheris, and E. Velenis, “Skyhook control strategy for vehicle suspensions based on the distribution of the operational conditions,” Proceedings of the Institution of Mechanical Engineers, Part D: Journal of Automobile Engineering, Vol. 235, No. 10-11, pp. 2776–2790, Mar. 2021, https://doi.org/10.1177/09544070211006517
-
H. Ahmed, A. As’Arry, A. A. Hairuddin, M. Khair Hassan, Y. Liu, and E. C. U. Onwudinjo, “Online DE optimization for Fuzzy-PID controller of Semi-active suspension system featuring MR damper,” IEEE Access, Vol. 10, pp. 129125–129138, Aug. 2022, https://doi.org/10.1109/access.2022.3196160
-
J. C. Dixon, The shock absorber handbook. Chichester, UK: Wiley, 2007, https://doi.org/10.1002/9780470516430
-
H. Jiang, C. Wu, and B. Chen, “Vibration suppression of hub Motor-Air suspension vehicle,” Energies, Vol. 15, No. 11, p. 3916, May 2022, https://doi.org/10.3390/en15113916
-
J. Wang, C. Zong, H. Zheng, C. Liu, and C. Cheng, “Research on the Dynamic Integration Control for Distributed-Traction Electric Vehicle with Four-Wheel-Distributed Steering System,” in SAE Technical Paper Series, Vol. 1, Apr. 2018, https://doi.org/10.4271/2018-01-0814
-
M. Guzek and P. Zdanowicz, “Diagnostics of the On-Vehicle Shock Absorber Testing,” Communications – Scientific Letters of the University of Zilina, Vol. 23, No. 3, pp. B178–B186, 2021, https://doi.org/10.26552/com.c.2021.3.b178-b186
-
T. Ma et al., “Optimized fuzzy skyhook control for semi-active vehicle suspension with new inverse model of magnetorheological fluid damper,” Energies, Vol. 14, No. 6, p. 1674, Mar. 2021, https://doi.org/10.3390/en14061674
-
M. H. Ab Talib et al., “Vibration control of semi-active suspension system using PID controller with advanced firefly algorithm and particle swarm optimization,” Journal of Ambient Intelligence and Humanized Computing, Vol. 12, No. 1, pp. 1119–1137, Jun. 2020, https://doi.org/10.1007/s12652-020-02158-w
-
D. Li, F. Liu, J. Deng, Z. Tang, and Y. Wang, “Nonlinear damping curve control of semi-active suspension based on improved particle swarm optimization,” IEEE Access, Vol. 10, pp. 90958–90970, Aug. 2022, https://doi.org/10.1109/access.2022.3201867
-
A. G. A. Muthalif, M. K. M. Razali, N. H. D. Nordin, and S. B. A. Hamid, “Parametric estimation from empirical data using particle swarm optimization method for different magnetorheological damper models,” IEEE Access, Vol. 9, pp. 72602–72613, May 2021, https://doi.org/10.1109/access.2021.3080432
-
F. Jeniš, Z. Strecker, and I. Mazůrek, “New method for on-board car suspension testing,” in Engineering Mechanics, Vol. 26, pp. 238–241, 2021, https://doi.org/10.21495/5896-3-238
-
Konieczny, J. Warczek, J. Młyńczak, and M. Zawisza, “Free vibration method for technical condition assessment of automotive shock absorbers,” Diagnostyka, Vol. 18, No. 3, pp. 47–53, 2017.
-
X. Du, L. Mai, and H. Sadjadi, “Suspension fault diagnostics using vehicle pitch and roll models,” Annual Conference of the PHM Society, Vol. 13, No. 1, 2021, https://doi.org/10.36001/phmconf.2021.v13i1.2975
About this article

The authors have not disclosed any funding.
The datasets generated during and/or analyzed during the current study are available from the corresponding author on reasonable request.
The authors declare that they have no conflict of interest.

