Abstract
Field random vibration is usually non-Gaussian, which makes ordinary random vibration testing unable to simulate the fatigue damage that products will experience in field. A new method is proposed in this paper to synthesize running RMS-induced non-Gaussian vibration based on the probability distribution of running RMS (root mean square), which is simulated by using the two-parameter Weibull distribution. Shock response spectrum (SRS) is used to detect significant transients within signals. The synthesized non-Gaussian signal has the same PSD, kurtosis and PDF (probability density function) as the field data. Fatigue damage spectrum (FDS) is used as another proof of the effectiveness of this proposed new method.
1. Introduction
Random vibration testing is usually used to bring a test item to failure to identify weaknesses in the product or to verify if the product can survive a particular random vibration environment. Historically, random vibration controllers accomplished this goal by producing a PSD (power spectral density) that would expose the test item to the type of vibratory environment that the test item would experience in a real-world setting. Since PSD does not contain phase information, vibration controllers always assume the phase of each frequency component follows a 0 to 2 uniform distribution when producing time history using PSD. This leads to data with Gaussian distribution, which means an ordinary random vibration controller can’t simulate the real vibration environment when it is non-Gaussian. This situation did not change until commercial software which can control kurtosis of data was developed, for instance by Vibration Research Company [1]. Non-Gaussian vibration is usually encountered, especially in the road transportation domain [2, 3]. Actually, the probability of the amplitude exceeding is only 0.27 % for Gaussian vibration, but up to 1.5 % for field data [1]. This difference may lead to totally different accumulated fatigue damage, because most fatigue damage is caused by 2 to 4 [4]. When peak value exceeds 3, products fail quickly. MIL-STD810F points out that we should always check if the field tested data is non-Gaussian and the testing hardware and software is appropriate [5]. The time waveform replication (TWR) is frequently referred to as a methodology for non-Gaussian testing. The basic idea of TWR is to reproduce a sequence of instantaneous values of the vibration process. Such a test may be non-Gaussian, however this is only a replication of one particular measured record, not a simulation of a specified road type. Besides, MIL-STD810F says that TWR is usually used for controlling of transient signal or short time lasting random vibration [5]. With these drawbacks of TWR, many researchers present some other methods to simulate non-Gaussian vibration. Smallwood used three zero-memory nonlinear (ZMNL) functions to transform Gaussian vibration to non-Gaussian vibration [6, 7]. It was only later when this method was extended and modified into a method that can be used in the closed-loop frequency domain control mode [9, 10]. Steinwolf developed a special phase selection method [8-10]. Rouillard et al. presented a novel technique by which non-Gaussian vibrations are synthesized by generating a sequence of random Gaussian processes of varying RMS levels and durations [11-16]. John et al. studied the relationship between kurtosis and fatigue damage spectrum (FDS) [17].
A new method is proposed in this paper to synthesize running RMS-induced non-Gaussian random vibration based on the probability distribution of running RMS (root mean square), which is simulated by using a two-parameter Weibull distribution model. Shock response spectrum (SRS) is used to detect significant transients within signals. No sequence of random Gaussian processes of varying RMS levels and durations needs to be generated in this method, which makes it much easier to be implemented than that Rouillard et al. used [11-16]. The synthesized non-Gaussian signal has the same PSD, kurtosis and PDF (probability density function) with the field data. Fatigue damage spectrum (FDS) is used as another proof of the effectiveness of this new method. Effect of correlation time is shown by studying the PSD, PDF and FDS of synthesized non-Gaussian signals using three different correlation times. The process and effectiveness of this new method is illustrated by using a case study.
2. Non-Gaussian
If a Gaussian process has a zero mean value and is ergodic, the PDF of the instantaneous values that are realized over a long period of time is given by the Gaussian distribution with zero mean:
where is standard deviation. When has zero mean, the variance is given by:
Or for large durations , the variance is given by:
where is the single-sided PSD.
It shows that random Gaussian processes with zero mean can be completely described by the PSD function.
One useful method for establishing how well a random process can be described by the Gaussian distribution is by computing the higher order moments of the process defined as:
The mean value can be calculated by :
When the mean value is zero:
where is the skewness and is the kurtosis.
For a truly Gaussian process, the skewness is 0 and the kurtosis is 3.
3. Fatigue damage analysis
RFCC and Dirlik methods are frequently referred to as two methodologies for fatigue damage analysis [18-20].
T. Dirlik [21] established empirical expressions of the probability density of the ordinary half-ranges and those counted with the RFCC method using a digital simulation. The method involved: giving itself a priori an expression of the density, utilizing the spectral moments of order 0, 1, 2 and 4 of the power spectral density of the stress; and then determining the coefficients by minimization of the differences between this density and the histograms determined by considering signals generated starting from 70 spectral PSD of various shapes.
4. Case study
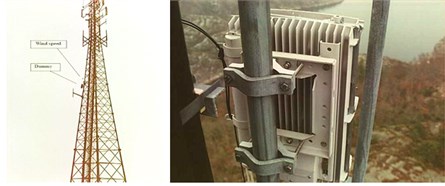
In this case study, a new method for synthesizing running RMS-induced non-Gaussian random vibration is developed and examined by using field data. The field tested signal provided by Kjell Ahlin is from an Ericsson Mast Project and shown in Fig. 1. The test item and setup is shown in Fig. 2.
Fig. 1Field tested signal
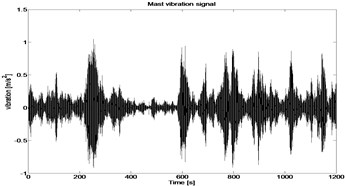
Fig. 2Test item and setup
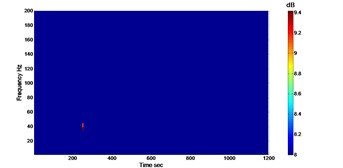
This is a non-Gaussian signal with kurtosis equals 9.4262, which can hardly be simulated by ordinary random vibration controller. The SRS is calculated from the time history and from PSD. The ratio between these two SRS is shown in db using a third dimension (see Fig. 3).
As we can see from Fig. 3, there are no significant shocks in this signal.
The new developed method first calculates the PSD of field data, with which a stationary Gaussian signal can be generated. Then, an amplitude modulation function (AMF) is created based on the probability distribution of running RMS of field data, which is simulated by using the two-parameter Weibull distribution model. Finally, multiply the Gaussian signal generated before with the modulation signal to obtain the synthesized non-Gaussian signal.
PSD of the field data is show in Fig. 4. Gaussian signal is generated using a smoothed PSD (see Fig. 4). The PSD of synthesized Gaussian signal is also shown in Fig. 4. The PDF of field data and synthesized Gaussian signal with the same mean value and variance are shown in Fig. 5. As we can see from Fig. 5, the PDF of field data is obviously different from that of synthesized Gaussian signal.
Fig. 3The ratio between two SRS
a)
b)
Fig. 4PSD of field data and synthesized Gaussian signal
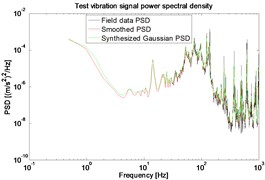
Fig. 5PDF of field data and synthesized Gaussian signal
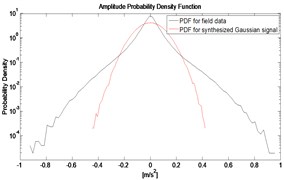
Fig. 6Running RMS
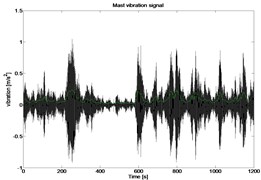
Fig. 7PDF of running RMS
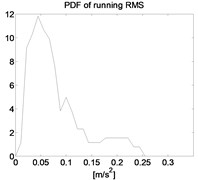
The running RMS and its PDF are calculated and shown in Fig. 6 and Fig. 7. The effect of different number of bins on the PDF of running RMS is shown in Fig. 8. From Fig. 8 we can see that, despite of the numbers of bins, the PDF of running RMS is similar to the PDF of a given Rayleigh distribution. To be more general, a two-parameter Weibull distribution is used to simulate the statistical distribution of running RMS and to create the AMF. The cumulative distribution function of Weibull distribution can be expressed as:
where is the random variable, is the scale parameter, is the shape parameter.
The AMF is essentially a vector containing elements that follow the same statistical distribution with the Weibull distribution. Different and are tested to see the changes of kurtosis. Results are shown in Fig. 9. As we can see from Fig. 9, a large range of kurtosis can be obtained using Weibull distribution. and are determined using an iterative method (see Fig. 10). The PDF of resulted Weibull distribution is shown in Fig. 11.
Finally, by multiplying the Gaussian signal generated before with the AMF, the synthesized non-Gaussian signal is shown in Fig. 12, together with the field data.
The PSD and PDF of field data and synthesized non-Gaussian signal are very similar (see Figs. 13 and 14), which proves the effectiveness of the new method for synthesizing running RMS-induced non-Gaussian signal.
Fig. 8APD of running RMS using different number of bins and Rayleigh distribution
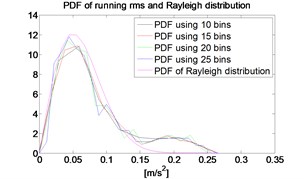
Fig. 9Kurtosis for different L and K
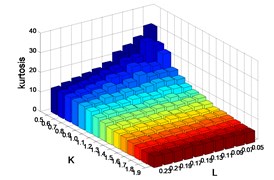
Fig. 10The iteration to determine L and K
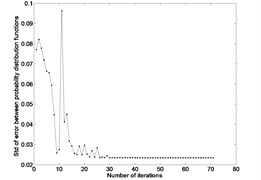
Fig. 11The PDF of running RMS and Weibull
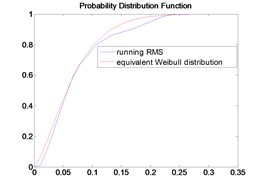
Fig. 12Field data and synthesized non-Gaussian signal
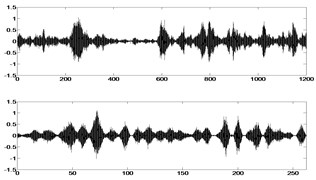
Fig. 13The PSD of field data and synthesized non-Gaussian signal
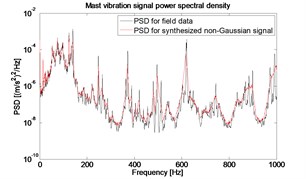
Fig. 14PDF for field data and synthesized Gaussian and non-Gaussian signal
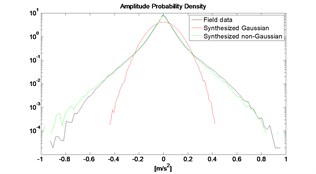
Fig. 15Numbers of cycles versus mean and range of data
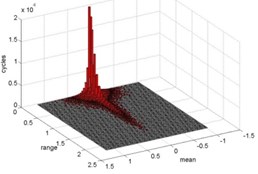
Fig. 16Number of cycles versus data ranges for RFCC and Dirlik
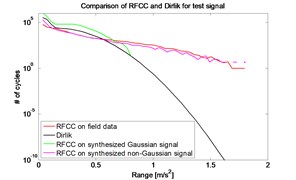
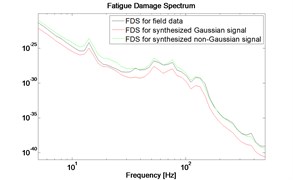
Fig. 17FDS for field data, synthesized Gaussian and non-Gaussian signal
Fatigue damage analysis is performed on field data. RFCC results are shown in Fig. 15. The plot of number of cycles versus stress ranges is shown in Fig. 16 for field data, synthesized Gaussian signal and non-Gaussian signal. From Fig. 16 we can see that Dirlik method is equivalent to RFCC when dealing with Gaussian signal and can introduce big error when dealing with non-Gaussian signal. Results of RFCC on field data and synthesized non-Gaussian signal are very similar.
FDS is calculated for field data, synthesized Gaussian and non-Gaussian signal (see Fig. 17). From Fig. 17 we can see that FDS for field data and synthesized non-Gaussian signal are very similar. This again proves the validity of the new method for synthesizing non-Gaussian signal. Besides, we can see from Fig. 17 that larger kurtosis leads to larger fatigue damage.
5. Conclusion
A new method for synthesizing running RMS-induced non-Gaussian Random Vibration is developed and examined by field data. Conclusions are as below:
1) This method is limited to the case of running RMS-induced non-Gaussian signals, which contain no significant transients.
2) The synthesized non-Gaussian signal has the same PSD, kurtosis, PDF and FDS with field data, which proves the effectiveness of the new method.
3) Dirlik methods are equivalent with RFCC when dealing with Gaussian signal and can introduce big error when dealing with non-Gaussian signal.
References
-
Van Baren P. The missing knob on your random vibration controller. Sound and Vibration, 2005, p. 2-7.
-
Connon W. H. Comments on kurtosis of military vehicle vibration data. Journal of the IES, Vol. 34, Issue 6, 1991, p. 38-41.
-
Charles D. Derivation of environment descriptions and test severities from measured road transportation data. Journal of the IES, Vol. 36, Issue 1 1993, p. 37-42.
-
Lambert R. G. Fatigue life prediction for various random stress peak distributions. Shock and Vibration Inform, Center the Shock and Vibration Bull, Vol. 52, 1982.
-
MIL-STD-810F. Department of Defense Test Method Standard for Environmental Engineering Considerations and Laboratory Tests, USA, 2000.
-
Smallwood D. O. Generation of stationary non-Gaussian time histories with a specified cross-spectral density. Shock and Vibration, Vol. 4, Issue 5, 1997, p. 361-377.
-
Smallwood D. O. Generating non-Gaussian vibration for testing purposes. Sound and Vibration, Vol. 39, Issue 10, 2005, p. 18-23.
-
Steinwolf A. Shaker simulation of random vibration with a high kurtosis value. Journal of the Institute of Environmental Sciences, Vol. 40, Issue 3, 1997, p. 33-43.
-
Steinwolf A. Closed-loop shaker simulation of non-Gaussian random vibrations. Part 1 Discussion and methods. Part 2 Numerical and experimental results. Test Engineering and Management, Vol. 68, Issue 3, 5, 2006, p. 10-13, p. 14-19.
-
Steinwolf A. Random vibration testing beyond PSD limitations. Sound and Vibration, Vol. 40, Issue 9, 2006, p. 12-21.
-
Rouillard V. On the synthesis of non-Gaussian road vehicle vibrations. Monash University, 2007.
-
Rouillard V.,Lamb M. On the effects of sampling parameters when surveying distribution vibrations. Packaging Technology and Science, Vol. 431, Issue 8, 2008, p. 467-477.
-
Rouillard V., Sek M. A. Synthesizing non-stationary, non-Gaussian random vibrations. Packaging Technology and Science, Vol. 23, Issue 8, 2010, p. 423-439.
-
Garcia-Romeu M. A., Rouillard V. On the statistical distribution of road vehicle vibrations. Journal of Packaging Technology and Science, Vol. 24, Issue 8, 2011, p. 451-467.
-
Rouillard V., Sek M. Creating Transport Vibration Simulation Profiles from Vehicle and Road Characteristics. Packaging Technology and Science, 2012.
-
Rouillard V. Quantifying the Non‐stationarity of Vehicle Vibrations with the Run Test. Packaging Technology and Science, 2013.
-
Van Baren J.,Van Baren P., Jenison M. I. The fatigue damage spectrum and kurtosis control. Sound and Vibration, Vol. 46, Issue 10, 2012, p. 10.
-
Matsuishi M., Endo T. Fatigue of metals subjected to varying stress. Japan Society of Mechanical Engineers, Fukuoka, Japan, 1968, p. 37-40.
-
Endo T. Damage evaluation of metals for random on varying loading-three aspects of rain flow method. Symposium on Mechanical Behavior of Materials, Japan, 1974.
-
Lalanne C. Mechanical Vibration and Shock, Fatigue Damage. Wiley, 2010.
-
Dirlik T. Application of Computers in Fatigue Analysis. University of Warwick, 1985.
About this article

