Abstract
Modern high-speed structures often have great vibration, noise and dynamic loads. Traditional technology pays more attention to geometric constraint, strength constraint, stability constraint and frequency constraint generally. During the running process of a car, road roughness will cause vibration of the car. When the vibration reaches certain extent, it will not only affect the fatigue life of the car, but also affect the seat comfort and operation stability. In this paper, the optimal solution considering the dynamic response of the car under the dynamic excitation of the road was sought by taking acceleration response as the constraint, the minimum mass and the minimum acceleration response as the optimization objectives. Because the car model is complicated, a hybrid finite element model was built by simplifying the car model to obtain frame, Frequency response analysis was carried out on the car frame to extract mass and acceleration response. Optimization analysis was also carried out on the car frame by means of linear weighted sum method and NCGA method. The results show that both of them can optimize the mass and acceleration of the car frame and can meet the strength requirements.
1. Introduction
In recent years, the appearance of light weight for automobiles has caused the problems of car body noise, vibration and dynamic loads. Improving the dynamic response design level of the car body has become the emphasis in automobile development. The car frame of is the basic environment of the driver. A person’s various comforts are closely related to the car body system. Road roughness excitation has great influence on the vibration comfort of the automobiles. Automobiles have vertical vibration excited by the road roughness during running, and such vibration will make the passengers feel uncomfortable if it reaches certain extent. Therefore, analyzing the problem of dynamic response for the car body is of great practical significance to improving the design quality of automobiles.
For control of the automobile vibration, on the one hand, it is to reduce the excitation from the road through suspension system. On the other hand, it is to change the mass matrix and the stiffness matrix of the structure by changing the thickness of the car frame plates, as a result the vibration characteristics of the structure are changed. This paper takes the latter method to optimize the car frame.
For research on the problem of dynamic response for car frame, scientists have carried out abundant works in terms of structural dynamic model and modal analysis. They have achieved valuable theories and achievements. Zheng [1] used the large-scale software SAP.5P to analyze dynamic of the truck frame and proposed to use the modal analysis result to directly evaluate the structural dynamic characteristic. Beermann [2] proposed to simulate the junction of beams and stringers for truck frame by using beams and plates mixed element. Hadad [3] studied how to use the modal analysis result of finite element to modify the frame design. Ding [4] carried out structural strength analysis on a car and found that its stress was large and its strength was not enough. Because of so many components of the car frame, to improve optimization efficiency, in reference [4], the ratio between torsional displacement and the mass of the car frame was taken as the evaluation index. The thicknesses of some components which were sensitive to the response were selected as the design variables by sensitivity analysis. Main objective method was adopted, with the maximum structure stress of right front wheel under the full loaded the work condition as the objective function, and the maximum structure stresses under other two work conditions were considered as the constraints. However, there are few researches on optimization of the dynamic response for automobiles by means of frequency response analysis. Given the mentioned problems, the car frame was taken as the research object in this paper to carry out acceleration response optimization. Size optimization was carried out on the car frame by linear weighted sum method and NCGA method, respectively. Both methods can reduce the acceleration response and the mass of the structure. Linear weighted sum method can optimize the acceleration response more obviously, while NCGA method can optimize the mass more obviously. The optimization results by both methods can meet the requirements of static strength.
2. The verification of the hybrid finite element model
2.1. Finite element model of the car frame
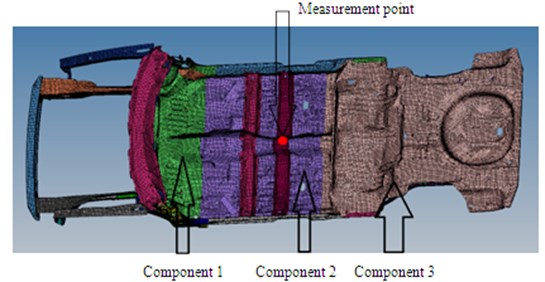
When building hybrid finite element model of the car frame, under the premise of complying with the main mechanical characteristics of the structure, the small sized structures such as pinholes, openings, flanging, small ribs and small lug bosses were simplified. The plates were fixed and connected by nodes. Some minor components could be simulated by means of establishing concentrated mass. The head structure was simulated by beam model. Compared with simulation by shell element which needs many elements and nodes, simulation by beam element only needs dozens of elements and nodes. Therefore, it can significantly reduce modeling effort and improve analysis speed. The established finite element model is as shown in Fig. 1.
Fig. 1The hybrid finite element model of the car frame
2.2. Verification of the hybrid finite element model
The car frame is a very complicated structure. Hence, it is necessary to conduct modal test to verify the reliability of the finite element model in order to guarantee subsequent analysis. Air springs were used to support 4 points of the car frame. Pressure of the air springs was adjusted to 0.5 bar. By adjusting height of the air spring supports, the car frame was kept horizontal.
By selecting proper manner, position and direction for excitation, a good signal to noise ratio can be obtained. Hence, for the car frame with large structure, multi-point excitation shall be carried out on the parts with big rigidity. In this test, excitation was conducted on 3 points simultaneously by a vibration exciter. Positions and directions of excitation are + direction of the right front longitudinal beam, + direction of the middle channel end, and + direction of the left rear longitudinal beam, as shown in Fig. 2.
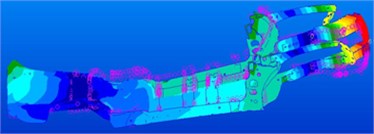
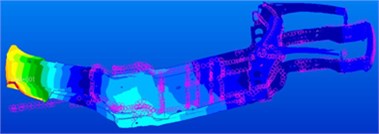
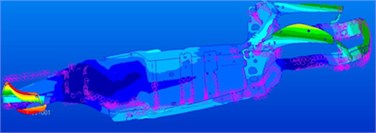
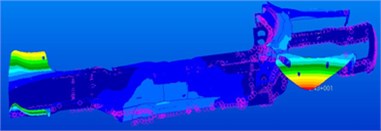
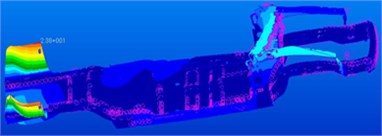
Inherent frequencies of the top 6 orders, which were obtained by the modal test, are compared with simulation results, as shown in Table 1. It is shown in the table that relative errors between them are controlled within 5 %, which indicates that the finite element model is reliable and can be used in subsequent analysis. Modes of the top 6 orders are extracted, as shown in Fig. 2. It is shown in Fig. 3 that areas with serious vibration mainly appeared at front and rear longitudinal beams.
Fig. 2Position and direction of excitation in modal test
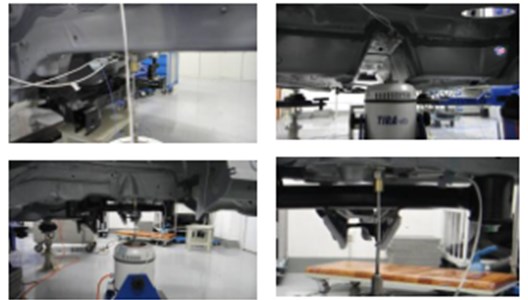
Table 1Modal comparison of the top 6 orders between experiment and simulation
Order | Experiment / Hz | Simulation / Hz | Relative Error / % |
1 | 15.73 | 16.49 | 4.83 |
2 | 18.47 | 18.13 | –1.84 |
3 | 26.89 | 25.95 | –3.50 |
4 | 29.56 | 30.30 | 2.50 |
5 | 34.87 | 33.45 | –4.07 |
6 | 36.12 | 35.09 | –2.85 |
Fig. 3Modes of the car frame at the top 6 orders
a) 16.49 Hz
b) 16.49 Hz
c) 16.49 Hz
d) 30.30 Hz
e) 33.45 Hz
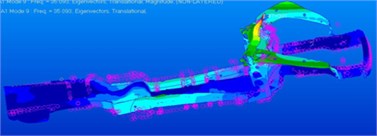
f) 35.09 Hz
2.3. Frequency response analysis on the car body
Frequency response function describes the Fourier transformation relation between the output response and the excitation. It is a function which the circular frequency is the independent variable. As the inherent characteristic of the structure, it is only related to the mass, stiffness and damping characteristics of the structure, and is unrelated to loads. Frequency response analysis is to calculate the output response of the structure under simple harmonic excitation. Its objective is to acquire the transfer function of the structure [5, 6].
Vibration equation of the system:
The transformation of the displacement base vector was introduced:
The significance of such transformation is to regard as the linear combination of , i.e., displacement vector transforms to -dimensional space with as the base vector from the -dimensional space with the node displacement of the finite element system as the base vector. Although this is not geometrically visual, it reflects the contribution of each natural mode of vibration to the system motion, and is referred to as modal coordinate.
Substitute the displacement under modal coordinate to the motion Eq. (2) of discrete structure, multiply by at both sides. uncoupled second order ordinary differential equation would be acquired by applying weighting orthogonal conditions. The th order vibration differential equation is:
Carrying out Fourier transform for the mentioned equation to obtain:
Then, the th order frequency response function is:
The total frequency response function of the structure can be expressed as:
The mentioned equation is the frequency response function of the structure expressed by modal superposition method. In actual application, it doesn’t need to calculate all the modals of the structure. Generally, it only needs to calculate the modals of the first more than ten orders or that in the range of the externally excitation frequency.
Frequency response function can also be acquired by directly carrying out Fourier transform for differential Eq. (1), i.e.:
Corresponding to each excitation frequency , the mentioned equation would become a problem for calculation of static force, and can be solved by the methods of solving static force problems, i. e.:
The car frame in this paper is a big model. It was calculated by modal method as the priority, frequency response analysis was carried out on the car frame in the direction vertical to the road, and the acceleration response in the direction vertical to the road was extracted [7, 8].
3. The preparation of the optimization design
3.1. Optimization problem analysis
is made to express the vector constituted by each variable, where indicates the number of the variables. The objective function is , which is required to reach the minimum value. Constraint function consists of equality constraint and inequality constraint . And then the optimization problem can be indicated in the form in Eqs. (9)-(12):
where indicates the interval of value.
Compared with single objective optimization problems, multi-objective optimization problem is featured by the following [9]:
1) The sub-objectives in a multi-objective optimization problem are often mutually competitive. Improvement of one objective will often cause the deterioration of another sub-objective(s).
2) A multi-objective optimization problem generally has a group of optimal solutions instead of a single absolute optimal solution. The final optimal solution depends on the decision makers’ understanding for the problem and personal preference.
For the optimization problem in this paper, the objective is minimum weight, and the constraint is that the acceleration response meets the requirement. And the sizes of the optimization variables should meet the technological requirements.
There are many ways to solve the mentioned optimization problem. In this paper, it is solved mainly by linear weighted sum method and NCGA method.
The description of linear weighted sum method in mathematical language is shown in the followed:
In the equation, is the weight coefficient of the sub-objective function. Generally, it is required and [6].
In fact, weight coefficient cannot accurately reflect the relative importance degree of each sub-objective. Because the values of the sub-objectives may be quite different from each other, a zoom coefficient is often introduced for each sub-objective to solve such problem. The optimization model shown in the Eq. (13) was improved as follow [10]. is :
NCGA method not only absorbs the advanced techniques of many other multi-objective genetic algorithms, but also changes the practice of randomly selecting individuals for hybridization in previous genetic algorithms. And the thought of neighborhood hybridization is firstly proposed [11, 12].
3.2. Optimization scheme determination
The mass and acceleration of the simplified finite element model for the car frame were optimized. , and are the thickness of Component 1, Component 2 and Component 3 of the car frame, respectively, which are considered as the optimization variable, as shown in Fig. 1. They contain most mass of the car frame. Constraint condition is that the maximum acceleration response should be less than 500 mm/s2, which can ensure no harmful vibration to the structure and ensure the comfort of the passengers. The optimization objectives are acceleration response and mass [13]. The car frame structure was optimized by means of linear weighted sum method and NCGA method, respectively. Because the optimization process was not included in strength constraint, strength check was required to carry out on the optimal solution after the optimization. And then the strength of the optimized structure was compared with the initial model. The entire optimization flow is as shown in Fig. 4.
Fig. 4Optimization design flow of the car frame

3.3. Test of the road excitation
It is necessary to test vibration displacement of the car frame on a real road and apply it into the hybrid finite element model. In this way, the car frame can be simulated really. As shown in Fig. 1, the measurement point is arranged at the intersection position of the floor channel and the beam. Test results are shown in Fig. 5.
Fig. 5Vibration displacement of the car frame on the real road
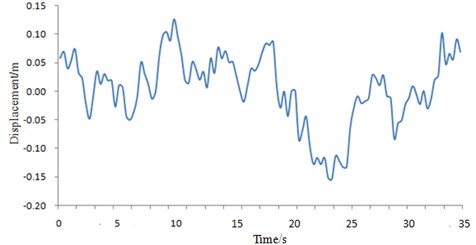
It is shown in Fig. 5 that the vibration displacement fluctuates irregularly when the vehicle is running on a real road. The actual situations can not be simulated if only a sinusoidal signal is applied on the car frame as excitation.
4. Optimization results analysis
4.1. Linear weighted sum method
The initial mass of the structure was 0.14 t, and the acceleration response was approximate 400 mm/s2. The mathematical model of the multi-objective problem can be indicated as:
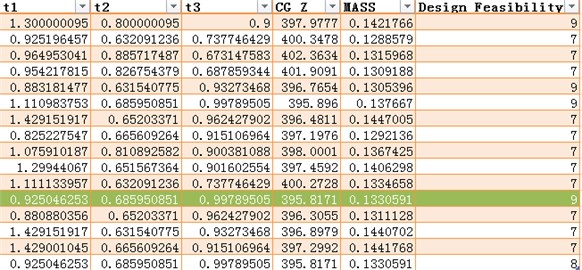
The range of the weight vector Because the dynamic response characteristics of the structure were emphasized, the weight coefficient of the extreme value for acceleration response was larger than that of the structure mass in the weight vector. Some iteration progress was cut out, as shown in Fig. 6. The changes of acceleration response and mass are as shown in Fig. 7.
Fig. 6Iteration progress of the linear weighted sum method
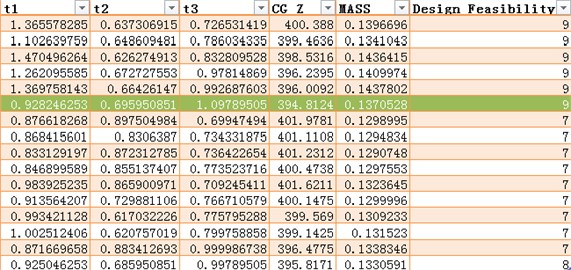
Fig. 7Acceleration changes with the mass of the car frame
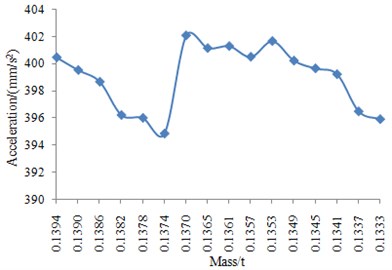
It can be seen from Fig. 7 that acceleration response is minimum when the total mass is 0.1374 t. And the minimum value of acceleration response is 394.8124 mm/s2. The total mass reduced by 1.4 % when it was compared with the initial structure.
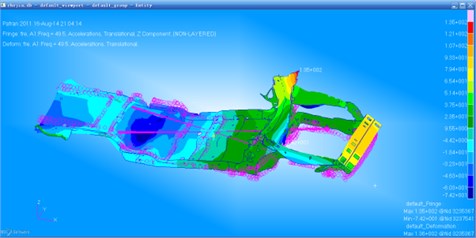
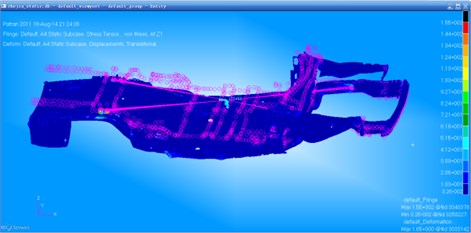
In order to clearly observe the optimization effect, we extracted the acceleration response contour of the initial and optimization structure under the function of unit sine force, as shown in Fig. 8 and Fig. 9.
It can be obtained from the comparison that the maximum acceleration response of the initial car frame is 177 mm/s2, while the maximum acceleration response of the optimized car frame is 135 mm/s2. The maximum acceleration response reduces by 23.7 %. The optimization effect is very obvious.
Fig. 8Acceleration response contour of the initial car frame
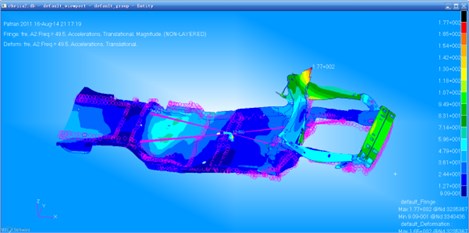
Fig. 9Acceleration response contour of the optimized car frame
4.2. NCGA (neighborhood cultivation genetic algorithm)
The algorithm in optimization module was changed to NCGA in ISIGHT platform, while the other parameters kept unchanged. Some iteration progress was cut out, as shown in Fig. 10. The changes of acceleration response and mass are as shown in Fig. 11.
Fig. 10Iteration progress of the NCGA method
It can be seen from Fig. 11 that acceleration response is minimum when the total mass is 0.1333 t. And the minimum value of acceleration response is 395.8174 mm/s2. The total mass reduced by 4.3 % when it was compared with the initial structure.
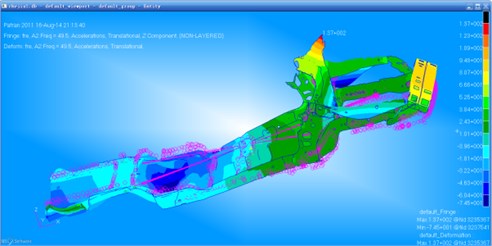
In order to clearly observe the optimization effect, we extracted the acceleration response contour of the optimization structure by NCGA method under the function of unit sine force, as shown in Fig. 12.
It can be obtained from the comparison between Fig. 8 and Fig. 12 that the maximum acceleration response of the initial car frame is 177 mm/s2, while the maximum acceleration response of the optimized car frame is 137 mm/s2. The maximum acceleration response reduces by 22.5 %. The optimization effect is very obvious.
Fig. 11Acceleration changes with the mass of the car frame
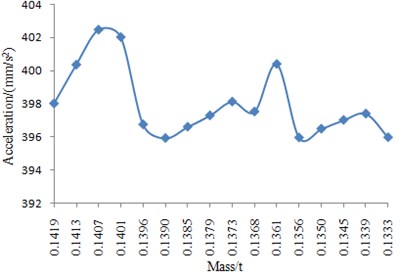
Fig. 12Acceleration response contour of the optimized car frame
As for iterations, it is as many as possible theoretically. However, for the time-consuming optimization process in this paper, because of its small further optimization space after sufficient repeated iterations, the strategy of exchanging time for the limited optimization effect is unacceptable. Generally, acquiring a group of satisfactory solutions is enough.
4.3. Static strength check
Under the inertial load of 3G (gravitational acceleration), static analysis was carried out on the car frame. The maximum static stress force of the initial car frame is 155 MPa, and its stress contour is as shown in Fig. 13.
Fig. 13Stress contour of the initial car frame
The maximum static stress force of the optimized car frame by means of linear weighted sum method is 148 MPa, and its stress contour is as shown in Fig. 14. The maximum static stress force of the optimized car frame by means of NCGA method is 145 MPa, and its stress contour is as shown in Fig. 15. The results show that the static stress force completely meets the requirements after optimization, and the static stress force level of the car frame is also improved slightly.
Fig. 14Stress contour of the optimized car frame by the linear weighted sum method
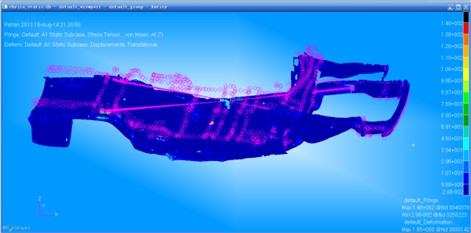
Fig. 15Stress contour of the optimized car frame by the NCGA method

5. Conclusions
The optimization of the car frame system in this paper is featured by the following.
1) Hybrid finite element modeling is carried out on the car frame, which simplifies the model to a great extent, thus improving the optimization efficiency. In addition, we carry out on comparison between the test modal simulation one to verify the reliability of the hybrid finite element model. Results show that the model is very reliable to be used for the subsequent analysis.
2) Comparison of the optimal solutions acquired by two algorithms shows that linear weighted sum method has the best vibration reduction effect.
3) Comparison of the optimal solutions acquired by two algorithms shows that the vibration reduction effect of NCGA is slightly inferior to linear weighted sum method, but its weight reduction effect is improved more significantly compared with that of linear weighted sum method. As a result, we should choose a proper method to optimize the car frame according to the actual demand.
4) The optimization result of NCGA is affected by iterations, and the more the iterations are, the more accurate the calculation result will be. However, its latter optimization space is small and time-consuming. Therefore, the researchers only need to acquire a group of satisfactory solutions.
The two methods in the paper above have successfully decreased the dynamic response of the car frame. Using them to the design of the car frame can not only increase the fatigue life of the car, but also improve the seat comfort and operation stability. How to simplify the frame model further to improve the computational efficiency and propose improved algorithm more efficiently, is the key to the future research.
References
-
Zheng Z. J. Calculation of natural frequency and vibration mode for vehicle frame. Automotive Engineering, Vol. 2, 1982, p. 41-45.
-
Beermann H. J. Static analysis of commercial vehicle frames: a hybrid-finite element analytical. International Journal of Vehicle Design, Vol. 5, 1984, p. 26-52.
-
Hadad H., Ramezani A. Finite element model updating of a vehicle chassis frame. Proceeding of the 2004 International Conference on Noise and Vibration Engineering, 2004, p. 1817-1831.
-
Ding W. Q., Su R Y., Gui L. J. Multi-Objective Optimization on Bus Structure Based on Optimized Stress. Automotive Technology, 2010.
-
Liu M. Research on Optimization Method and Modal Test Analysis of Vehicle Frame. Changan University, 2009.
-
Yu F., Lin Y. Vehicle System Dynamics. China Machine Press, 2005.
-
Zheng Z. J. Calculation of natural frequencies and mode shapes for vehicle frame. Automotive Engineering, Vol. 2, 1982, p. 41-45.
-
Healey A. J., Nathman E., Smith C. C. An analytical and experimental study of automotive dynamics with random roadway inputs. Transactions of the ASME, Vol. 12, 1997, p. 284-292.
-
Marler R. T., Arora J. S. Survey of multi-objective optimization methods for engineering. Structural and Multidisciplinary Optimization, Vol. 26, 2004, p. 369-395.
-
Kaymaz I., MaMahon C. A. A response surface method based on weighted regression for structural reliablitity analysis. Probabilistic Mechanics, Vol. 20, Issue 1, 2005, p. 11-17.
-
Manohar P. Kamat Structural Optimization: Status and Promise. American Institute of Aeronautics and Astronautics, 1993.
-
Jenkins W. M. Towards structural optimization via the genetic algorithm. Computer and Structures, Vol. 40, Issue 5, 1991, p. 1321-1327.
-
Marler R. T., Arora J. S. Survey of multi-objective optimization methods for engineering. Structural and Multidisciplinary Optimization, Vol. 26, 2004, p. 369-395.
About this article

