Abstract
Real-time health monitoring and fault diagnosis system of hydraulic pump is very crucial as the pump being the power source of the entire hydraulic system. Prognostic method based on logistic regression for health assessment and fault classification is proposed. The real-time state of the system is obtained by processing the data of vibration signals collected from the pumps, and maintenance can be performed as long as the failure or malfunction prognosis indicates instead of periodic maintenance inspections. The vibration signal is decomposed into several product functions by local mean decomposition (LMD), and the product functions that contain fault information form a feature vector by abstracting energy values and corresponding time-domain statistical magnitudes. Principle component analysis (PCA) is used for feature reduction. Logistic regression (LR) models are trained by the reduced features to obtain machine health condition and classify possible failure models. The maximum likelihood method is applied to determine the parameters of LR models. The methodology has been applied to process the vibration signals of a real hydraulic pump to verify the effectiveness and feasibility.
1. Introduction
Hydraulic pump is critical to hydraulic system and its state always reflects whether the operation of the entire system is normal or not. Generally hydraulic pumps under an abnormal state are accompanied with vibration changes [1-3]. This paper provides a prognostic method for hydraulic pump health assessment and root cause classification by logistic regression.
Four sections are included to demonstrate the whole study. Section two illustrates the prognostic methodology along with related mathematics. Section three shows the information of hydraulic pump vibration signals and assessment/classification results obtained by processing them using the proposed scheme. Section four summarizes the paper and gives future research directions.
2. Methodology
The prognostic scheme is based on monitored data which contains hydraulic pump’s incipient failure signatures together with intelligent mathematical techniques which can be incorporated to detect, evaluate the risk of failure over some protracted period of time and also classify which particular type of failure may occur.
2.1. Procedures of the methodology
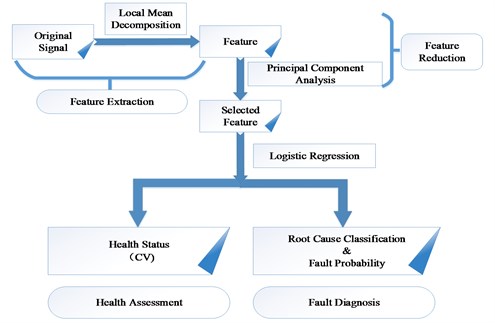
There are two major steps of the methodology. Step 1: feature extraction and selection that extracts and determines appropriate features for health assessment and root cause classification as well as reducing the search space for fast computation. Step 2: health assessment and root cause classification by means of the logistic regression method. The process of the methodology can be summarized as Fig. 1.
Fig. 1Process of the methodology
2.2. Feature extraction using local mean decomposition
The LMD scheme involves separating a frequency modulated signal from an amplitude modulated envelope signal. The process of the separation includes smoothing the original signal, subtracting the smoothed signal from the original signal and using an envelope estimate to amplitude demodulate the result. Product function is obtained through multiplying the frequency modulated signal by the final envelope estimate. The whole process is repeated on the resulting signal, to acquire a second product function with an associated envelope and instantaneous frequency. By the time the remaining signal contains no more oscillations, the decomposition is finally completed [4].
The feature vector of the hydraulic pump vibration signals contains twelve components. The feature vector is:
where the and are the skewness coefficients and kurtosis coefficients of the product functions, given by:
The energy value of each product function is given by:
In consideration of the energy values are always large, for the sake of processing and analysis, the energy vector is normalized as [5]:
2.3. Feature reduction based on PCA
Assuming that an operation stage (in this paper, only the normal machine behavior and machine operation with a worn piston shoe and swashplate/valve plate rotor) of the hydraulic pump is given and its features are characterized by the multivariate Gaussian distribution with mean and covariance matrix. The symmetric matrix is given as:
where is the rank of , ( 1, 2,…,) are the non-zero eigenvalues of and are the corresponding unit norm eigen-vectors. The definition of and are given by:
Each eigenvalue ( 1, 2,…, ) depicts the amount of the covariance matrix energy projected in the direction of the corresponding eigenvector. When there exists a high degree of correlation among the components of , only a few of the eigenvalues in account for most of the energy in the covariance matrix Thus, assuming that eigenvalues ( 1, 2,…, ) are arranged in descending order, Eq. (6) can be represented as:
where:
where is the number of the principal components of , (1, 2,…,) are the largest eigenvalues of , and are the corresponding unit norm eigenvectors.
A query item can now be transformed into a component random variable given as:
If belongs to the class of signals from centrifugal pump state , then should be normally distributed with zero mean and variance , where is the unity matrix of order . Thus, for each query item , its adherence to the class can be assessed through the Euclidean norm of the vector , which in turn corresponds to assessment and classification based on the logistic regression of the query item from the training classes [6].
2.4. Logistic regression method
The machine condition description from daily maintenance records/logs is a dichotomous problem (either normal or failed) which can be represented using a logistic regression function [1]. The goal of logistic regression is to find the best fitting model to describe the relationship between the categorical characteristic of dependent variable (the probability of an event, constrained between 0 and 1) and a set of independent variables. The logistic function is:
The logistic model is:
where is a linear combination of the independent variables .
The pre-condition for figuring out is determining parameters and in advance. Using the maximum likelihood method, estimation in logistic regression parameters is chosen [7]. Then, the probability of failure for each input vector can be calculated according to Eq. (11).
3. Experiment result
The methodology has been applied to evaluate the health condition of a hydraulic pump dynamically. In order to classify the possible root cause, the fault mode analysis was also performed.
3.1. Data acquisition system description
In the experiment, two commonly occurring faults in the hydraulic pump were set, namely, slipper loosing and valve plate wear. The vibration signal of the hydraulic pump was acquired from the end face with a stabilized 528 rpm motor speed and 1000 Hz sampling rate.
3.2. Feature extraction and reduction
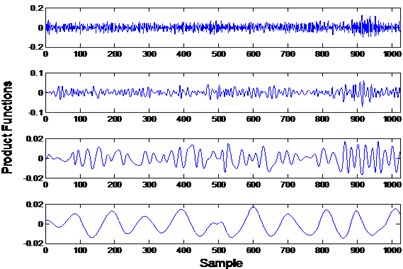
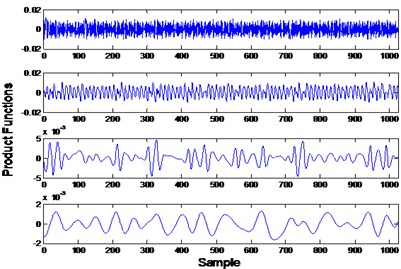
First, each vibration signal was processed by local mean decomposition to acquire the product functions. Fig. 2(a) shows the result of the local mean decomposition of the normal condition signal while Fig. 2(b) shows the result of the local mean decomposition of the signal under slipper loosing condition. Second, the skewness coefficients, the kurtosis coefficients and the normalized energy values of the product functions was calculated to form the feature vector. Then PCA was used to determine a subset of feature components. In this case, a 3-dimension feature vector was finally used for the health assessment and fault mode classification.
Fig. 2Local mean decomposition results of normal and slipper loosing condition
a)
b)
3.3. Logistic regression models training
3.3.1. Logistic regression model trained for health assessment
The training data contains 240 sets of data, including 80 sets of normal condition ( 0) data together with 160 sets of fault data (1). The parameters and estimated by the maximum likelihood method was eventually used to obtain the model for performance assessment as LR1.
3.3.2. Logistic regression models trained for root cause classification
Fault mode 1 (valve plate wear): 40 sets of valve plate wear data ( 1) versus 80 sets of normal data (0) were used to train the classification model (LR2) for fault model 1 using the maximum likelihood method;
Fault mode 2 (slipper loosing): 40 sets of slipper loosing data ( 1) versus 80 sets of normal data ( 0) were used to train the classification model (LR3) for fault model 2 using the maximum likelihood method.
3.4. Validation
For each fault mode, one set data of the hydraulic pump were used for validation.
Set 1 (fault mode 1): 40 sets of data under normal condition versus 80 sets of valve plate wearing data;
Set 2 (fault mode 2): 40 sets of data under normal condition versus 80 sets of slipper loosing data.
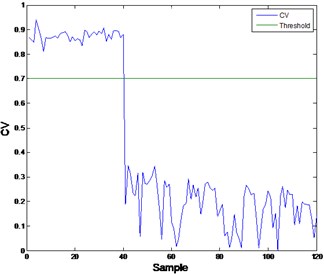
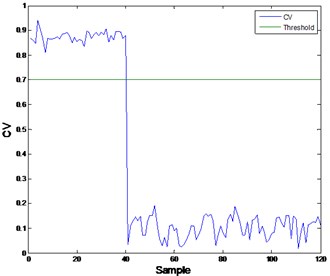
Fig. 3Health assessment result of two fault modes
a)
b)
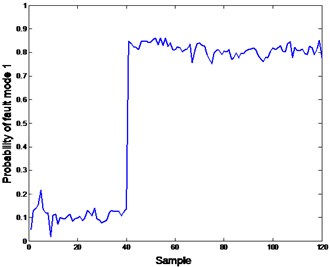
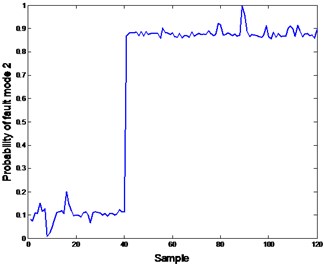
Fig. 4Probability of fault modes 1 and 2
a)
b)
The confidence value (CV) is defined as CV = 1 – where is the probability of failure. When the pump is running normally, CV is very close to 1. However when the pump is going to fail, the CV will approach 0 correspondingly. In the course of the CV falling, as long as the value is less than 0.7, a prefixed threshold, the fault mode classification model will be triggered to input the features into fault classification modes to get the probability of each fault. Fig. 3(a) and (b) shows the result of overall health assessment of the two sets vibration data of hydraulic pump using model LR1. Fig. 4(a) and (b) shows the different fault modes’ probability got from LR2 and LR3.
In Fig. 3, both faults can be detected from the CV drops, however, clarifying the difference and the reasons of the drops is still very hard. To solve this problem, a root cause classification module is used. As long as the confidence value is below 0.7, a prefixed threshold, the probability of fault modes will be calculated by inputting the corresponding features into the trained models (LR2 and LR3). In Fig. 4(a) and (b), the probability of fault 1 (valve plate fault) and fault 2 (slipper loosing) is very high from sample 40. Consequently the minor probability points of corresponding fault are showed in Fig. 4.
4. Conclusions
Health assessment and root cause classification of hydraulic pump based on logistic regression has been performed in this paper. LMD combined with PCA can obtain appropriate features from non-stationary signals. LR combined with maximum likelihood technique shows its potential as an effective and efficient tool for health assessment and root cause classification dynamically. The method can not only process non-stationary signals but also stationary signals which makes it generalized and can be applied to other vibration signals of pumps. However, more fault modes should be taken into consideration for better performance on hydraulic pump health assessment and root cause classification.
References
-
Frank P. M. Fault diagnosis in dynamic systems using analytical and knowledge-based redundancy – a survey and some new results. Automatica, Vol. 26, 1990, p. 459-474.
-
Gertler J. J. Survey of model-based failure detection and isolation in complex plants. IEEE Control Systems Magazine, Vol. 8, 1988, p. 3-11.
-
Wang Shaoping, Zhongkui Yuan, Guangqin Yang Study on fault diagnosis of data fusion in hydraulic pump. Chinese Journal of Mechanical Engineering, Vol. 16, Issue 4, 2005, p. 327-331.
-
Smith J. S. The local mean decomposition and its application to EEG perception data. Journal of the Royal Society Interface, Vol. 2, Issue 5, p. 443-454.
-
Cheng J. S., Shi M. L., Yang Y. Roller bearing fault diagnosis method based on LMD and neural network. Journal of Vibration and Shock, Vol. 29, Issue 8, p. 141-144.
-
Djurdjanovic D., Ni J., Lee J. Time-frequency based sensor fusion in the assessment and monitoring of machine performance degradation. International Mechanical Engineering Congress and Exposition, 2002.
-
Yan J., Lee J.J. Degradation assessment and fault modes classification using logistic regression. ASME Journal of Manufacturing Science and Engineering, Vol. 127, 2005, p. 912-914.
About this article

This research was supported by the National Natural Science Foundation of China (Grant No. 61074083, 50705005 and 51105019), as well as the Technology Foundation Program of National Defense (Grant No. Z132013B002).
