Abstract
This paper deals with issue of diagnostics of railway vehicle in operation. The principle of the diagnostics is based on dynamical response measurement during passing of the vehicle through measuring track section. Vibration of the rails and noise emission are recorded; the measured signals are subsequently analysed in time and frequency domain. Determination of failure symptoms in recorded signals in the course of running of the vehicle is the main aim of those analyses. Appropriate failure symptom in measured diagnostic signal corresponds to the specific vehicle failure. However this method is based on determination of a reference signal responds the running of a vehicle without any failure and development of database of failures with appropriate symptoms. This diagnostic principle is actually tested in operational conditions of Prague’s metro. For development of the diagnostic system, a range of measurements was carried out due to obtaining of several real responses of vehicle passing through the measuring track section. The paper contains also design of hardware a software part of the diagnostic system and first results of measurement analyses.
1. Introduction
This paper deals with issue of diagnostics of railway vehicle in operation. The principle of the diagnostics is based on vibration measurement of rails during running of a vehicle. Noise measurement of running vehicle is carried out together with the vibration measurement. This method is based on determination of reference signal corresponding to the running of a vehicle without any failure and development of database of failures with appropriate symptoms.
Presently this method is tested in operational conditions of Prague’s metro. For development of the diagnostic system, a range of measurements was carried out due to obtaining of several real responses of vehicle passing through a measuring track section.
2. Diagnostics of vehicle in operation
Measured dynamical response of a vehicle (vertical acceleration of rails and noise emission of a vehicle) is analyzed in time and frequency domain. Determination of vehicle failure symptoms in recorded signals is the main aim of these analyses. Specific failure responds an appropriate failure symptom of a measured diagnostic signal.
3. Signal analysis in time and frequency domain, utilization of FFT and CPB
The FFT analysis is used for determination of specific frequencies (basic frequency and harmonics) in a measured signal. This analysis is important in terms of diagnostics – each frequency responds specific part of a diagnosed object (e.g. gear box, bearing, traction equipment, etc.). The diagnostics principle is based on comparison of a frequency spectrum of a reference object (without any failure) and diagnosed object in operation. Utilisation of CPB analysis is suitable especially for acoustic signals.
Detection and localization of a failure (failure symptom) in a signal can be carried out by signal analysis with help of the discrimination function method [4] or neural network [5]. The symptom analysis principle is based on determination of a failure symptom in a diagnostic signal. For failure classification of a diagnosed object (vehicle), a list of possible failures is necessary to determine. Appropriate symptom in analysed signal is then assigned to each failure under consideration.
4. Description of measuring track section
A measuring track section shall comply with pre-determined parameters. Straight track with usually constant speed of vehicles and without any initial influences to vehicle dynamical response is the one of important condition for a measuring track section. A place for measuring device installation with possibility of remote measuring computer connection is the next important parameter. Acceleration sensors are situated on foot of rail in three measuring positions for both rails. In the middle measuring position, the microphones are situated too. Optical gates for time synchronisation of measured signal and running vehicle are situated in outer measuring positions. Distance between neighbour measuring positions is 1.2 m. Dynamical range of used acceleration sensors is 100 g, its frequency range is 1-20 000 Hz; sampling rate is set to 41 000 Hz.
Fig. 1Position of sensors in measuring track section
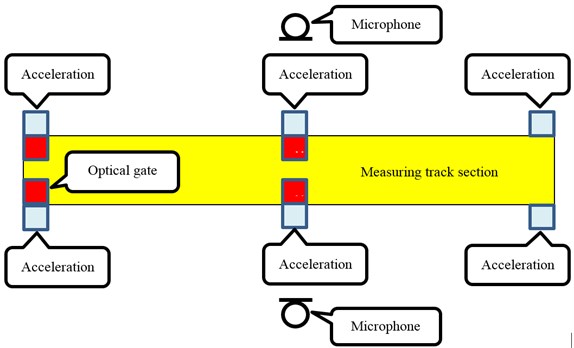
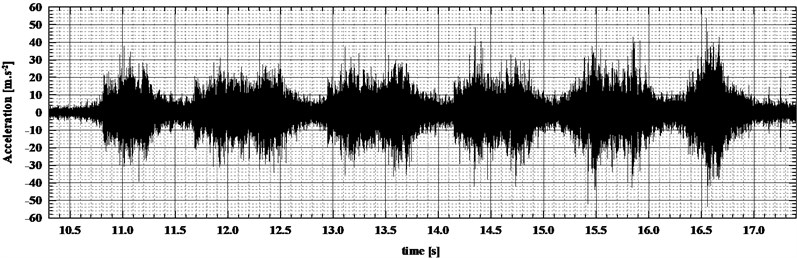
Fig. 2Passing of a whole trainset – signal of acceleration sensor
5. Measured data
Passing of each trainset is always recorded as a whole. The reference signal, which responds default state of trainset without any failure, will be recorded for each trainset type in its initial state. The principle of diagnostics wil be based on comparison of reference signals with actual measured signals in specific time period. Influence of trainset passing speed (which should be constant) will be taken into acount. If the measured signal exceeds a tolerance zone of the reference signal, the failure state will be detected and the failure localization will be carried out.
6. Principle of sub-section trainset analysis
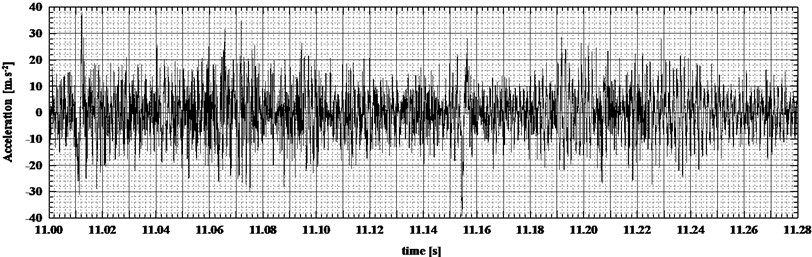
Due to possibility of exact failure localization, the evaluation of measured signals for each bogie or a wheelset is nessesary to carry out. Base on time synchronisation, appropriate section of signal (responds e.g. passing of a bogie) is selected from the signal of whole trainset passing. The Fig. 3 presents the signal responds passing of the first bogie of a trainset.
Fig. 3Passing of one bogie of trainset – signal of acceleration sensor
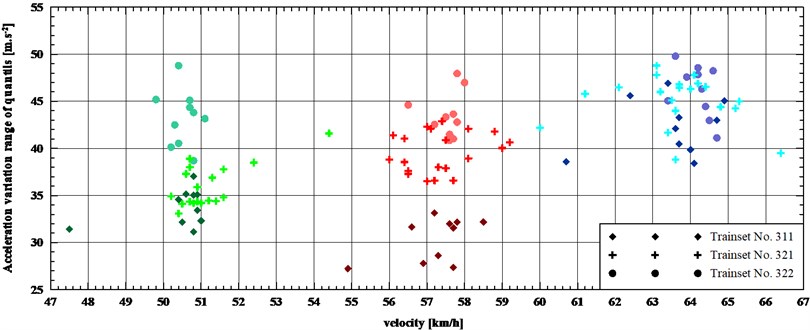
Analysis of acceleration signal in time domain is based on calculation of statistical parameters – maximum value, minimum value and 0.15 %, 99.85 %, 2.50 %, 97.50 % quantiles. After primary measured data analysis, 2.50 % and 97.50 % quantils were determined as the most suitable parameters for signal evaluation. The Fig. 4 presents evaluation of variation range of 97.50 % and 2.50 % quantiles for 10 passings of three trainsets. The difereneces between the values of different trainsets are noticeable. For practical application, the range responding the reference signal (passing of the vehicle without any failure) will be determined.
Fig. 4Acceleration variation range of quintiles (97.50 %-2.50 %) for three trainsets in three speed ranges
7. Frequency analysis of measured signal
Frequency analysis of a measured signal is carried out due to exact localization of a failure, it is carried out also for each bogie or wheelset and represented by FFT analysis until 3000 Hz. The example of FFT analysis for the first bogie of a trainset is shown in Fig. 5. In this frequency spectrum, the main frequency zone responds rail oscilation (about 700 Hz). Next spectrum parts responds specific structure parts of the vehicle bogie. Based on frequency assignment to sub-sections of a bogie, a localization of possible failure of a vehicle can be carried out. The similar analysis will be carried out also for acoustic signal of measuring microphones. In this case, the CPB analysis will be used.
Fig. 5Frequency analysis FFT (power spectrum) of acceleration sensor signal
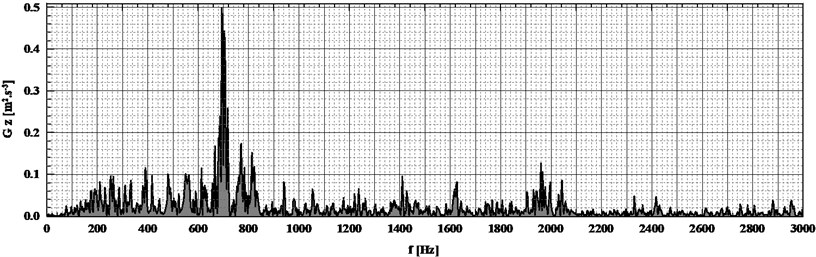
Table 1Expected tooth frequencies
Vehicle | 4141 | 4142 | 4261 | 4262 | 4263 | ||||||||||||||||
Bogie | 1 | 2 | 3 | 4 | 5 | 6 | 7 | 8 | 9 | 10 | |||||||||||
Axle | 1 | 2 | 3 | 4 | 5 | 6 | 7 | 8 | 9 | 10 | 11 | 12 | 13 | 14 | 15 | 16 | 17 | 18 | 19 | 20 | |
Dleft | mm | 817.5 | 820.2 | 817.9 | 817.9 | 826.9 | 824.3 | 825.9 | 823.0 | 811.8 | 815.0 | 819.0 | 818.0 | 819.3 | 820.3 | 819.0 | 816.0 | 818.0 | 814.9 | 820.6 | 818.5 |
Dright | mm | 817.4 | 820.1 | 817.9 | 817.7 | 826.9 | 824.2 | 825.8 | 823.0 | 811.7 | 815.0 | 818.8 | 818.3 | 819.2 | 820.4 | 819.0 | 816.0 | 817.9 | 814.7 | 820.8 | 818.5 |
Dmean | mm | 817.5 | 820.2 | 817.9 | 817.8 | 826.9 | 824.2 | 825.9 | 823.0 | 811.7 | 815.0 | 818.9 | 818.1 | 819.2 | 820.3 | 819.0 | 816.0 | 818.0 | 814.8 | 820.7 | 818.5 |
km/h | 52.4 | 54.2 | 55.4 | 57.7 | 58.4 | 60.6 | 61.3 | 63 | 63.2 | 66.6 | |||||||||||
m/s | 14.6 | 14.6 | 15.1 | 15.1 | 15.4 | 15.4 | 16.0 | 16.0 | 16.2 | 16.2 | 16.8 | 16.8 | 17.0 | 17.0 | 17.5 | 17.5 | 17.6 | 17.6 | 18.5 | 18.5 | |
Hz | 697.1 | 694.8 | 720.7 | 720.8 | 728.6 | 731.0 | 759.8 | 762.5 | 782.5 | 779.3 | 804.8 | 805.6 | 813.8 | 812.7 | 836.6 | 839.6 | 840.3 | 843.6 | 882.6 | 884.9 | |
8. Example of identification of failure symptom
Noise and vibration of a gearbox is a characteristic phenomenon for tractive vehicles. Frequency of this symptom is depended on velocity, wheel diameter and number of gear wheels teeth. Amplitude of this symptom is depended on traction force and it is especialy influeced by technical state of the gearbox.
Tooth frequency is calculated with help of number of teeth of main gear wheel , a vehicle velocity and a vehicle wheel diameter :
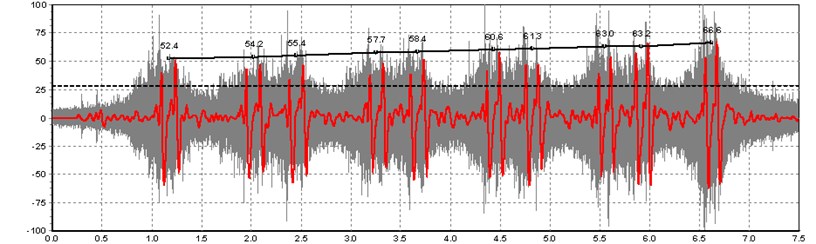
Each vehicle wheel diameter can be obtained from records of regular maintanance. For evaluation, the signal of acceleration must be filtered. In this case the filter Butterwoth, bandpass 2-20 Hz order 2 was used (see Fig. 6).
Fig. 6Passing of whole trainset; original and filtered signal; velocity curve of bogies
Expected tooth frequency will determine the frequency zone for evaluation of signal amplitude. Selected frequency zone is depended on velocity of evaluated bogie and on the bogie wheel diameter. In time of appropriate gearbox passing, the FFT analysis is carried out, technical state of gearbox is evaluated from amplitude of FFT spectrum in selected frequency zone (see Fig. 7). FFT spectrum is calculated from original unfiltered signal.
Fig. 7Values of FFT amplitude, all axles of one trainset (9 passes)
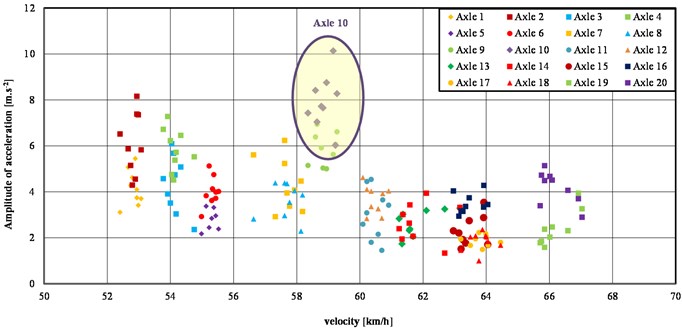
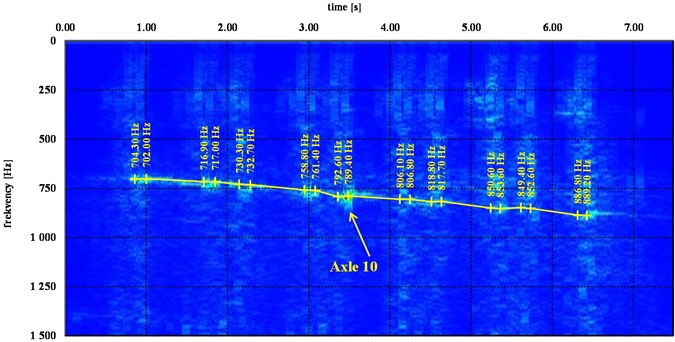
Fig. 8Spectrogram, one passing of trainset No. 321
9. Conclusions
The paper presents a possibility of solution of diagnostics of railway vehicle in operation with concerning to its bogie parts. Analyses of carried out measurenmets indicates a possibility of real aplication of this system. Measured signal is analysed in time domain considering defined tolerance zone of reference signal at the first and then it is analysed also in frequency domain. By using FFT and spectrograms, the important frequencies responding natural frequencies of specific parts of a bogie are detected in signal. The possibility of automatization of measured data analyses will be the next stage of development of this diagnostic system.
References
-
Smetana C. Noise and Vibration. First Edition, MMT, Prague, 1998.
-
EN ISO 3095. Acoustics – Railway application – Measurement of noise emitted by railbound vehicles, 2014.
-
Hába A., Musil M., Vágner J., Richter M. Measurement of external noise of electric unit “Regiopanter” in track section Pardubice – Hradec Králové. Technical Report, CKDV, Česká Třebová, 2013.
-
Kreidl M. Diagnostic Systems. First edition, ČVUT, Prague, 2006.
-
Bíla J. Factitious Intelligence and Neural Networks in Application. Second Edition, ČVUT, Prague, 1998.
-
Moravčík M. Track Mechanics – Parts 1, 2 – Theoretical Analysis and Simulation Track Mechanics Problems. First Edition, EDIS, Žilina, 2002.
-
Moravčík M. Dynamic behavior of railway track – experimental measurements. Communication, Vol. 3, 2002, p. 17-26.
About this article

This work was solved in framework of the project TE01020038 “Competence Centre of Rail Vehicles” of the Technology Agency of the Czech Republic. Attendance on the conference was financially supported by the European Project ESF CZ.1.07/2.3.00/20.0176 “IRICoN”.
