Abstract
In the article the results of the preliminary vibroacustic research and the stereometry examination of the surface of ball bearings used in the timing belt tensioner pulley of cars were presented. For comparative purposes the research was performed for the group of newly manufactured bearings and for the group of bearings after 110 thousand km mileage of the car. The analysis of the wear process of the rolling bearing elements was showed and also the theoretical study of the vibrations generated during a work of bearing-shaft coupling was discussed. The vibration signal components characteristic for the shaft and the elements of a bearing were described and estimated according to a review of literature. In the article the research program and experimental details of the preliminary signal vibration measurements were explained. The vibration tests (curves of instantaneous values of vibration acceleration during time) were carried out with industrial unit CSI 2130 by Emerson and with accelerometer A0760GP for new bearings and bearings after long operation. The amplitude-frequency signal spectrums were recorded for both group of bearings at the same work conditions, than compared between each other and with calculated characteristic theoretical signal components. During the project the laboratory investigation of the rolling bearings surface stereometry was also conducted. The results revealed the occurrence of the following wear processes: abrasive wear, adhesion-abrasive wear, pitting on the surface of the rollers mating with the bearing race, corrosion wear and also fretting in place of permanent connection. Based on the preliminary research of the rolling bearings used in the timing belt tensioner pulley it was assumed that vibrations spectrum for new bearings and after operation were significantly differed. It confirmed the used test equipment and the methodology of the laboratory tests had sufficient sensitivity and could be applied to the reliability research of other types of rolling bearings at the test stand and could be also used to estimate a key goal and range of the further research projects.
1. Types of wear processes and damages of the rolling bearings
The most basic wear process in heavy loaded rolling bearings with standardized or quenched and tempered races is deformation wear occurring through plastic flow of the bearing race material. The possible types of the ball bearings elements damage are: – running-in or streak wear on the surface and side surface, – peeling of the race and of the rolling bearing surface , – cracks in the outer or inner rings, in the rolling elements or basket, indents on the surface of a roller and rolling elements, – abrasive-corrosion wear, – jamming, – scorching, – pitting, fretting, – corrosion on the surface of the seized elements and inside of a bearing [1].
2. The research object
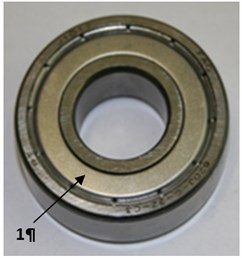
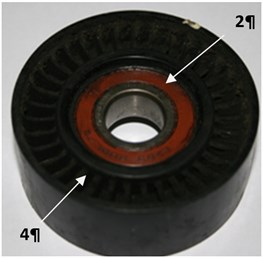
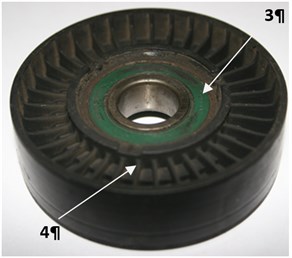
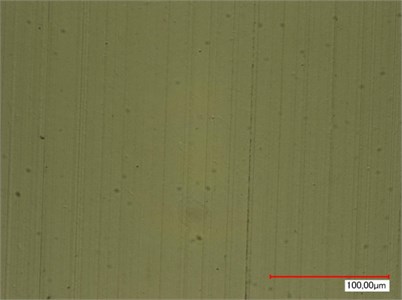
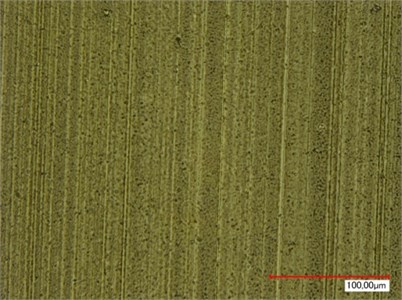
The object of the research were two groups of bearings: newly manufactured and after 110 thousand km. Fig. 1. The characteristic surface stereometry of the ball rolling bearing after operation at about (110 thousand km mileage of the car) is presented in Figs. 5-7. The bearing is used, among others applications, in the timing belt tensioner pulley of cars. The presented microscopic views of the inner and outer race surface confirmed that the processes of wear were characteristics for abrasive, adhesion-abrasive wear and for pitting.
Fig. 1Image ball rolling bearings and drive belt tensioning rollers (4) of a car engine timing: a) bearing a new one, b), c) bearings on exploitation 2 and 3
a)
b)
c)
Fig. 2The microscopic view of the race surface of the newly manufactured ball rolling bearing: a) and after exploitation – 110 thousand km b) in different area surface of the treadmill rolling
a)
b)
3. Experimental details of the vibration signals research
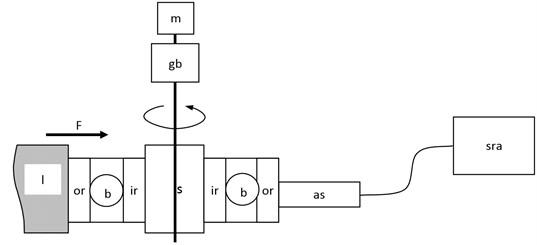
The measurement of the rolling bearing vibrations was performed at the two testing stands. The first testing stand was propelled by high power electric motor combined with the 12 speed gearbox. That design solution was chosen because of the usefulness and availability for the main part of the research program, i.e. durability tests. However, it was also chosen with the full knowledge the design of the test stand could be a source of essential disturbances of vibration signal measurements (each coupling of gears in the gearbox is a source of its own vibration signal, transmitted through the whole body of the stand and mixed with the other vibration signal disturbances and with the signal from the tested rolling bearing). There was no technical possibility to separate the vibration signal disturbances from the tested bearing signal and therefore the vibration spectrum analysis for the first testing stand was mainly carried out observing the vibration signal of the tested bearing and its changes for increasing load. However, at this stage of the study, the observed changes in the vibration signal for sequentially load change were not analyzed to find out what was the direct cause of the achieved differences, leaving this issue for any further research. The simplified scheme of the test stand is showed in the Fig. 3.
The second test stand was propelled with the low power electric motor at the rotational speed adjusted with the current transformer. That design solution was also chosen because of the usefulness and availability for the vibration signal research and with the full knowledge that use of low power motor in the program prevented higher loads of the tested bearings. The scheme of the second test stand is similar to the presented in the Fig. 1, but without the gearbox.
Fig. 3The scheme of the first test stand: m – electric motor, gb – gearbox, s – shaft, l – lock, F – load acting on the bearing ir – inner ring of the bearing, b – rolling element of the bearing, or – outer ring of the bearing, as – acceleration sensor, sra – recorder and signal analyzer
Two rolling bearings of the timing belt tensioner pulley of the car engine were examined – first brand new and second removed from a car after 110 thousand km mileage. The inner rings of the bearings were mounted on the shafts of the power sources. The outer rings of the bearings were immobilized by locking mechanisms enabling loading of the bearings with force 43 and 77 N (first test stand) or 5 N (second test stand).
Literature review of the sliding bearings [1-5] showed that characteristic frequencies for the bearings are:
– Frequency of the outer surface failure:
– Frequency of the inner surface failure:
– Frequency of the rolling element damage:
– Frequency of a ball cage failure:
where: – the number of rolling elements, – diameter of a rolling element, – pitch diameter of a bearing, – angle of a bearing (measured between a surface of a bearing and diamater of rolling elements connecting the points of contact with the raceways), for the non-thrust bearings 0, – frequency of relative rotation of a bearing race with one immobilized ring – frequency of bearing shaft rotation.
For the chosen bearings 8, 6,8 mm, 29 mm, 0, what resulted in:
Unfortunately the multiplieres of the rotation frequency of the bearing shaft were not their integer multiples of each other or integral multiples of another value. As the result it was difficult to select the parameters of the shaft rotation analyzer in order to to adjust all frequencies to the integer multiples of the obtainable resolution for the measurement of the spectra obtained.
The measurements were performed with equipment Emerson CSI 2130 cooperating with unidirectional accelerometer A0760GP. The sensor was fixed with permanent magnet to the outer ring of the tested bearing and vibration acceleration in a surface perpendicular to the axis of the bearing was measured. Among the possible settings of the instrument to execute fast Fourier transform (FFT) of the achieved signal it was decided to record spectrums with a step 0.09375 Hz in the range of 0-600 Hz for the first test stand working at rotational speed of 180 rpm. For the second test stand operating at the rotational speed of 1200 rpm the parameters were consequently 0.625 Hz for a step and 0-4 kHz for a measuring range (for both stands the value is the 32 spectral line). For each kind of test (different stands, load and bearing) a vibration signal was recorded three times and their amplitude spectra were completed. As it was revealed they were comparable.
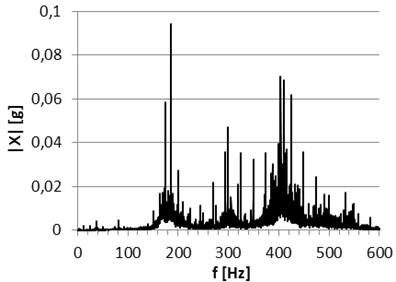
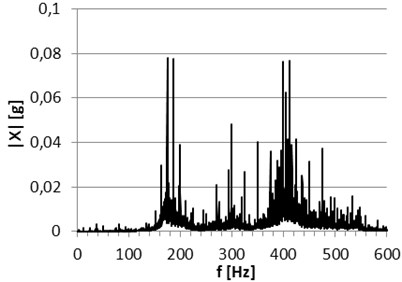
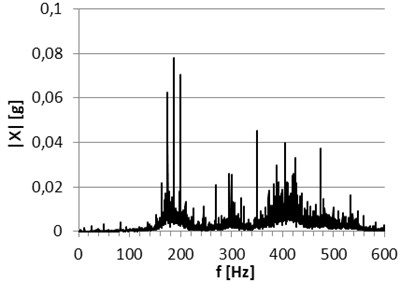
Fig. 4Comparison of achieved signal spectrums recorded at the first test stand for lower load (upper figures) and higher load (bottom figures) of the new bearing (left column) and the bearing after operation (right column)
a)
b)
c)
d)
In the Fig. 4 chosen examples of the recorded signals at the first stand are presented. It is clearly seen that vibration signals consist of a whole range of components of the strongest in the considered frequency range are the components of frequencies about 155, 186, 200, 300, 350, 404, 411, 424, 474 and 532 Hz. However, at this stage of the research program the components were interpreted as disturbances of a signal from power unit, as clearly with the tested bearing operation could be linked only small components of frequency about 2.9 () and 11.6 and 81.6 Hz (1 and 7 ). At this stage of the research program the recognized differences between spectrums could be specified as: – the presence of the strong component of a frequency about 200 Hz in the spectrums recorded only from the signals of the bearing after long mileage, – the presence of the clear components of a frequency about 375 and 450 Hz in the spectrums recorded only from the signals of the new bearing (in the range of 300-500 Hz with other components they create a sequence of the strong components differed from each other about 25 Hz), – the presence of the clear component of a frequency about 532 Hz in the spectrums recorded only from the signals of the bearing after long mileage.
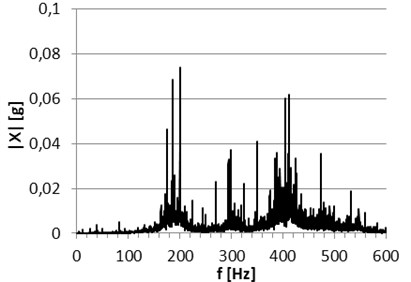
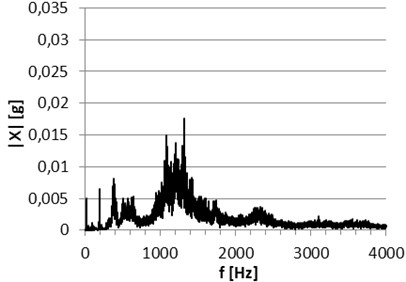
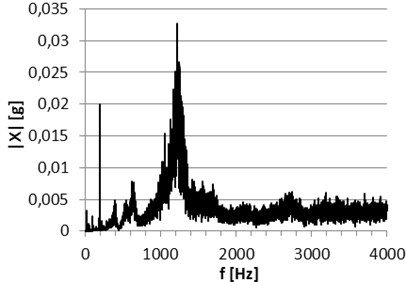
In the Fig. 5 chosen examples of the signals recorded AT the second test stand are presented. It is clearly seen that vibration signals are composed of the whole range of components of the strongest in the considered frequency range are the components of frequencies about 20 and 200 (1 and 10 ) and about 390 Hz and within the range 500-700, 1000-1350 Hz. At this moment of the preliminary research the last mentioned components were interpreted as disturbances from the power unit. Additionally, large noisy signals are observed above 400 Hz. The differences between spectrums at this preface research could be observed for the strong gain of the components of a frequency about 200 and 1225 Hz, significant weakening of the signal component of a frequency about 1318 Hz and large noisy high frequency part of the signal for the measurements of the bearing after operation. Comparing the results from Figs. 4 and 5 it is also noticeable considerably 3 times lower vibration level measured at the second test stand due to the lack of interference generated in the gearbox of the first test stand.
Fig. 5Comparison of achieved signal spectrums recorded at: a) the second test stand of the new bearing and b) the bearing after operation b)
a)
b)
4. Conclusions
1) Laboratory tests showed the presence of the following types of wear: abrasive wear, abrasive-adhesive, wear by pitting present on the surfaces of the rollers cooperation with treadmills, corrosive wear and wear by fretting at the place of connection.
2) The observed variations between vibration signals recorded for the rolling bearings of differed mileage showed clearly indicate the possibility of distinguishing them on the basis of their own vibration signal.
3) Applied first test stand with high power electric motor and mechanical gearbox, useful to perform tribological durability test, was not fully valuable to complete the research of vibration signals of the tested rolling bearings, as the presence of strong disturbance generated by power unit. More helpful appeared to be the second test stand with adjustable rotational speed. In the course of further work it is planned to build a test stand with regulated rotational speed and propelled with high power electric motor and with the possibility of accurate long-term sustain of the selected speed even for high loads, which will allow the study of large-size bearings, for example used in rail transport.
References
-
Napadłek W. Analysis of tribological processes in components of massive roller bearings. Solid State Phenomena, Vols. 220-221, 2015, p. 319-323.
-
Cempel Cz. Vibroacoustic diagnostics of machines. University of Technology, Poznań, Poland, 1985, (in Polish).
-
Machine Condition Monitoring. Brochure BR0267-13, Bruel & Kjaer, Naerum, 1989.
-
Thorsten Kacsich, Peter Werner Gold, Jörg Loos Low friction W-C:H coatings for wear resistance in roller bearings. MRS Proceedings, 2001.
-
Khalid Ait Sghir, Fabrice Bolaers, Olivier Cousinard, Jean-Paul Dron Vibratory monitoring of a spalling bearing defect in variable speed regime. Mechanics and Industry, Vol. 14, 2013, p. 129-136.
About this article

Scientific work financed by the National Centre for Research and Development as the research project No. BS1/B5/1/2012.
