Abstract
A method of combining autocorrelation function with cyclostationary theory and Hilbert envelope analysis is proposed and applied to extract characteristic frequency of rolling bearing. Meanwhile, mean power ratio is calculated and used to identify the fault types of aero-engine rolling bearing based on single-channel casing vibration signal. To verify the effectiveness of proposed method, a comparing analysis is carried out between traditional studies and proposed new method. Furthermore, the influences on the extraction of characteristics and calculation of mean power ratio are taken into account, including the ones of sensor installation position, fault types, type of experiment rigs, failure mode and rotational speed of rolling bearing. The result shows that the proposed method can diagnose running conditions and identify fault types of rolling bearing accurately and effectively just by single-channel casing vibration signal.
1. Introduction
State monitoring of large-scale rotating machinery, like aero-engine, is usually based on casing signal due to inconvenience of disassembly and limitation of structure. The rolling bearing inside casing is one of key components of aero-engine. A robust condition monitoring method for rolling element bearings which employ a novel empirical mode decomposition and discrete wavelet packet transform was proposed, and the results show that the proposed method outperforms the conventional schemes by achieving up to over 23 % higher mean-peak ratio values [1]. A general overview of various conditions monitoring and fault diagnosis techniques for rolling element bearing in current practice was discussed [2]. Appropriate intrinsic mode functions were used for envelope analysis in multiple fault diagnosis of ball bearing [3]. The studies for rolling bearing are wide, while most researches concentrate on bearing chock signal rather than casing signal at present. The casing vibration signal is far weaker and more complicated than bearing chock signal as it comprehensively reflects the situations of many parts, combined with energy attenuation, noise effect and signal distortion [4]. All these lead to a great difference between theoretical study and practical application research and increase the difficulty of extracting rolling bearing fault characteristics from casing signal.
The symmetrical or approximately symmetrical physical construction and rotate mode, which determines casing signal of aero-engine, has the characteristics of cyclostationary process. Fault characteristics of rolling bearing can be studied in the frame of cyclostationary theory [5]. Cyclostationary theory was introduced to signal and information processing in the last two decades and studied in the fault diagnosis of rotating machine. The representative study of cyclostationary theory is from Antoni [6]. To analyze the fault of rolling bearing, Randall and Antoni et al. [6] combined envelope analysis with cyclostationary theory, in considering the relationship between spectral and envelop analysis for cyclostationary signal. To process real cyclostationary signals, a comprehensive methodology was proposed [5]. Meanwhile, in order to study convolution mix blind separation algorithm, blind separation algorithm was combined with cyclostationary theory [7]. Higher-order cyclic statistics theory was applied to the diagnosis of rotating machine fault [8]. The wavelet filter and cyclic stationary level method were combined and used to identify the early fault of rolling bearing [9]. Early fault of gear and bearing was judged by second-order cyclic spectrum slice method [10]. Based on chirplet path pursuit and order cyclostationary demodulation, a diagnosis method of roller bearing fault was proposed [11]. Statistical test was introduced for cyclostationary, and meanwhile, the correctness of proposed method was analyzed and verified by means of experimental vibration data of rolling bearing [12]. The second-order of cyclostationary was utilized to detect and diagnose fatigue damage of the stainless steel based on vibration signal [13]. Applied study of cyclostationary theory of the faults diagnosis in rolling bearings has been improved greatly by scholars around the world. As casing signal is far weaker and complicated than bearing chock signal, it is difficult to achieve a satisfying result by cyclic statistics alone. Meanwhile, the cyclic frequency is a mapping of original signal frequency, which results in the presence of some additional frequency components in cyclic frequency domain, which are otherwise not present in original signal frequency. All these factors make it more difficult to apply cyclostationary theory to rolling bearing fault diagnosis in real aero-engine. Autocorrelation function is able to reduce noises and remain the periodicity of signal, and meanwhile convert frequency modulation signal to amplitude modulation signal which usually exists in trouble signal of rolling bearing of aero-engine [14]. The complex envelope of signal can be acquired from Hilbert transformation which is free from regular vibration components. From the above consideration, a way of combining autocorrelation function of signal, Hilbert envelope analysis and cyclostationary theory was proposed and verified in this paper for monitoring running states and identifying fault types of rolling bearing of aero-engine according to extracted feature frequency or calculation of mean power ratio. Meanwhile, the influences on the extraction of characteristics and calculation of mean power ratio are considered including the ones of sensor installation position, failure type and rotational speed.
2. Theoretical analysis
2.1. Second-order cyclic statistics: cyclic autocorrelation function
A time-continuous signal is defined, then , the autocorrelation function of continuous such that:
where, , and * is respectively delay factor, statistical mean value and conjugate. has cyclostationary feature, if is a periodic function of time . In view of is a period function and can be acquired by means of Fourier series expansion:
, and respectively represent cycle frequency and autocorrelation function period, and then the Fourier transform coefficient can be shown:
is cycle-autocorrelation function of as cycle frequency is equal to .
Given an amplitude-modulated signal :
and is respectively the value of amplitude of carrier signal and modulating signal. and is respectively carrier frequency and modulation frequency. We can also conclude:
It can provide Eq. (6) according to Eqs. (3-5):
It is very clear that cycle-autocorrelation function doesn’t equalize to zero when and only when cycle frequency , , , , and , while represents stationary signal. Suppose one value, which is not equal to zero, is designated, and the slice signal of cycle- autocorrelation function is analyzed by given value, the fault characteristics can be extracted and calculated by obtaining modulation spectrum of slice signal.
2.2. Characteristic frequency of rolling bearing
As the characteristic frequency of bearing fault is in one-one correspondence to fault type, this relation can be applied to recognize fault types and monitor running conditions of rolling bearing.
Pitch diameter is , rolling element numbers , diameter , rotational speed and contact angle equal to 0°. represents the rotation frequency. The feature frequency of rolling bearing can be expressed in the following.
Retainer rotating frequency is:
Ball element rotation frequency is:
Ball element passing by outer ring frequency is:
Ball element passing by inner ring frequency is:
2.3. Mean power
The mean square value represents the mean power of signal in engineering, and can be used to identify and estimate the vibration intensity of signal.
A vibration signal and its Fourier transform is defined, and then the mean square value is mean power of such that:
where represents the length of . Suppose a frequency band is given, then the mean power of this frequency band can be calculated according to Eq. (11). Meanwhile, the mean power ratio of different selected frequency band can be shown as follows:
where , , , respectively represents the staring and end points of different selected frequency band of , and is mean power ratio of different selected frequency band.
3. Rolling bearing fault experiment
The data in the paper comes from the aero-engine compressor rotor experiment rig and aero-engine rotor experiment rig, and meanwhile the faults of outer ring, rolling element (corresponds to the aero-engine compressor rotor experiment rig) and inner race (corresponds to aero-engine rotor experiment rig) of rolling bearing were considered. The rotational speed was measured by SE series eddy current displacement sensors. The casing vibration acceleration signal was collected by the acceleration sensors Model 4508, which is provided by Demark Brüel&Kjær, and data collector Model is USB9234 provided by National Instruments., , , and is respectively used to represent rotational frequency, retainer characteristic frequency, rolling elements characteristic frequency, outer ring characteristic frequency and inner ring characteristic frequency of rolling bearing in the paper.
3.1. Aero-engine compressor rotor experiment rig
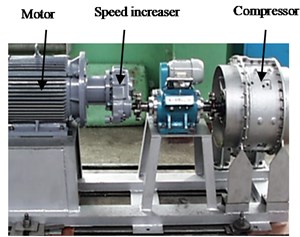
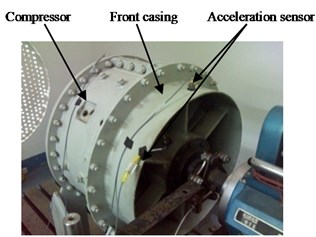
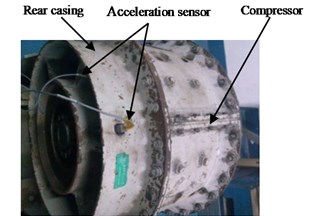
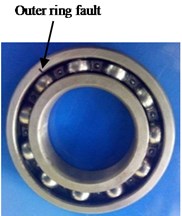
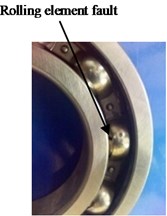
Aero-engine compressor rotor experiment rig is composed of roller bearing, two-stage disc, working-blade and rolling bearing etc., as shown in Fig. 1(a); experiment rig rotation is embodied by motor driver and gear, and bearing lubrication in speed increaser is carried out by oil splash. The stator of compressor is made up of circular cowling, working-external-ring, front case, center case, and rear case. The central case is divided into two parts, left and right, along with vertical plane. The compressor rotor experiment rig can be used to simulate compound and weak fault of rolling bearing involving retainer, ball element, outer ring and inner ring. In this study, the fault occurring in the outer ring and rolling element of rolling bearing is firstly carried out by aero engine compressor rotor experiment rig. Rolling bearings are damaged by spark wire cutting method, and cutting measurement is 0.2 mm. The fault bearings are installed in the bearing chock in lower part of casing. The vibration acceleration sensors are installed on front casing, rear casing and low bearing chock in order to compare and analyze the difference between bearing chock signal and casing signal. Installation positions of vibration acceleration sensors are provided in Fig. 1(b) and Fig. 1(c). Outer ring and rolling element fault of bearing are respectively shown in Fig. 1(d) and Fig. 1(e). The specific geometry parameters of rolling bearing are shown in Table 1.
Fig. 1a) Aero engine compressor rotor experiment rig, b), c) sensor installation position, d) and e) is separately outer ring fault and rolling element fault of bearing ball
a)
b)
c)
d)
e)
Table 1Geometric parameter of aero-engine compressor rotor experiment rig rolling bearing (units: mm)
Fault types | Rolling element diameter (mm) | Bearing diameter (mm) | Ball numbers |
Outer ring | 17.5 | 97.5 | 11 |
Rolling element | 10.3 | 70.2 | 15 |
3.2. Aero-engine rotor experiment rig
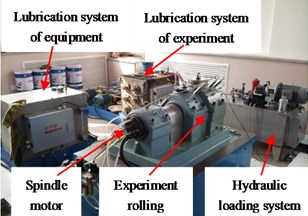
The aero-engine rotor experiment rig and bearing invalidation monitor system experiment rig is respectively designed by the Shenyang Aero-engine Design Institute and Luoyang Bearing Research Institute of China. The aero-engine rotor experiment rig core-engine is simplified to be a 0-2-0 support structure, and the compressor is simplified to be a single disk structure, and the fault bearing is installed inside aero-engine rotor experiment rig. In order to simulate the natural invalidation process of rolling bearing, a rolling bearing, model 6206 was damaged through accelerate-fatigue test by bearing invalidation monitor system experiment rig which is composed by body, power and transmission system, lubricating system, hydraulic loading system and electrical system, etc. The aero-engine rotor experiment rig and invalidation experiment monitors system of rolling bearing is respectively shown in Fig. 2(a) and Fig. 2(b).
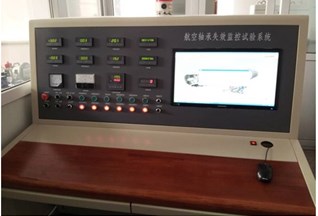
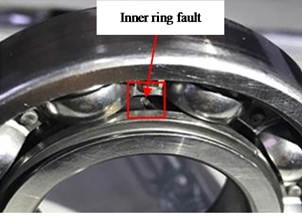
In the process of accelerate-fatigued experiment, the vibration signal is real-time collected and monitored by BLES bearing invalidation monitor and life assessment system shown in Fig. 2(c).The oil data is also real-time monitored by OWA-2012 oil detection system. Fig. 2(d) shows the model 6206 bearing with a damaged inner ring. The specific geometric parameter and multiple relationships between rotation frequency and characteristic frequency of Model 6206 rolling bearing are shown in Table 2. The rotation speed is about 12000 r/min, and the specific steps of accelerate-fatigue experimentation are as follows:
1) A one-hour lubricate experiment was implemented and normal data collected from rolling bearing when experiment lubrication was switched on. The consistence of lubrication state among bearings needs to be guaranteed before oil supply system is switched off.
2) The experiment lubrication system was switched off, and the dry friction experiment of rolling bearing was implemented until system protection was activated in order to accelerate the bearing degeneration.
3) The step 1 and step 2 was repeated until experiment finished.
Fig. 2Experiment equipment for a) corresponding with aero-engine rotor experiment rig, b) corresponding with bearing invalidation monitor system experiment rig, c) corresponding with bearing invalidation monitor and life assessment system and d) corresponding with damaged inner ring fault rolling bearing by accelerate-fatigue experiment
a)
b)
c)
d)
Table 2Geometric parameter of Model 6206 rolling bearing (units: mm)
Type | Thickness | Outer ring diameter | Inner ring diameter | Rolling element diameter | Pitch diameter |
6206 | 16 | 62 | 30 | 9.5 | 46 |
4. Characteristic extraction of rolling bearing
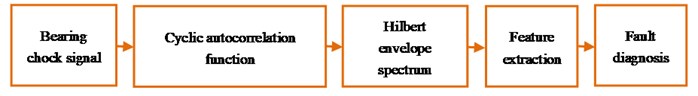
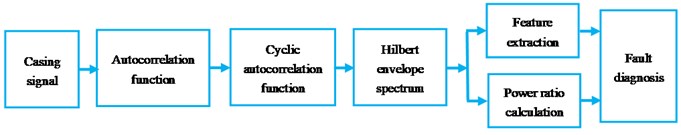
During the fault, the amplitude of vibration signal was modulated by characteristic frequency which is corresponding with failures categories of rolling bearing. That is, is equalized to fault feature frequency in accordance with failure types in Eq. (6). Therefore, can be given the value equal to characteristic frequency of rolling bearing or twice to monitor the running state of bearing and identify its fault type. Based on the above consideration, a method combining cyclostationary theory with autocorrelation function and Hilbert transform is proposed and used to extract fault characteristic frequency of rolling bearing. Meanwhile, the mean power ratio (between fault characteristic frequency band and total low-frequency band according to Eqs. (11-12) was calculated and used to identify fault types of rolling bearing. Specifically, conventional research method was applied to extract rolling bearing characteristic frequency combining cyclostationary theory with Hilbert envelope analysis, as shown in Fig. 3(a). The proposed new method in this paper is shown in Fig. 3(b).
Fig. 3a) Conventional research method at present-scheme A and b) proposed new method-scheme B
a)
b)
Comparing with Fig. 3(a) and (b), the differences are noticeable and shown as follows:
1) The casing vibration signal instead of bearing chock signal is studied and analyzed in new method.
2) The autocorrelation function is applied to reduce noise and combined with cyclostationary theory in new method.
3) Besides the fault characteristics, calculation mean power ratio can also be used to monitor running conditions and identify fault types of rolling bearing.
4.1. Rolling bearing characteristics extraction: scheme A
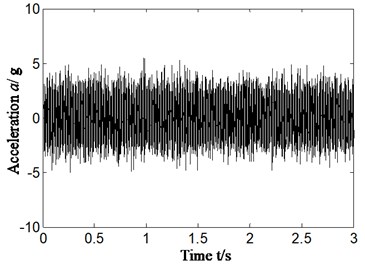
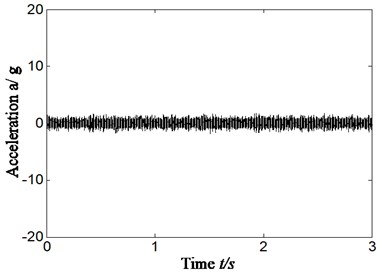
Due to symmetric or approximately symmetric physical structure and rotation mode, the rolling bearing of aero engine has 2-order cyclostationary features and its characteristics can be studied and extracted by cyclic autocorrelation function [5]. Bearing chock and casing vibration acceleration signal is collected synchronously for comparative analysis in this paper. All time-domain signals are in second and vibration acceleration in g; 1-4 of abscissa respectively represent characteristic frequency-band of rotational speed, rolling element, outer ring and inner ring in this paper.
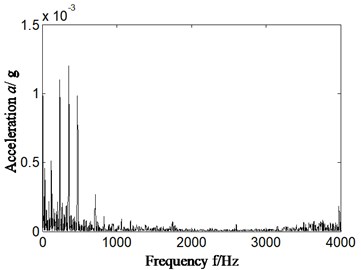
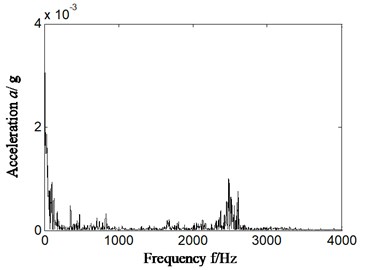
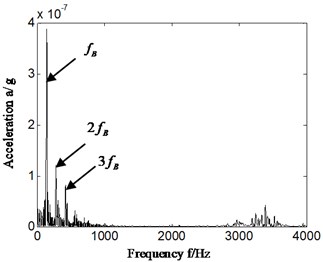
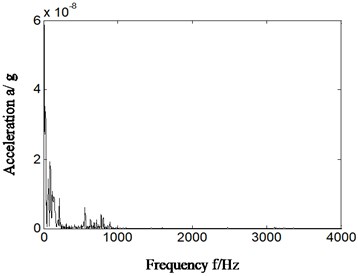
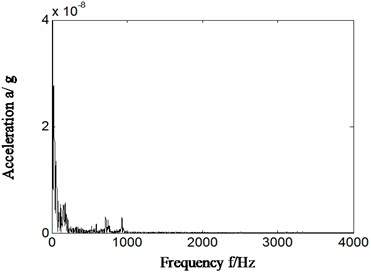
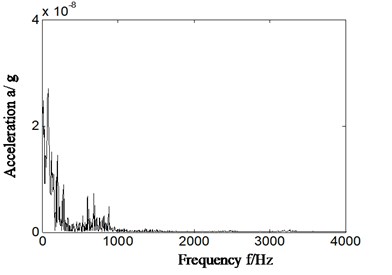
First of all, outer ring fault experiment of rolling bearing (corresponds with aero-engine compressor rotor experiment rig) was carried out and vibration acceleration signal collected from rear casing and lower part of bearing chock were studied. The rotational velocity is about 1826 r/min and rotation frequency is 30.4 Hz (1826/60 = 30.4). The characteristic frequency of outer ring, inner ring, ball element and retainer is respectively 139.6 Hz, 195.4 Hz, 89.2 Hz, and 12.7 Hz, which is calculated by Eqs. (7-10). The specific results are shown in Fig. 4. Fig. 4(a1) and (b1) are time-domain signal. Fig. 4(a2)-(a3) and Fig. 4(b2)-(b3) is the Hilbert envelope spectrum of slice signal of time-delay in cyclic frequency equal to outer ring characteristic frequency and its local amplification. Fig. 4(a1)-(a3) is corresponding to bearing chock signal, and Fig. 4(b1)-(b3) is corresponding to rear casing signal.
In Fig. 4(a1) and Fig. 4(b1), the time domain of acceleration signal is similar between casing and chock signal. When analyzing Fig. 4(a2)-(a3) and Fig. 4(b2)-(b3), it can be concluded that the features of Hilbert envelope spectrum of time-delay slice signal have obvious difference between bearing chock signal and casing signal.
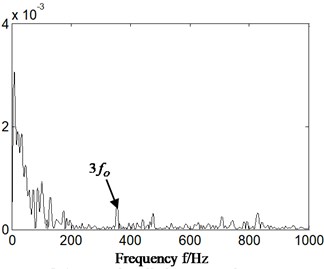
In Fig. 4(a2)-(a3) bearing chock signal, there is obvious outer ring fault feature frequency, and fault types of rolling bearing can be identified correctly and effectively.
However, in Fig. 4(b2)-(b3) rear casing signal, there is no obvious outer ring fault characteristic frequency. That is, it cannot identify the outer ring fault occurrence of rolling bearing based on casing vibration signal based on conventional research method at present (as shown in Fig. 3(a)).
Namely, the difference is significant between bearing chock signal and casing signal. Generally, it is difficult to obtain direct bearing chock signal of large-scale rotation machine like aero-engine as it is limited by structure, and even impossible to realize. The condition monitor is only carried out according to casing signal, which often leads to error diagnosis and omission diagnosis due to the weakness and complexity of casing signal. Therefore, it is extremely important to precisely monitor the state of rolling bearings inside aero-engine and identify a fault type based on casing vibration signal within the framework of cyclostationary theory.
Fig. 4a1) and a2) the time domain of acceleration signal, a2)-a3) and b2)-b3) the Hilbert envelope spectrum of slice signal of original signal – cyclostationary frequency is equal to bearing outer ring characteristic frequency
a1) Sensor installation bearing chock
b1) Sensor installation rear casing
a2) Sensor installation bearing chock
b2) Sensor installation rear casing
a3) Sensor installation bearing chock
b3) Sensor installation rear casing
4.2. Casing vibration signal characteristic extraction: scheme B (as shown in fig. 3(b))
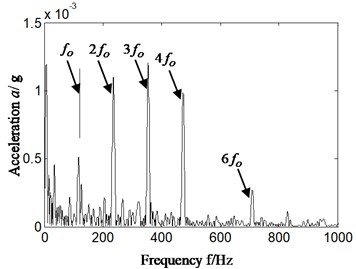
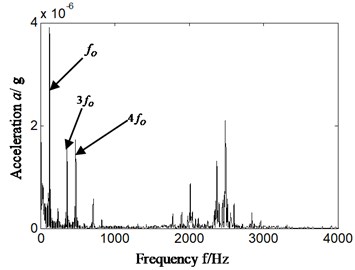
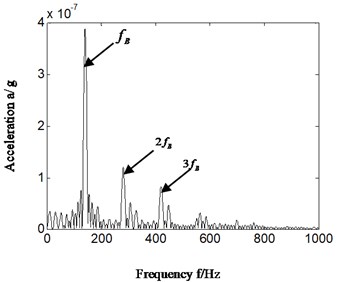
In order to estimate running conditions and identify fault categories of rolling bearing of aero-engine correctly and effectively based on casing vibration signal, and reduce the difference between theoretical and practice application researches, cyclostationary theory is combined with Hilbert transform and autocorrelation analysis. In order to verify that proposed new method has desirable effect on identifying fault of rolling bearing, the same casing vibration data as Section 4.1 was used. The result is shown in Fig. 5. Fig. 5(a1)-(a2) and Fig. 5(b1)-(b2) is respectively Hilbert envelope spectrum and its local amplification as cyclic frequency of cyclic autocorrelation function equal to outer ring feature frequency of rolling bearing. Fig. 5(a1)-(a2) is corresponding with bearing chock signal, and Fig. 5(b1)-(b2) is corresponding with casing signal.
Fig. 5Hilbert envelope spectrum of autocorrelation function slice signal and its zoom – cyclostationary frequency is equal to outer ring characteristic frequency – scheme B
a1) Sensor installation bearing chock
b1) Sensor installation rear casing
a2) Sensor installation bearing chock
b2) Sensor installation rear casing
By analyzing Fig. 5, the following conclusions can be drawn:
1) In Fig. 5(a1)-(a2) bearing chock signal, the frequency component which has nothing to do with fault of rolling bearing is reduced in Hilbert envelope spectrum compared with Fig. 4(a2); meanwhile the fault characteristic frequency is more significant. That is, the effect of fault feature extracted is improved.
2) What is more important is that the Hilbert envelope spectrum of casing signal has outstanding outer ring characteristic frequency and its integral multiple which is shown in Fig. 5(b1)-(b2). Furthermore, in detailed analysis, there is highlighted difference between Fig. 5(b1)-(b2) and Fig. 4(b2)-(b3) which is corresponding with traditional research. It is significant for aero-engine as it could carry out conditions monitoring effectively on rolling bearing of aero-engine based on casing vibration signal according to proposed method (as shown in Fig. 3(b)).
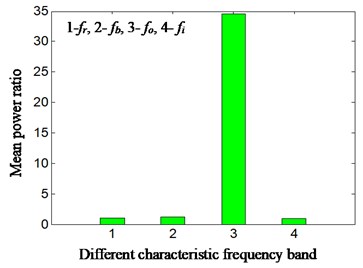
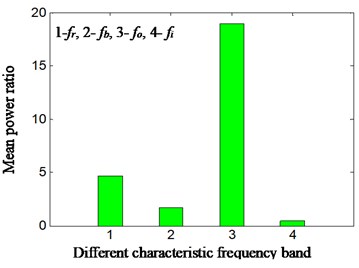
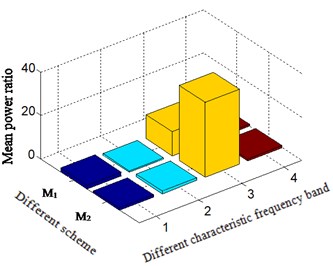
In order to monitor the running conditions and identify fault types of rolling bearing in simpler and more intuitive way, the mean power ratio is calculated according to Eqs. (11-12) and Fig. 5. The result is shown on Fig. 6-7 and Table 3. The Fig. 6(a) -Fig. 7(a) represents sensor installation on bearing chock. Fig. 6(b) and Fig. 7(b) represents sensor installation on rear casing. The 1 to 4 of abscissa respectively represents characteristic frequency band of rotational speed, rolling element, outer ring and inner ring. The characteristic frequencies bands are taken from minus 5 Hz to positive 5 Hz on the basis of calculation of characteristic frequency according to Eqs. (7-10), in the consideration that there is a deviation between theoretical calculation and practice obtaining. For example, suppose that a characteristic frequency of rolling bearing is equal to MHz by calculation, and then the characteristic frequency band is selected from (-5) Hz to (+5) Hz, and double characteristic frequency band is selected from (2×-5) Hz to (2×+5) Hz and so on. The most outstanding characteristic frequency band of every feature frequency is selected in this paper. The ordinate represents mean power ratio between the selected characteristics frequency band and total low-frequency band. By analyzing Fig. 5, the 1 multiplication frequency band of outer ring feature frequency was selected because it is the most significant. The total low-frequency band is selected from 0 Hz to 1000 Hz, considering that the aero-engine real time monitoring frequency is not high; meanwhile, by analyzing Fig. 5, it can be found that main vibration frequency falls within 1000 Hz. The and are respectively corresponding to traditional method (as shown in Fig. 3(a)) at present and proposed new method (as shown in Fig. 3(b)) in Fig. 7. Table 3 is specific mean power ratio value among different sensor installation positions according to different research methods.
Fig. 6Mean power ratio – scheme B
a) Sensor installation bearing chock
b) Sensor installation rear casing
Fig. 7Mean power ratio based on different method for M1 – traditional method and M2 – scheme B
a) Sensor installation bearing chock
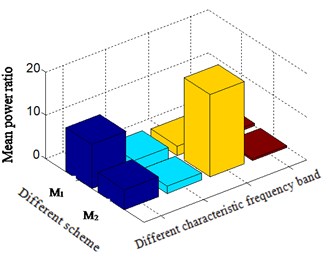
b) Sensor installation rear casing
By analyzing Fig. 6-Fig. 7 and Table 3, the following conclusion can be drawn:
It is observed from the Fig. 6(a) and Fig. 7(a) that in bearing chock signal, the mean power ratio of the outer ring characteristic frequency bands and total low-frequency bands, which corresponds to 3 of -axis, becomes more highlighted than traditional methods. From the further analysis in Table 3, it can be found that the mean power ratio value is increased from 11.07 to 34.53, and it is easier to identify fault of rolling bearing according to bearing chock signal based on proposed new method than traditional one.
Table 3Means power ratio based on different method-outer ring fault
Different scheme | Sensor installation position | Rotating feature frequency band | Rolling element feature frequency band | Outer ring feature frequency band | Inner ring feature frequency band |
Traditional method | Bearing chock | 1.63 | 0.68 | 11.07 | 1.00 |
Proposed new method | Bearing chock | 1.04 | 1.28 | 34.53 | 0.96 |
Traditional method | Rear casing | 10.10 | 2.58 | 2.20 | 0.66 |
Proposed new method | Rear casing | 4.65 | 1.65 | 18.98 | 0.46 |
It is observed from the Fig. 6(b) and Fig. 7(b) in casing signal that the mean power ratio of the outer ring characteristic frequency band and total low-frequency band, which is corresponding to -axis 3, becomes very significant based on proposed method in comparison with traditional one. By further analysis in table 3, the mean power ratio value is greatly increased from 2.20 to 18.98. Thus, it is evident that the mean power ratio based on the proposed method can correctly and effectively identify fault types of rolling bearing according to casing signal. It is important for large-scale rotating machine, like aero-engine.
That is, autocorrelation function combined with cyclostationary theory and Hilbert transform can extract the fault characteristic frequency of rolling bearing correctly and effectively, and meanwhile the obtained mean power ratio is compatible with fault types of rolling bearing based on casing vibration signal. Namely, no matter extraction feature frequency or calculation mean power ratio, it can diagnose and identify fault types of rolling bearing according to casing vibration signal by proposed method. However, the traditional research (as shown in Fig. 3(a)) cannot identify the fault occurrence of rolling bearing based on casing vibration signal (as shown in Fig. 4(b2)-(b3)).
5. Different factors influences
To verify the effectiveness of proposed new method, the influence on the extraction of characteristics and calculation of mean power ratio is considered including the ones of sensor installation position, fault type, type of experiment rigs, failure mode and rotating speed.
5.1. Influence of sensor installation position
In view of the influence of sensor installation position on the extraction characteristics and the mean power ratio calculation as presented in proposed method, experimental data in Section 4.1 is chosen for analysis by proposed method, and the acceleration sensors installed on front casing. The result is shown from Fig. 8(a)-(d). Fig. 8(a) shows the time-domain signal. Fig. 8(b)-(c) is the Hilbert envelope spectrum and its zoom respectively. Fig. 8(d) is the calculation of mean power ratio according to the Hilbert envelope spectrum of slice signal of autocorrelation function. The most obvious feature frequency band of different feature frequency is selected. The frequency of cyclic autocorrelation function slice signal is also equal to outer ring characteristic frequency of rolling bearing according to Eq. (6).
Fig. 8a) time domain of acceleration signal, b), c) Hilbert envelop spectrum and its zoom, d) mean power ratio-sensor installed on front casing
a) Sensor installation front casing
b) Sensor installation front casing
c) Sensor installation on front casing
d) Sensor installation on front casing
By analyzing Fig. 8, the proposed method can extract highlighted outer ring characteristic frequency and its integral multiple correctly and effectively regardless of installation position of sensors. Meanwhile, the distribution of mean power ratio of different feature frequency bands and general low-frequency bands perfectly matches the fault type of rolling bearing. That is, no matter acceleration sensor is installed in the front of casing which is closed to fault bearing or in rear casing which is far away from fault bearing, highlighted characteristic frequency and mean power ratio which matches fault types of rolling bearing can be extracted and calculated, if we combine autocorrelation function with cyclostationary theory and Hilbert transform (as shown in Fig. 3(b)).
Namely, there are the same features with the sensor being installed in different positions on the casing, when the rolling bearing has a fault. It is significantly advantageous to use casing signal alone to realize aero engine state monitoring.
5.2. The effect of failure types, type of experiment rigs and failure mode
The rolling element fault (caused by spark wire-cutting) corresponding with aero-engine compressor rotor experiment rig and inner ring fault (caused accelerate-fatigue experiment) corresponding with aero-engine rotor experiment rig are analyzed and studied in order to verify that proposed method is insensitive to fault types type of experiment rigs and failure mode of rolling bearing. The following two cases will be analyzed.
5.2.1. Rolling element faults caused by spark wire-cutting
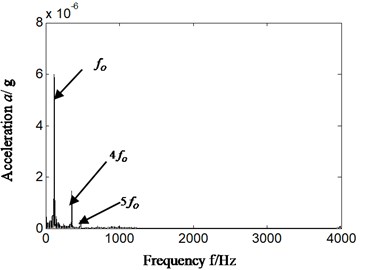
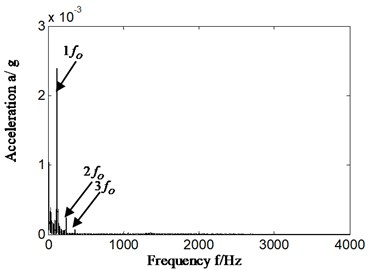
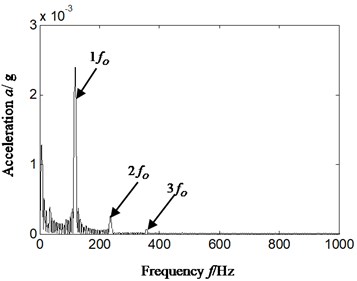
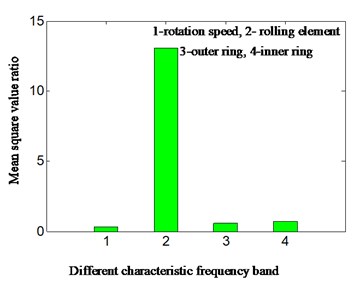
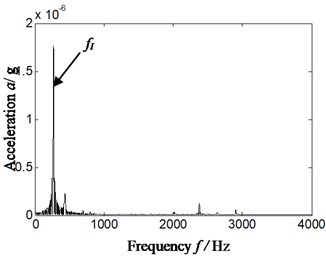
The rolling element fault of aero-engine compressor rotor rig corresponding with failure mode of rolling bearing was made by spark wire-cutting. We took the acceleration signal collected by the sensor installed in front of casing as an example to analyze (the results are similar if rear casing vibration acceleration signal was selected). The bearing with rolling element fault was installed in bearing chock consistent with lower part of rear casing. The rotation speed was 2444.6 r/min when rolling element fault occurred, and , , , , is respectively 40.7 Hz, 260.7 Hz, 350.4 Hz, 135.9 Hz and is 17.4 Hz. The result is displayed on Fig. 9. Fig. 9(a) is consistent with time domain signal and Fig. 9(b), Fig. 9(c) and Fig. 9(d) is respectively Hilbert envelope spectrum, Hilbert envelope spectrum local amplification and power ratio of the sums of different feature frequency bands and total low-frequency bands from 0 Hz to 100 0Hz. In Fig. 9(b) and Fig. 9(c), frequency of slice signal of cyclic autocorrelation equalizes to characteristic frequency of rolling elements of rolling bearing.
Fig. 9Fault type effect – sensor installed on forward casing – scheme B
a) Time domain signal- rolling element fault
b) Hilbert envelope spectrum- rolling element fault
c) Hilbert envelope spectrum local amplification-rolling element fault
d) Mean square value ratio-rolling element fault
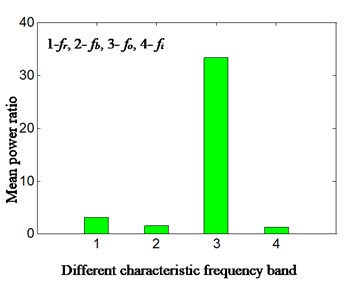
By analyzing Fig. 9: it can be found that based on the proposed method, the characteristic frequency of rolling element extracted during a fault and power ratio calculated has perfectly matched the fault type of bearing. The power ratio of rolling element during a fault corresponds to the 2 in -axis. This is consistent with the conclusion of outer ring fault.
5.2.2. Inner ring fault caused by accelerate-fatigue experiment
The inner ring fault made by accelerate-fatigue experiment of aero-engine rotor experiment rig was analyzed and compared. In the process of accelerate-fatigued experiment, the vibration signal was real-time collected and monitored by BLES bearing invalidation monitor and life assessment system which shown in Fig. 2(c). The oil data is also real-time monitored by OWA-2012 oil detection system. The specific geometric parameter and multiple relationships between rotation frequency and characteristic frequency of Model 6206 rolling bearing are respectively shown in Table 2.
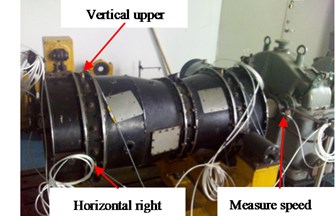
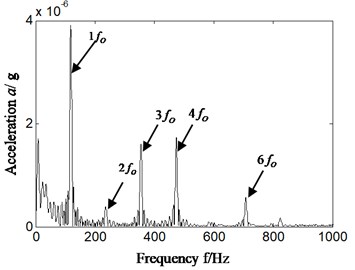
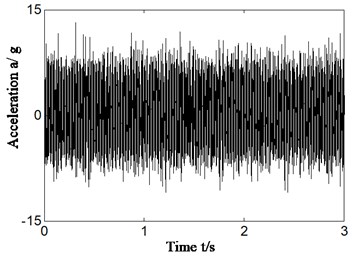
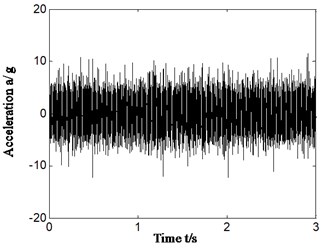
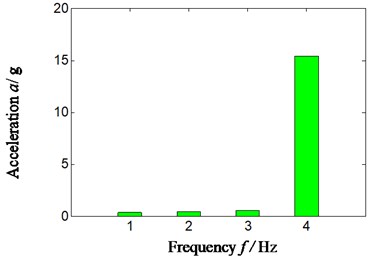
Limited by space, the acceleration signal of horizontal right is analyzed (the result is also similar if the vertical upper acceleration signal is selected). The rotation speed is 3000 r/min, and rotation frequency, retainer feature frequency, rolling element feature frequency, outer ring feature frequency and inner ring feature frequency is respectively 49.8 Hz, 16.6 Hz, 112.8 Hz, 176.7 Hz and 271.2 Hz by calculation according to Eqs. (7-10) or Table 2. The result is shown in Fig. 10. Fig. 10(a) is time domain of acceleration signal. Fig. 10(b) and Fig. 10(c) represents the calculation power ratio based on proposed method.
Fig. 10Type of experiment rigs and failure mode effect – scheme B
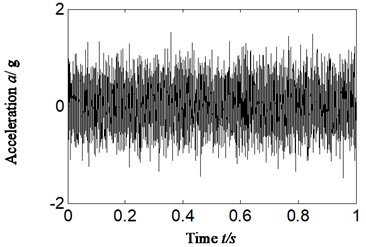
a) Time domain of casing vibration acceleration
b)
c)
By analyzing Fig. 10: it can be found that the proposed method can precisely and effectively identify an inner ring fault of rolling bearing set by accelerate-fatigue experiment rig, and the extracted characteristic frequency and power ratio can perfectly match the fault type of bearing (inner ring fault corresponds to the 3 in -axis). This is consistent with the result of fault identification of rolling bearing and outer ring (a fault was made by spark cutting).
5.3. Rolling bearing characteristics extraction: normal running
In normal running conditions of aero engine compressor rotor rig, the characteristics of rolling bearing were extracted and mean power ratio was calculated according to different feature frequencies by proposed method. The rotating speed is about 1827 r/min, and , , , , is respectively 30.5 Hz, 124.9 Hz, 179.6 Hz, 82.1 Hz and 12.5 Hz. The Hilbert envelope spectrum of slice signal of time delay of cyclic autocorrelation function was studied and analyzed in cyclic-frequency equal to , , . The result is displayed from Fig. 11. The Fig. 11(a) is time domain signal of normal running. Fig. 11(b1)-(b3) is Hilbert envelope spectrum of slice signal of time delay. Fig. 11(c1)-(c3) is mean power ratio of Hilbert envelope spectrum of time delay slice signal, and the specific value of mean power ratio in different conditions is also displayed in Table 4. Fig. 11(b1)-(b3) and Fig. 11(c1)-(c3) is respectively corresponding with cyclic frequency slice position equal to outer ring characteristic frequency, inner ring characteristic frequency and rolling element characteristic frequency.
Fig. 11Normal running of rolling bearing
a)
b1)
b2)
b3)
c1)
c2)
c3)
In the normal running conditions of rolling bearing and in different cyclic frequency positions, no matter by extraction characteristic frequency based on slice signal’s Hilbert envelope spectrum or calculation of mean power ratio of different feature frequencies, all has shown that rolling bearing is running in normal conditions by proposed method, which is corresponding with real running conditions of rolling bearing. According to this we can identify the rolling bearing occur fault or not.
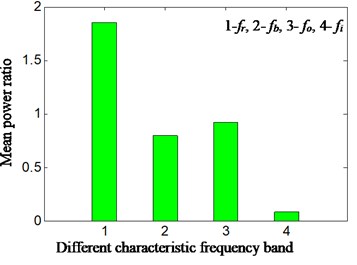
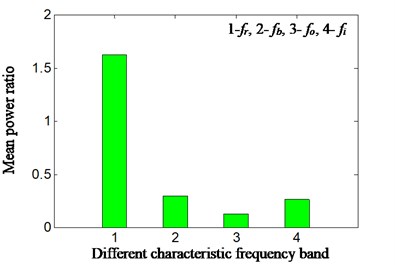
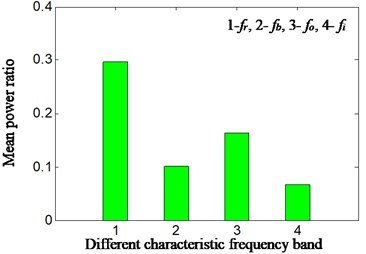
By analyzing Table 4, it can be found that no matter with three different rotating speeds: 1500 r/min, 1800 r/min and 2400 r/min, or in three different modes: outer ring fault, element rolling fault and normal running, all can work effectively in calculation of the mean power ratio that perfectly matches the fault types of rolling bearing by proposed new method based on single-channel casing vibration signal.
Table 4Calculation mean power ratios considering different factors effect based on proposed new method
Mean power ratio-different characteristic frequency band | Rotating speed | Fault types failure mode experiment rig | Sensor position | Slice position | |||
Rotation speed | Rolling element | Outer ring | Inner ring | ||||
4.65 | 1.65 | 19.0 | 0.46 | 1547 | Outer ring | front casing | |
3.07 | 1.53 | 33.3 | 1.20 | 1547 | Outer ring | rear casing | |
0.31 | 13.07 | 0.56 | 0.72 | 2445 | Rolling element | rear casing | |
0.67 | 1.04 | 1.28 | 15.52 | 3000 | Inner race | Horizontal | |
1.86 | 0.78 | 0.92 | 0.08 | 1827 | Normal | front casing | |
1.62 | 0.30 | 0.12 | 0.26 | 1827 | Normal | front casing | |
0.30 | 0.10 | 0.16 | 0.07 | 1827 | Normal | front casing | |
6. Conclusions
The common research of rolling bearing is based on bearing chock signal and bearing is damaged by wire cutting at present. While the state monitor of rolling bearing of aero-engine can only be basic on casing signal due to limitation of structure and inconvenient of installation. Whether studies are based on bearing chock signal or bearing damaged by means of wire cutting method has great inconformity with engineering practice and which leads to the great difference between theory study and engineering application. Based on above analysis, a method is proposed and used to extract feature characteristic and identify and judge fault type of rolling bearing. The specific contents and results show following features:
1) In view of complexity and comprehensiveness of casing signal compared with bearing chock signal, the cyclostationary theory is combined with autocorrelation analysis and Hilbert envelop analysis and used to extract fault characteristic frequency of rolling bearing.
2) The accelerate-fatigue experiment of rolling bearing is implemented in order to simulate the natural failure process of rolling bearing and to reduce the difference of fault bearing invalidation between common studied method at present and engineering practice. All analysis on fault bearing comes from accelerate-fatigue experiment in this paper.
3) The comparative analysis is carried out between conventional research method which combines cyclostationary theory with Hilbert envelope analysis at present and proposed new method. The result shows that no matter extraction feature frequency or calculation mean power ratio, all can diagnose and identify fault types of rolling bearing according to casing vibration signal by proposed method; while, the traditional research cannot identify the fault occurrence of rolling bearing based on casing vibration signal.
4) Various fault signals of rolling bearings have been explored and analyzed in this paper. These signals have been collected from 2 experiment rigs (of compressor rotator and aero-engine rotator), 3 rotation speeds, 1800 r/min, 2400 r/min and 3000 r/min, 3 fault modes (outer ring, rolling element and inner ring) and 2 failure modes (spark cutting and accelerate-fatigue experiment). The result indicates that the proposed method (including extracted characteristic frequency and power ratio) can precisely and effectively make fault extraction and identification of fault type.
In other words, the proposed method is capable to effectively identify the running conditions and fault types of rolling bearing by bearing chock signal and casing vibration signal. It can reduce the difference between theory study and practical application.
References
-
Nguyen Phuong, Kang Myeongsu, Kim Jong-Myon, et al. Robust condition monitoring of rolling element bearings using de-noising and envelope analysis with signal decomposition techniques. Expert Systems with Applications, Vol. 42, 2015, p. 9021-9032.
-
Lin T. R., Yu K., Tan J. Condition monitoring and fault diagnosis of roller element bearing. IntechOpen, 2017, https://doi.org/10.5772/67143.
-
Pan M. C., Tsao W. C. Using appropriate IMFs for envelope analysis in multiple fault diagnosis of ball bearing. International Journal of Mechanical Sciences, Vol. 69, Issue 4, 2013, p. 114-124.
-
Kostyuka A. G., Shatokhinb V. F., Volokhovskayac O. A. Motion of an imbalanced rotor when it rubs against the stator. Thermal Engineering, Vol. 59, Issue 2, 2013, p. 87-95.
-
Antoni J., Bonnardot F., Raad A., et al. Cyclostationary modeling of rotating machine vibration signals. Mechanical Systems and Signal Processing, Vol. 18, 2004, p. 1285-1314.
-
Randall R. B., Antoni J., Chobsaard S. The relationship between spectral correlation and envelope analysis for cyclostationary machine signals, application to rolling bearing diagnostics. Mechanical Systems and System Processing, Vol. 15, Issue 5, 2001, p. 945-962.
-
Antoni J., Guillet F., Badaoui El, Bonnardot F. Blind separation of convolved cyclostationary processes. Signal Processing, Vol. 85, Issue 1, 2005, p. 51-66.
-
Chen Jin, Jiang Ming The state-of-art of the application of the higher-order cyclostationary statistics in mechanical fault diagnosis. Journal of Vibration Engineering, Vol. 14, Issue 2, 2001, p. 125-134.
-
Zhou Fuchang, Chen, Jin, He Jun, et al. Application of cyclostationary signal processing with wavelet filtering in rolling element bearing fault diagnosis. Journal of Vibration and Shock, Vol. 25, Issues 4, 2006, p. 91-94+197.
-
Du Xiaoshan, Dong Hongbo, Liang Chunmiao, et al. Study on the second-order cyclic spectrum slices and its application in mechanism fault diagnosis. Journal of Sha An Xi University of Science and Technology, Vol. 28, Issue 1, 2010, p. 79-83+101.
-
Xu Yajun, Yu Dejie, Liu Jian Fault diagnosis of roller bearings based on chirplet path pursuit and order cyclostationary demodulation. Journal of Aerospace Power, Vol. 28, Issue 11, 2013, p. 2600-2608.
-
Borghesani P., Pennacchi P., Ricci R., Chatterton S. Testing second order cyclostationarity in the squared envelope spectrum of non-white vibration signals. Mechanical Systems and Signal Processing, Vol. 40, Issue 40, 2013, p. 38-55.
-
Boungou D., Guillet F., El Badaoui M. Fatigue damage detection using cyclostationarity. Mechanical Systems and Signal Processing, Vols. 58-59, 2015, p. 128-142.
-
Chen Jin, Dong Guangming Cyclostationary Theory and Method of Mechanical Fault Characteristic Extraction. Shanghai Jiao Tong University Press, Shanghai, China, 2013.
About this article

This work was supported by National Natural Science Foundation of China (Grant number: 51605309), Natural Science Foundation of Liaoning Province of China (Grant number: 2019-ZD-0219), Provincial Education Department of Liaoning Province of China (Grant number: JYT19042) and Aeronautical Science Foundation of China (Grant number: 201933054002).
