Abstract
To effectively extract the characteristics of weak imbalance fault of aircraft hydraulic pump, autocorrelation function (AF) is combined with wavelet transform (AFWT) instead of threshold denoising. Meanwhile, power ratio (PR) was obtained by extracted characteristic frequency and applied to the identification of weak imbalance fault. A contrastive analysis was conducted among different signals, including acceleration and displacement signal. The results indicate that displacement signal, rather than acceleration signal, can effectively identify a weak imbalance fault.
Highlights
- Weak imbalance fault of aircraft hydraulic pump.
- Autocorrelation function is combined with wavelet transform instead of threshold denoising.
- Vibration acceleration signal of casing is transformed into displacement signal.
1. Introduction
Vibration signal is playing an increasing important role in fault diagnosis and status monitoring of rotational machines [1]. Aircraft hydraulic pump remains a crucial part in aircraft. Statistically, around 40 % of faults of aircraft result from hydraulic system [2]. The faults of power input shaft may result in sufficient power, excessive power fluctuation and failure of all systems dependent on hydraulic system as power unit. The failures like inability of fold, release of undercarriages and being no response from wheel brake system can be detected while power input shaft malfunctions [2, 3]. Furthermore, the mass unbalance is atypical fault of rotational machine [4, 5]. Based on the above analysis, a weak imbalance fault is created by fixing an imbalanced bolt to the coupler close to power input shaft. Wavelet transform (WT) has been widely used to analyze non-stationary signal due to its excellent time-frequency resolution [6, 7]. Vibration acceleration signal of pump shell was decomposed, de-noised, and reconstructed in order to improve signal-to-noise and pick up the characteristic frequency of fault by WT [8]. As casing vibration signal is the comprehensive reflection of all parts, fault characteristics of casing vibration signal become very complicated due to distortion of signal, attenuation of energy and influence of noise. All these have added to the difficulty of fault diagnosis [1]. Furthermore, considering that the classification criterions of rotor system faults of rotating machinery are mainly basic displacement amplitude or velocity intensity [9]. However, due to the large volume of displacement sensor and the limitation of installation position, the application of displacement sensor is limited to some extent. The installation positions of acceleration transducer in casing can be chosen, conveniently, due to smaller volume and lighter weight. Due to the small volume and light weight of acceleration transducer, it can be conveniently fixed to different positions on casing. Furthermore, in considering that real-time monitoring frequency in aero-engine is not high and acceleration signal is more sensitive to high frequency signal, predecessors have proposed many methods to convert acceleration signal to displacement or velocity signal [9-11]. Generally, the integral method is applied to convert the acceleration to velocity or displacement signal in engineering practice. Unexpectedly, the trend terms will come into being in the conversion [10]. Hence, some methods like least square, which is the most traditional method in engineering practice, are applied to eliminate shift of baseline and terms of high-order polynomial trend [11]. As the AF of signal can not only eliminate noise while reserving the period components, but also convert frequency modulation signal (FM) to amplitude modulation signal (AM), AF instead of threshold denoising is combined with wavelet transform to precisely extract characteristics frequency of weak imbalance fault. Meanwhile, the PR calculated by characteristic frequency is able to identify weak imbalance fault in a simpler and more visual manner.
2. Theoretical basis
2.1. Wavelet transform
Discrete wavelet transform (DWT) has been studied in-depth in various scientific and engineering fields [13]. Suppose is a time series, then wavelet transform of :
The is a basic wavelet function. is integer and, represents scale factor, represents shift factor and the scaling function is as below:
Through the DWT, the representations of wavelet coefficients of is defined by:
2.2. Autocorrelation analysis
A continuous signal is defined, then , the auto-correlation function of such that:
Given , and * is respectively delay factor, statistical mean value and complex convolution.
If the signal contains a certain periodic component (for example feature signal of unbalance fault), its autocorrelation function also has a certain periodic component and their periods are the same.
2.3. Displacement and acceleration signal
To define a displacement signal :
where represents the amplitude in different frequencies, fundamental frequency of displacement signal, and a starting angle. Consequently, , the acceleration signal of , is specified by:
The amplitude of acceleration signal seemstimes of displacement signal by comparing the Eqs. (6) and (7). It can be found that the higher frequency has the more obvious amplitude amplified will be. Consequently, the acceleration signal is more sensitive to high frequency.
2.4. Power
In engineering, mean square value (MSV) represents mean power of signal. Therefore, the MSV can be used to identify and estimate vibration intensity of signal.
A signal as well as its Fourier transform, is, defined, and then the MSV of , , is:
where keeps the length of . Suppose a frequency band is selected, then the power of this selected frequency band can be expressed by Eq. (8). Meanwhile, the power ratio, , can be shown as follows:
where , , , respectively represents the initial and termination point of the selected frequency band, and the is PR of selected different frequency band.
3. Characteristic extraction
In place of threshold denoising, AF is combined with wavelet transform to precisely extract characteristic frequency of weak imbalance fault. Furthermore, the PR is applied to identify the fault in simpler and more visualized manner. The specific schemes of conventional study and proposed new method are respectively shown in Fig. 1.
Fig. 1Scheme comparisons for a) conventional research and b) proposed new method
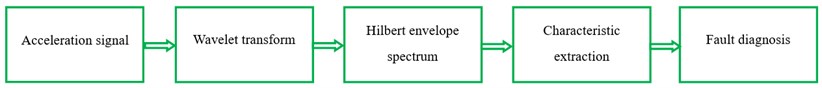
a)
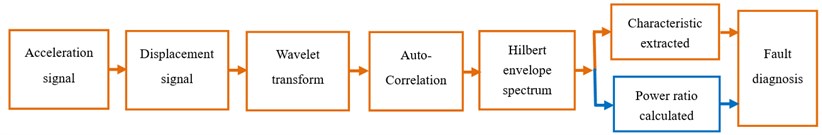
b)
By comparing conventional method (Fig. 1(a)) and proposed new method (Fig. 1(b)), differences can be found:
1) Firstly, the displacement signal is acquired by converting acceleration signal.
2) The AF is applied to reduce noise and enhance the periodicity of approximate or detailed signal obtained by wavelet decomposing.
3) The calculated PR is applied to estimate the fault of weak mass unbalance in simpler and more intuitionistic manner.
The concrete steps are as follows: proposed new method:
1) Vibration acceleration signal of casing is collected and transformed into displacement signal through least square combined with integral (the order of polynomial-fitting remains13 [11]).
2) The displacement signal is decomposed to approximate and detailed signal by wavelet transform. Considering that the symN wavelet family possesses excellent orthogonality and supports compacted and approximate symmetry, sym6 wavelet function is adopted. The number of decomposed levels of wavelet transform proves 4.
3) The approximate signal, a4, is selected, considering that the frequency band of approximate signal is the lowest and meeting the demands of analysis.
4) HES (Hilbert envelope spectrum) of AF of a4 is acquired and applied to estimate the fault of weak mass unbalance of aircraft hydraulic pump.
5) Finally, the calculated PR is applied to estimate the fault of weak mass unbalance.
4. Experiment of weak mass unbalance fault
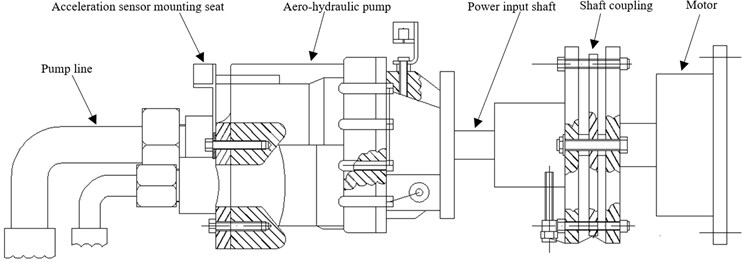
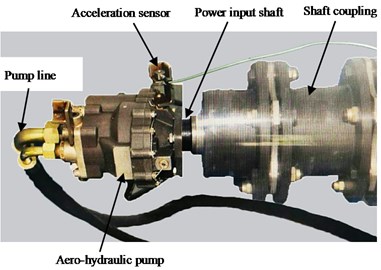
All experimental data in this paper is collected from a swash plate axial piston hydraulic pump, which is constituted by cylinders, oil distribution casing, plunger (the numbers of plunges is nine), oblique disk, drive shaft and spring as shown in Fig. 2.
Fig. 2Fault experiment of weak mass unbalance
a)
b)
c)
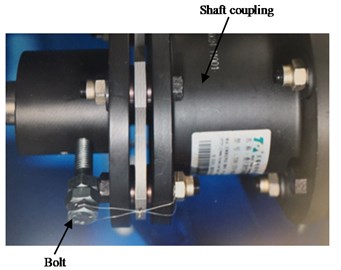
Couplers are used for jointing driver motor and hydraulic pump because the size of shaft proves mismatching between hydraulic pump and motor. The fault of weak mass unbalance is set by fixing a bolt – whose weight and size is respectively 0.045 kg and M6×10 cm – to couplers close to power input shaft. The data collector model, NI9234, is provided by National Instruments. The position and installation direction (vertical) of acceleration sensors are displayed in Fig. 2. Fig. 2(a)-(c) is the dynamical model, figure of aero-hydraulic pump and unbalance bold, respectively.
Randomly select the experimental data of mass unbalance of aircraft hydraulic pump. The 1T\2T\3T\4T, in this paper, is respectively corresponding with 1\2\3\4 multiple of rotational frequency. The scheme A\B\C corresponds with the analysis method of HES only, WT combined with HES and proposed new method.
5. Fault identification of casing vibration signal
5.1. Scheme A\B
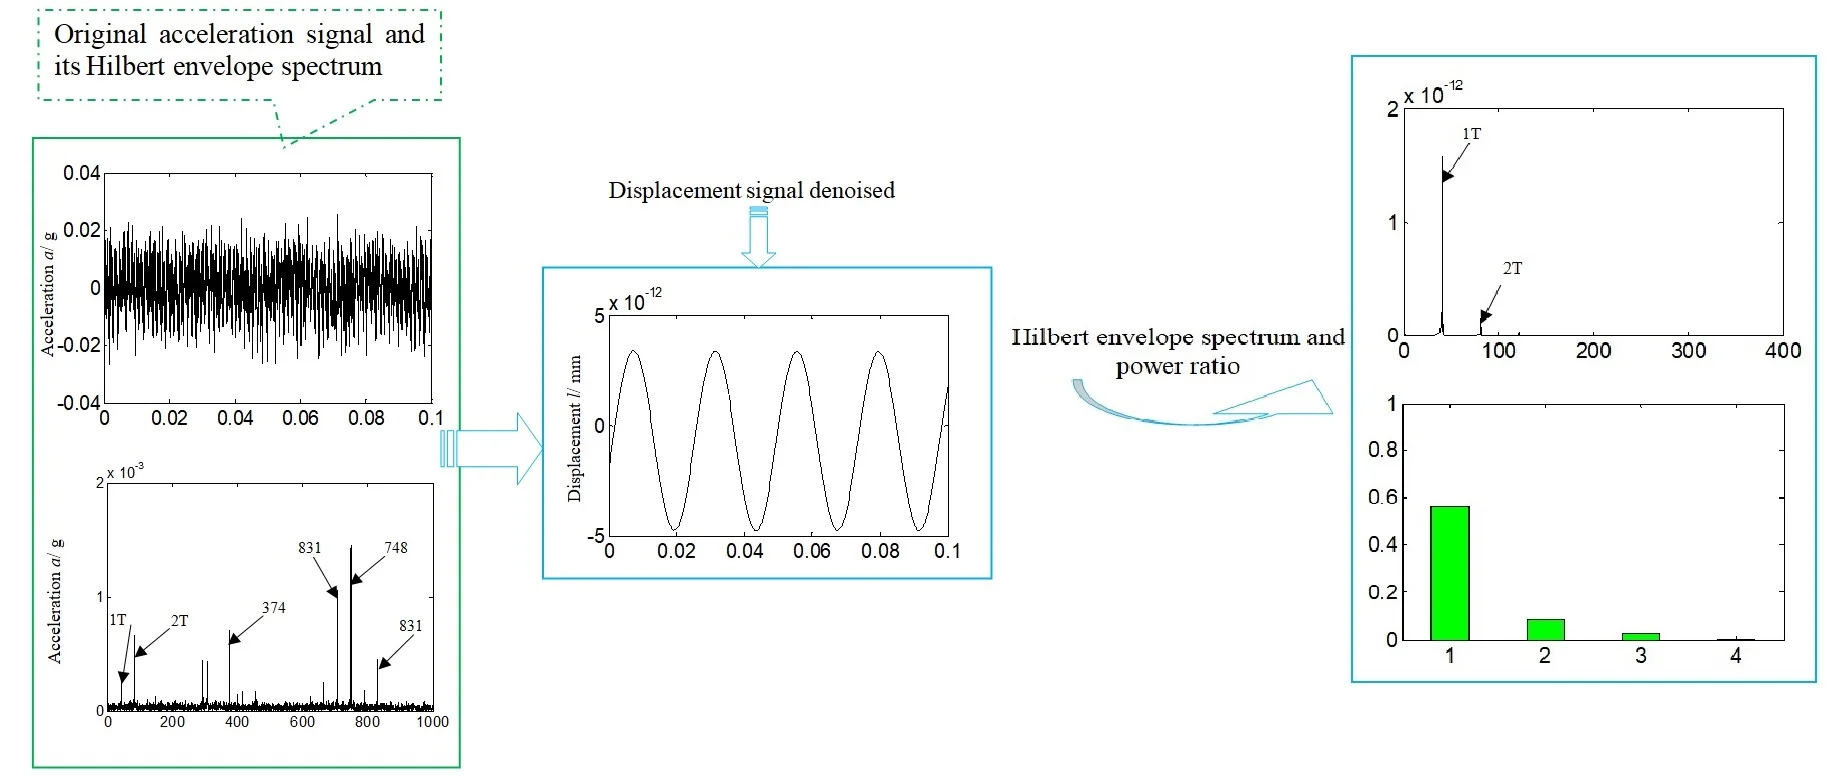
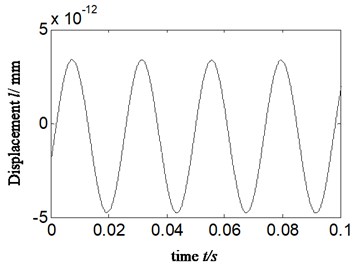
Limited by the length of paper, all the fault data was chosen randomly (RPM: 2438 r/min). The approximate signal, a4, is obtained by wavelet decomposing. Furthermore, the sym6 wavelet is selected and the decomposed level keeps 4 levels. HES of acceleration and displacement signal acquired by integral combining with least square fitting are compared and the results are displayed in Fig. 3-6. The Fig. 3-4 is respectively corresponding with the time domain signal and their HES (scheme A). Fig. 5-6 respectively matches with approximate signal and their HES (scheme B). Fig. 3(a)-6(a) are matching with acceleration signal, and Fig. 3(b)-Fig. 6(b) are matching with displacement signal.
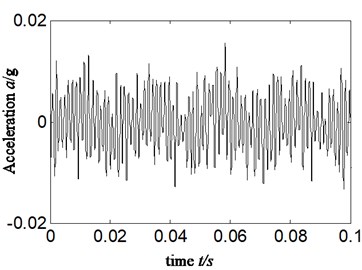
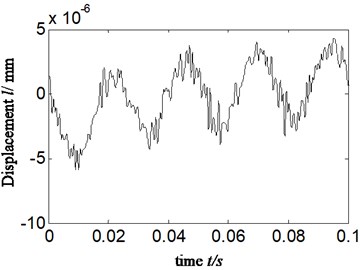
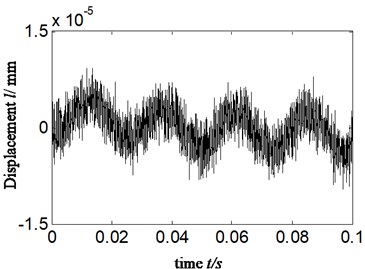
Fig. 3Time domain signal for a) acceleration signal and b) displacement signal-imbalance fault
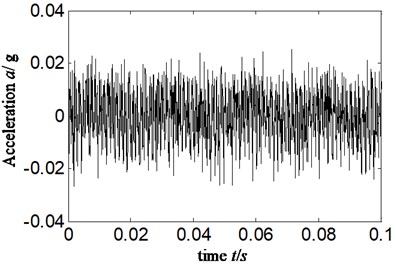
a)
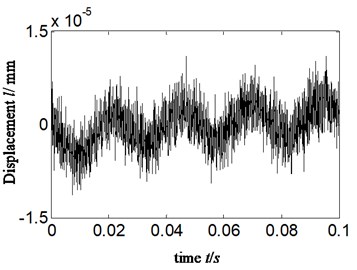
b)
Fig. 4HES for a) acceleration signal and b) displacement signal-imbalance fault-scheme A
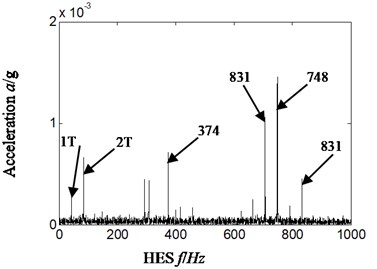
a)
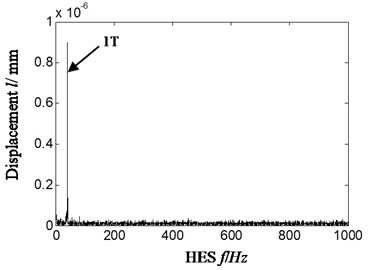
b)
By comparing Fig. 4(a)-Fig. 6(a) with Fig. 4(b)-Fig. 6(b) we can see that:
1) In Fig. 4(a) and Fig. 6(a), the HES of acceleration signal, it is the position of double rotational frequency that is greater in amplitude than that of one-time frequency.
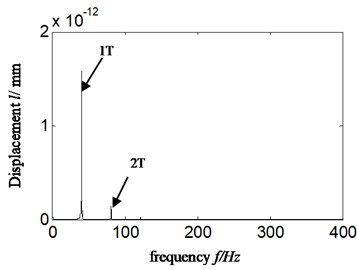
2) In Fig. 4(b) and Fig. 6(b), HES of displacement signal, the frequency components are simpler. Meanwhile, it is only rotational frequency that is highlighted.
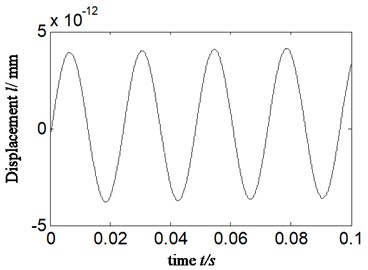
Fig. 5Approximate signal a4 for a) acceleration signal and b) displacement signal-imbalance fault-scheme B
a)
b)
Fig. 6HES of a4 for a) acceleration signal and b) displacement signal-imbalance fault-scheme B
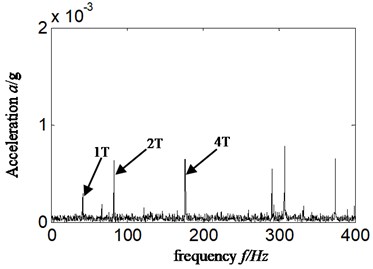
a)
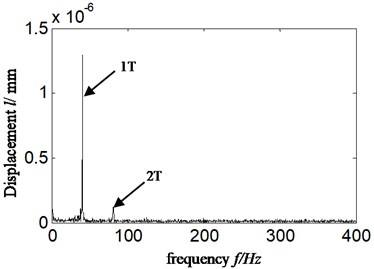
b)
According to Eqs. (6-7), the reason lies in that fact that compared with displacement signal, the amplitude of acceleration signal is amplified by times which work in such a way that the higher frequency is, the larger multiple will be. Hence, the frequency components in acceleration signal are more abundant and complicated due to the characteristic of acceleration signal itself. There is no enlarged effect of amplitude in the HES of displacement signal, which is acquired by transforming acceleration signal. Considering that in rotating machinery, the identification of fault type is mostly dependent to amplitude of displacement or vibration intensity (relative to speed signal) rather than acceleration signal, and major faults are usually relative to rotation frequency and its low-order frequency multiplication [9], therefore, a misdiagnosis is more likely to happen when acceleration signal is selected directly to estimate fault types of rotor system just like Fig. 4(a)-Fig. 6(a). In Fig. 4(a)-Fig. 6(a), the vibration amplitude of twice frequency is greater than that of one-time frequency. Hence, other faults, for example, misalignment fault instead of imbalance, will probably be considered resulting in a misdiagnosis. According to the above considerations, the displacement signal is selected in proposed method.
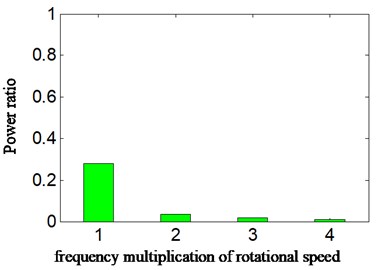
In order to further identify a mass unbalance fault more visually, the PR is calculated. Furthermore, the frequency band of 1\2\3\4 multiplication of rational frequency is picked, considering that the majority of faults of rotational machine will occur to certain extends in rotational frequency and its low-order frequency multiplication [9]. In consideration that there are certain deviations between practice and theoretical calculation, each corresponding characteristic frequency is increased or decreased by 5 Hz to be part of characteristic frequency band. For instance, supposing calculated rotational frequency proves Hz, and then frequencies from ( – 5) Hz to (+ 5) Hz will be selected as the rotational frequency band. Equally, frequencies from (2× – 5) Hz to (2× + 5) Hz will be selected as double rotational frequency band and so on. Meanwhile, frequencies from 0 Hz to 400 Hz are selected as the total low-frequency band; considering that real-time monitoring frequency of aero-engine is not high. The results are shown in Fig. 7 and Fig. 7(a-b) is the PR calculated by Eqs. (8-9). Fig. 7(a)-(b) respectively matches with acceleration and displacement signal converted, and the 1\2\3\4 of abscissa responds with 1\2\3\4 multiplication frequency of rotational frequency.
In Fig. 7(b), the power ratio of displacement signal is equal to 0.172. It can be found that no matter for acceleration or displacement signal, the power of rotation frequency is no different from that of other frequency multiplications. In other words, the WT combined with HES (scheme B) cannot estimate the fault of weak mass unbalance of aircraft hydraulic pump.
Fig. 7PR calculated according to HES of a4 for a) acceleration signal and b) displacement signal- imbalance fault-scheme B
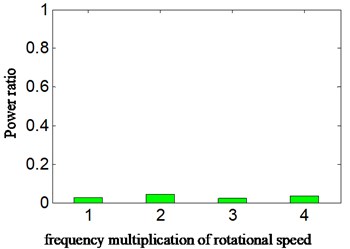
a)
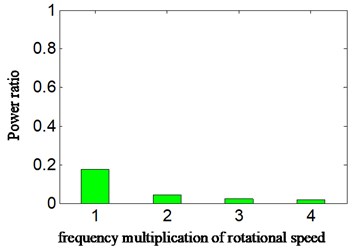
b)
5.2. Scheme C-proposed method: shown as Fig. 1(b)
The AF is combined with wavelet transform in order to identify weak imbalance fault based on casing vibration signal, correctly and effectively. In order to make a comparison, the same data as Section 5.1 was chosen. Firstly, the approximate signal (a4) of displacement signal (which was shown in Fig. 5(b)) is selected. Secondly, the autocorrelation function of a4 was acquired. Thirdly, the HES of autocorrelation function of a4 was obtained. The results are displayed in Fig. 8. Fig. 8(a)-(b) are AF of a4 and its HES, respectively. Fig. 8(c) is the calculated power ratio.
By analyzing Fig. 8, the following conclusions can be drawn:
1) Comparing Fig. 8 with Fig. 3-7, in Fig. 8, the noise is reduced greatly because of the function of AF for cyclic signal.
2) It is the position of rotational frequency that the amplitude is most highlighted in the Fig. 8 (b-c).
3) Compared with Fig. 7(b), in Fig. 8(c), the calculated PR in rotational frequency is increased greatly. The value gets close to 60 % of total energy (according to scheme B in Fig. 7(b), it is 17 %), while the PR from other positions of frequency multiplication is very small. The reason lies in the fact that displacement signal will not amplify the amplitude of any frequency components and the noise of AF is reduced.
Namely, according to the methods proposed in the paper, HES and power ratio both has outstanding performance in the position of rotation frequency, which can contribute to the identification and judgment of weak imbalance faults in aircraft hydraulic pump.
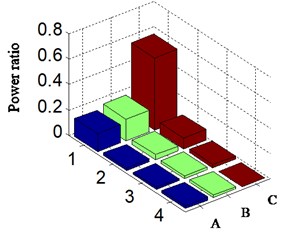
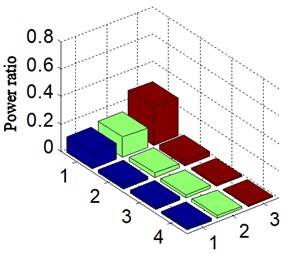
5.3. Comparison analysis of power ratio among different schemes
For visually comparing the diversity of power ratio among different methods, the histogram is shown in Fig. 9, and meanwhile specific value of PR is given in Table 1. The 1\2\3\4 of abscissa respectively corresponds to 1-4 frequency multiplication of rotational frequency. The A\B\C is the different schemes of Fig. 9 and Table 1. HES corresponds to scheme A and is marked by blue; combination of HES and WT is relative to scheme B and marked by green; the proposed new method is the scheme C and marked by red. The -axis proves the calculated PR based on the above different schemes in Fig. 9. The Fig. 9(a) matches with acceleration signal, and Fig. 9(b) corresponds with displacement signal.
Fig. 8a) autocorrelation function of a4, b) HES of autocorrelation function of a4 and c) calculated power ratio-imbalance fault-proposed new method: scheme C
a)
b)
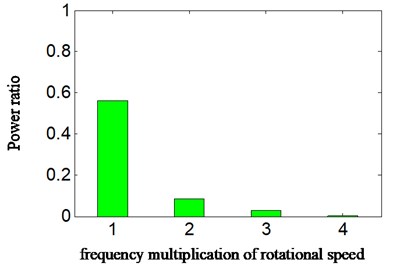
c)
Fig. 9Calculated power ratio according HES for a) corresponding with acceleration signal and b) corresponding with displacement signal-weak imbalance fault
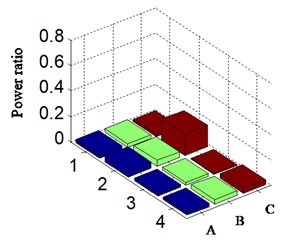
a)
b)
Analyzing Fig. 9 and Table 1 in details, the same conclusions can be drawn with the above analysis:
No matter scheme A (HES only marked by blue) or scheme B (WT with HES marked by green) is chosen basic on acceleration or displacement signal, the PR value is approximate in both situations.
The acceleration signal cannot be directly used to estimate fault types of aircraft hydraulic pump, and it probably brings out misdiagnosis just like Fig. 9(a) and Table 1. In Fig. 9(a), the amplitude of position of twice frequency is greater than that of one-time frequency. Hence, other fault types, like misalignment, are likely to be considered and will result in misdiagnosis consequently.
Table 1Calculated power ratio based on different schemes
Signal types | Different schemes | Frequency multiplication of rotational frequency | |||
1T | 2T | 3T | 4T | ||
Acceleration signal | Scheme A | 0.031 | 0.051 | 0.023 | 0.027 |
Scheme B | 0.030 | 0.047 | 0.025 | 0.035 | |
Scheme C | 0.017 | 0.168 | 0.011 | 0.039 | |
Displacement signal | Scheme A | 0.148 | 0.021 | 0.019 | 0.022 |
Scheme B | 0.172 | 0.040 | 0.025 | 0.020 | |
Scheme C | 0.568 | 0.084 | 0.027 | 0.004 | |
It is in rotational frequency position that the calculated power ratio is mostly based on scheme C (marked by red). The PR obtained by HES is increased from 0.148 (marked by blue in Table 1) to 0.568 (based on the new method and marked by red in Table 1). Meanwhile other frequency multiplications are minute and the largest is only 0.084. Therefore, the scheme C is capable to identify a weak imbalance fault in aircraft hydraulic pump in the consideration that given the same operation environment in normal running, the PR related with rotational frequency and frequency multiplication will not vary greatly. If some frequency multiplication is increased greatly, it is possibly caused by a certain fault that is corresponding with these suddenly increased frequencies multiplication. For instance, basis frequency of rotational speed is increased greatly corresponding with the unbalance fault (2 or 4 times frequency matching with misalignment), probably.
For testifying the validity of proposed method, the PR is calculated on normal running of aircraft hydraulic pump. Meanwhile, a contrastive analysis is carried out between weak imbalance fault and normal running status of aircraft hydraulic pump.
5.4. Normal operate-proposed new method
In normal operation, running status of hydraulic pump is monitored based on proposed method. The rotational speed is 2378.3 r/min and the rotational frequency 39.6 Hz (2378.3/60 = 39.6). The results are displayed in Fig. 10 and Table 2, in which the schemes A\B\C (marked by blue, green and red, respectively) are also relative to HES only, combination of HES and WT and proposed new method. The Fig. 10(a) proves displacement signal by converting acceleration signal, and Fig. 10(b) is the approximate signal a4. Fig. 10(c) is calculated PR according to scheme C. The 1\2\3\4 of -axis are matching with 1\2\3\4 frequency multiplication of rotational frequency, respectively.
Table 2Calculated power ratio based on different schemes-normal running
Signal types | Different schemes | Frequency multiplication of rotational frequency | |||
1T | 2T | 3T | 4T | ||
Displacement signal | Scheme A | 0.115 | 0.026 | 0.023 | 0.019 |
Scheme B | 0.144 | 0.033 | 0.021 | 0.020 | |
Scheme C | 0.255 | 0.035 | 0.018 | 0.009 | |
After analyzing the Fig. 10 and comparing with Fig. 8(c) and Fig. 9(b), and meanwhile comparing Table 1 with Table 2, the following conclusions can be drawn:
1) Comparing Fig. 10(a)-(b) with Fig. 6(b) and Fig. 8(a), respectively, and meanwhile analyzing the calculated PR of rotational frequency of displacement signal based on scheme A and B, which is marked by blue and green (shown in Tables 1-2), it can be found that they are approximate in amplitude and shape of signal either according to HES or calculated PR in the different running status-including normal running and weakness imbalance fault. Despite the amplitude of running on normal status is lower than weakness imbalance fault, the difference is small. Hence, it cannot identify the running status of aircraft hydraulic pump based on scheme A and B.
2) By comparing the calculated PR between Fig. 8(c) and Fig. 10(c), and meanwhile analyzing Tables 1-2, marked by red, it can be found that the diversity is obvious in different running statuses-including normal operating and weak imbalance) according to scheme C. The calculated PR is increased from 0.115 (scheme A) to 0.255 (scheme C), when aircraft hydraulic pump is normal running. The percentage of amplitude of rotational frequency of rotational frequency is increased about 10 %, and the change of frequency multiplication else is small.
3) However, it is from 0.148 (scheme A) to 0.568 (scheme C) that the calculated PR is increased greatly when weakness imbalance fault occurs in aircraft hydraulic pump. Consequently, in the position of rotational frequency, the percentage is increased by over 40 %, and it is close to 4 times of initial calculated PR. Hence, the proposed method can be applied to identify the weak imbalance fault in aircraft hydraulic pump.
Fig. 10Normal running for a) displacement signal, b) autocorrelation function of a4, c) calculated power ratio-scheme C and d) calculated power ratio according to different scheme
a)
b)
c)
d)
6. Conclusions
AF (instead of threshold denoising) is combined with WT to identify a weak imbalance fault in aircraft hydraulic pump based on vibration signal of casing. The contrastive analysis is carried out between acceleration and displacement signal according to different schemes. The results indicate that a weak mass imbalance fault in aircraft hydraulic pump can be identified by extracted characteristics and PR. The results show following features:
1) No matter which scheme, including A\B\C, when it is directly based on acceleration signal, it cannot effectively identify a weak imbalance fault in hydraulic pump (no matter based on HES or PR or not), which will result in a misdiagnosis.
2) A contrastive analysis is carried out between the statuses of normal running and weak imbalance fault according to proposed method. The result indicates that with HES or PR, the proposed method of this paper can effectively monitor running status of hydraulic pump and identify an imbalance fault.
References
-
Han Qingkai, Yu Jiancheng, Gong Zhaomin, et al. Vibration measurement and fault analysis of large scale rotating machinery. Journal of Vibration, Measurement and Diagnosis, Vol. 23, Issue 1, 2003, p. 10-13.
-
Liu Yujiao, Yao Entao, Xu Hongzhuan Fault diagnosis of hydraulic pump based on particle filtering and autoregressive spectrum. Chinese Journal of Scientific Instrument, Vol. 33, Issue 3, 2012, p. 561-567.
-
Li H. Performance test and fault diagnosis of encapsulated hydraulic system. Journal of Electronic Measurement and Instrument, Vol. 18, 2004, p. 950-953.
-
Muszynska A., Goldman P. Chaotic responses of unbalance rotor bearing stator systems with looseness or rubs. Chaos, Solitons and Fractals, Vol. 5, Issue 9, 1995, p. 1683-1704.
-
Huang Jinping, Ren Xingmin A novel method of identifying the imbalance of flexible rotor with one disc. Journal of Aerospace Power, Vol. 23, Issue 2, 2008, p. 293-298.
-
Jiang W. L., Zhang S. H. Q., Wang Y. Q. Wavelet transform method for fault diagnosis of hydraulic pump. Chinese Journal of Mechanical Engineering, Vol. 37, Issue 6, 2001, p. 34-37.
-
Rajeswari C, Sathiyabhama B, Devendiran S, et al. A gear fault identification using wavelet transform, rough set based GA, ANN and C4.5 algorithm. Procedia Engineering, Vol. 97, 2014, p. 1831-1841.
-
Wang Yukui, Li Hongru, Ye Peng Fault identification of hydraulic pump based on mulit-scale permutation entropy. China Mechanical Engineering, Vol. 26, Issue 4, 2015, p. 518-523.
-
Chen Guo An introduction to detection and diagnostic technology of aircraft. Chinese Civil Aviation Press, Beijing, 2007, p. 162-172.
-
Gu Mingshen, Zhenhua L. V. Identification of a mechanism’s vibration velocity and displacement based on the acceleration measurement. Mechanical Science and Technology for Aerospace Engineering, Vol. 30, Issue 4, 2011, p. 522-526.
-
He Peng Ju, Feng Liang Study on the real-time elimination method of random noise and trend terms in acceleration signal. Electronic Design Engineering, Vol. 21, Issue 14, 2013, p. 18-22.
-
Chen Jin, Dong Guangming Cyclostationary theory and method of mechanical fault characteristic extraction. Shanghai Jiao Tong University Press, Shanghai, 2013.
-
Wong Tien-Tsin, Leung Chi-Sing, Heng Pheng-Ann, et al. Discrete wavelet transform on consumer-level graphics hardware. IEEE Transactions on Multimedia, Vol. 9, Issue 3, 2007, p. 668-673.
About this article

This work was supported by National Natural Science Foundation of China (Grant Number: 51605309), Natural Science Foundation of Liaoning Province of China (Grant Number: 2019-ZD-0219), Aeronautical Science Foundation of China (Grant Number: 201933054002) and Provincial Education Department of Liaoning Province of China (Grant Number: JYT19042).
