Abstract
A method of combining auto-correlation and Hilbert envelope analysis is proposed and used to identify weakness imbalance fault of aero-hydraulic pump, the central part of hydraulic system of aircraft. Firstly, the integral and polynomial least square fitting is applied to convert acceleration signal to velocity one; secondly, the Hilbert envelope spectrum of auto-correlation function of velocity signal is obtained and used to identify the weakness imbalance fault of aero-hydraulic pump; finally, the energy ratio of velocity signal is calculated according to Hilbert envelope spectrum for identifying imbalance fault of aero-hydraulic pump by means of easier and more visual method. Meanwhile, the comparing analysis is carried out between traditional research method and proposed new one. The result shows that the weakness imbalance fault of aero-hydraulic pump can be identified and diagnosed effectively and correctly according to the velocity signal whether Hilbert envelope spectrum or calculation energy ratio while direct acceleration signal cannot.
1. Introduction
Imbalance is a kind of representative fault in large-scale rotation machine, like aero-engine, and according to statistics, 60 % of equipment faults were caused by mass unbalance [1, 2]. Aero-hydraulic pump is the central part of hydraulic system of aircraft. Statistics show that the hydraulic system faults accounts for 40 percent of all total aircraft faults, and 15 to 20 percent of faults are aroused directly by hydraulic system fault [3]. The power input shaft fault of aero-hydraulic pump is a typical fault, which results in insufficient pressure or excessive volatility, and failure of actuators which take hydraulic source as power to achieve its expected function. For example, undercarriage cannot fold or release in time; wheel brake system cannot response in time, and so on. Based on the above considerations, in the coupler of aviation hydraulic pump close to power input shaft, weakness imbalance fault is set by mounting an imbalance bolt.
Due to the limitation of hydraulic pump structure, casing is usually the only device to monitor its running states [4]. Based on the wavelet packet decomposition and wavelet coefficients residual analysis method, the fault diagnosis approach employing the outlet pressure of pump is proposed for improving the accuracy of fault diagnosis of hydraulic pump by Gao, et al., in 2009 [5]. In 2012, Tang, et al., combined envelope spectrum analysis and empirical mode decomposition (EMD) to identify the early faults of pump based on vibration signal [6]. The casing signal is a comprehensive reflection of many parts [7, 8]. The signal distortion, energy attenuation and noise effect drastically increases the weakness and complexity of fault characteristics information of casing signal [9], and tremendously increases the difficulty of fault diagnosis in large-scale rotation machines.
Velocity is an ideal parameter to reflect vibration for most equipment, and its virtual value is a measurement standard of vibration faults identification across the globe [10]. But velocity sensor has a large size and can only be installed in fixed position through the specific installing seat in state monitoring, which limits the application of velocity sensor to some extent [11]. Acceleration sensor is smaller in size with lighter weight [11], and can be conveniently installed in different positions. While acceleration signal is more sensitive to high-frequency signal [11], it works in such a way that the higher frequency, the greater enlargement effect will be. Considering that common aero-engine real-time monitoring frequency is not high, and the vibration standard for identification faults of rotor system is usually according to velocity or displacement signal [10] rather than acceleration signal, some methods which can change acceleration signal to velocity or displacement signal are proposed [12-14]. Generally, integral method is used to transform the acceleration signal to velocity signal in practice, where the conversion will produce certain errors and trend terms [12]. Method of least square by using polynomials can eliminate baseline shift of liner conditions and high order polynomial trend terms, which is the most common method to eliminate trend terms in engineering practice [12, 13]. Integral method is combined with least square by polynomial in order to convert acceleration signal to velocity and displacement signal and to identify the rotor-stator rubbing position of aero-engine; meanwhile, the displacement signal obtained by converting acceleration signal and collecting directly is compared and verified in terms of the similarity and consistence from time-domain and frequency-domain, for example [14]. In consideration of the aero-hydraulic pump structure, the cyclic impact will be generated on the status of fault occurrence. Therefore, the faults characteristics can be extracted by demodulation modulated-vibration signal through envelope spectrum analysis. Hilbert transform can obtain the complex envelope of signal with regular vibration components removed and signal modulated information remained without the load frequency composition [15]. Signal auto-correlation function can reserve the periodic component and eliminate noise at the same time, and meanwhile can change frequency modulation to amplitude modulation [16]. Based on above considerations, a method of combining integral, polynomial least square fitting, with auto-correlation and Hilbert envelope analysis is proposed. Meanwhile energy ratio among frequency multiplication of rotation frequency and total low- frequency bands is calculated and used to identify weakness imbalance fault of aero-hydraulic pump according to casing velocity signal in proposed new method.
2. Theoretical basis
2.1. Hilbert transform [17]
The formulas for the basic discrete Hilbert transform (DHT) of discrete data , where are as follows:
The inverse discrete Hilbert transform is given as:
The transformation for the DHT matrix , input vector , and the output vector can be written as .
Then obtain the amplitude function of , namely the Hilbert envelope spectrum :
2.2. Auto-correlation function
A continuous signal is defined, then , the auto-correlation function of continuous such that:
Given , and is respectively delay factor, statistical mean value and complex convolution.
2.3. The relationship of velocity and acceleration signal
Suppose a velocity signal can be express as follows:
represents vibration amplitude in different frequency; is period number of ; represents the basic frequency of velocity signal; is initial phase angle, and then acceleration signal can be expressed:
Comparing the amplitude of Eq. (5) and (6), it can find that the acceleration signal has amplitude amplification effect on velocity signal, and meanwhile the higher frequency , the greater amplitude enlargement effect will be. That is why acceleration signal is more sensitive to high frequency signal than velocity signal.
2.4. Energy of velocity signal
The velocity signal is corresponding with the energy of signal. A vibration signal and its Fourier transform are defined, and then its energy of such that:
represents the length of . Suppose a frequency band is given, then the energy of this frequency band can be calculated according to Eq. (7). Meanwhile, the energy ratio of different selected frequency bands can be shown as follows:
where , , , respectively represents the staring and end points of different selected frequency bands of , and is the energy ratio of different selected frequency bands.
3. Weakness imbalance fault identification of aero-hydraulic pump
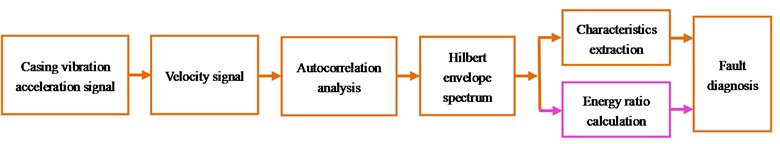
In consideration of the aero-hydraulic pump structure, the cyclic impact will be generated. Therefore, the faults characteristics can be extracted by demodulation modulated-vibration signal through envelope spectrum analysis. Signal’s auto-correlation function can reserve the periodic component and eliminate noise at the same time, which is excellently fit for cyclic signal of rotation machine. Based on above considerations, auto-correlation function and Hilbert envelope analysis is combined and used to diagnose imbalance fault of aero-hydraulic pump. The specific scheme is shown in Fig. 1. Fig. 1(a) is the common traditional study method which combines acceleration signal and Hilbert envelope analysis to identify and diagnose imbalance fault of rotor system; Fig. 1(b) is the proposed new method which combines auto-correlation function and Hilbert envelope analysis for identifying and diagnose weakness imbalance fault of rotor system of rotation machine in this paper.
Fig. 1Fault diagnosis method comparisons for: a) common traditional research method at present, b) proposed new method in this paper
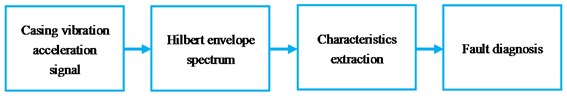
a)
b)
Compared with Fig. 1(a) and Fig. 1(b), the difference is highlighted, and they are shown as follows:
1) The casing vibration acceleration signal is converted to velocity signal firstly, and all further analysis is based on convert-obtained velocity signal in new method;
2) The auto-correlation function is used to reduce noise for velocity signal before Hilbert envelope analysis;
3) Not only the fault characteristics are extracted, but also the energy ratio is calculated and used to identify and diagnose weakness imbalance fault of aero-hydraulic pump in proposed new method.
The concrete steps based on proposed new method are as follows:
1) The casing vibration acceleration signal is collected on the status of the transmission shaft weakness imbalance fault occurrence and normal running of aero-hydraulic pump;
2) The vibration acceleration signal is converted to velocity signal by integral combining with polynomial least square fitting method.
3) The auto-correlation function of velocity signal is used to reduce the noise.
4) The Hilbert envelope spectrum of auto-correlation function of velocity signal is obtained and used to identify weakness imbalance faults of aero-hydraulic pump.
5) Finally, the energy ratio is calculated according to Hilbert envelope spectrum of auto-correlation function of velocity signal. Meanwhile, the energy ratio is used to identify and diagnose weakness imbalance fault on the status of power input axis weak imbalance fault occurrence and normal running of aero-hydraulic pump.
4. Aero-hydraulic pump weak imbalance fault experiment
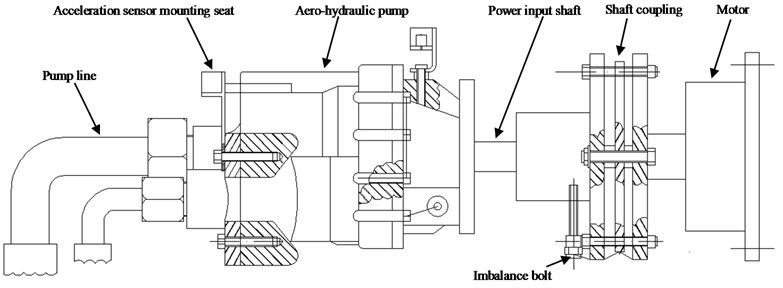
In this paper, all experiment data comes from some types of aero-hydraulic pumps shown Fig. 2, which is designed by Aero-engine Corporation of China (AECC) HARBIN DONGAN Engine CO., LTD. The hydraulic pump is swash-plate axial piston pump, and the numbers of plungers are nine. The coupler is used to connect hydraulic pump and driver motor because the shaft size cannot match between hydraulic pump and motor. The weakness imbalance fault is set in couple close to power input shaft of hydraulic pump by adding an imbalance bolt. The hydraulic pump and specific position of imbalance bolt is shown in Fig. 2. The size and weight of imbalance bolt is respectively M6*10 cm and 0.045 kg. The rotating speed measured by SE series eddy current displacement sensors which is provided by instrument factory Southeast University. Data collector Model is USB9234 provided by National Instruments. The acceleration sensor is installed on mounting seat of aero-hydraulic pump, and the direction is vertical, which is shown in Fig. 2.
Fig. 2Imbalance fault experiment of aero-hydraulic pump
Experiment data of weakness imbalance fault is randomly selected, and the rotational speed is about 2500 r/min; all the 1T-4T respectively represents 1-4 integer multiple rotating frequency; all scheme A is corresponding with the traditional analysis method at present as shown in Fig. 1(a); all scheme B is corresponding with proposed new method as shown in Fig. 1(b) which is marked by orange in this paper; all scheme C is corresponding with proposed new method as shown in Fig. 1(b) which is marked by orange and pink in this paper; (the scheme B and C is the same before Hilbert envelope spectrum. The difference is that the Hilbert envelope spectrum of auto-correlation function of velocity signal is directly used to identify fault in scheme B; while the energy ratio obtained by Hilbert envelope spectrum is calculated and used to identify fault in scheme C) the polynomial-fitting orders 13 is selected by comparing according to the method that is proposed in the reference [14] involved in the paper.
5. Aero-hydraulic pump weakness imbalance fault identification
5.1. Traditional studied: scheme A – Fig. 1(a)
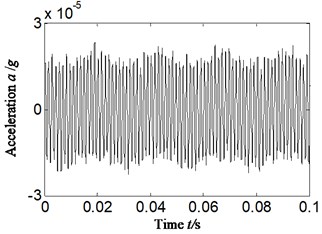
We randomly take the weakness imbalance fault data collected by the accelerometer in vertical direction as an example for analysis. The rotating speed is 2469 r/min and the rotating frequency is 41.2 Hz by calculating (1469/60 = 41.2). The fuel feeding pulse frequency is equal to 370.8 Hz (nine times of rotation frequency as the number of plungers is nine). The Hilbert envelope spectrum of casing acceleration signal is obtained and the result is shown in Fig. 3, 4. The Fig. 3 is the time domain of acceleration signal. Fig. 4 is the Hilbert envelope spectrum and its local amplification corresponding with Fig. 3.
Fig. 3Time-domain of acceleration signal-imbalance fault occurrence
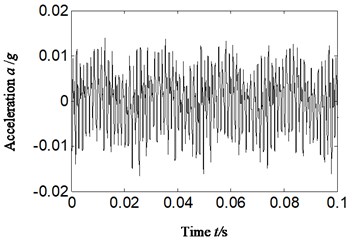
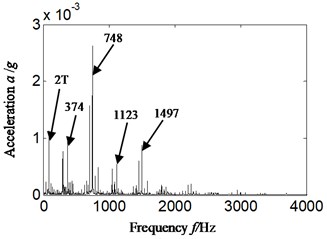
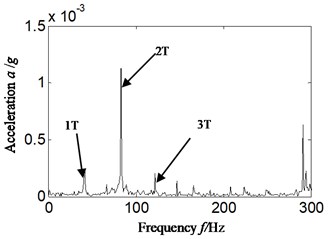
Fig. 4Hilbert envelope spectrum and its local amplification for: a) Hilbert envelope spectrum, b) Hilbert envelope spectrum local amplification-imbalance fault occurrence: scheme A
a)
b)
Analyzing Fig. 4, the following conclusions can be draw:
1) In Fig. 4(a), the fuel feeding pulse frequency (374 Hz) and its frequency multiplication is highlighted, and meanwhile, the twice rotation frequency is also more significant.
2) The Fig. 4(b) is the Hilbert envelope spectrum local amplification of Fig. 4(a) in low-frequency band. Analyzing Fig. 4(b), it can find that twice rotation frequency is more significant than rotation frequency itself, which is not matching with the imbalance fault set of aero-hydraulic pump (the amplitude of rotation frequency is significantly increased and highlighted when imbalance fault occurs).
The misdiagnosis would probably be caused if acceleration signal is selected directly to identify and diagnose fault types of rotor system just like Fig. 4(a), (b). In Fig. 4(a), (b), the twice rotation frequency is more significant than rotation frequency itself, and the other fault types, such as misalignment, sliding boots loose instead of imbalance fault can probably be considered, and thereby leads to the misdiagnosis.
Analyzing the reason according to Eq. (5), (6), it can be found that comparing with velocity signal, the amplitude has been enlarged times in acceleration signal. The frequency is higher (the is larger), and the enlargement effect is more significant. Meanwhile the vibration identification standard for faults of rotor system is usually according to velocity or displacement signal [10] rather than acceleration signal.
5.2. Proposed new method: Scheme B-Fig. 1(b) (marked by orange)
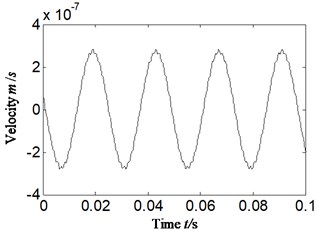
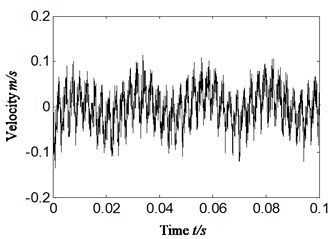
Considering that vibration identification standard for faults of rotor system is usually based on velocity or displacement signal rather than acceleration signal [10]. The misdiagnosis would probably be caused if acceleration signal is selected directly to identify and diagnose fault types of rotor system just like Section 5.1. According to the above considerations, the velocity signal is obtained by combining integral with polynomial least square fitting method. For comparing, the same data as Section 5.1 is selected, and the result is shown in Fig. 5, 6. The Fig. 5 is the time domain of velocity signal. Fig. 6(a), (b) is respectively Hilbert envelope spectrum and its local amplification corresponding with Fig. 5. The velocity signal that obtained by using integral combining with polynomial least square fitting method and the polynomial-fitting orders is 13.
Fig. 5Time-domain of velocity signal-imbalance fault occurrence
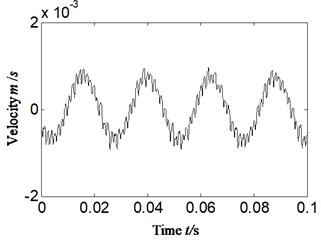
Fig. 6Hilbert envelope spectrum and its local amplification of velocity signal -imbalance fault occurrence for: a) Hilbert envelope spectrum, b) Hilbert envelope spectrum local amplification
a)
b)
After analyzing Fig. 6 and comparing with Fig. 4 (acceleration signal directly), the following conclusions can be drawn:
1) Hilbert envelope spectrum of velocity signal which is obtained according to acceleration signal, the component frequency is similar with acceleration signal to some degree (such as the same highlighted fuel feeding pulse frequency (374 Hz) and its frequency multiplication);
2) While the rotation frequency is more significant in Fig. 6 than Fig. 4. The amplitude enlargement effect of velocity signal has been decreased compared with acceleration signal.
However, the misdiagnosis would also probably be caused if velocity signal is analyzed just by Hilbert envelope analysis due to the influence of 2-3 times rotation frequency just like shown as Fig. 6.
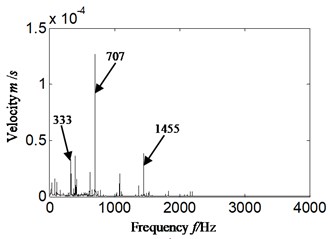
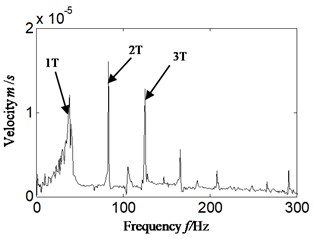
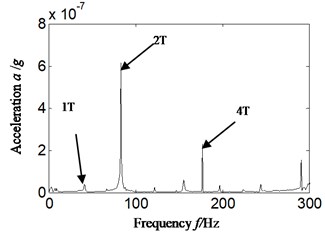
For further correctly and effectively identifying weak imbalance fault of aero-hydraulic pump based on casing vibration signal, the Hilbert envelope analysis is combined with auto-correlation analysis. In order to compare and analyze accurately, the same data is selected. The auto-correlation function includes acceleration signal and velocity signal is acquired. Meanwhile, the Hilbert envelope spectrum of auto-correlation function is acquired including acceleration signal and velocity signal. The result is shown in Figs. 7, 8. Fig. 7 and Fig. 8 is respectively auto-correlation function and its Hilbert envelope spectrum. Fig. 7(a)-Fig. 8(a) is corresponding with acceleration signal, and Fig. 7(b)-Fig. 8(b) is corresponding with velocity signal.
Analyzing Fig. 7, 8, the following conclusions can be drawn:
1) Compared with Fig. 4-6 (Hilbert envelope analysis only), in Fig. 8, no matter for casing vibration acceleration signal or velocity signal, the noise is significantly reduced in their auto-correlation function and Hilbert envelope spectrum. It is due to the de-noised function of auto-correlation function for cyclic signal.
2) Meanwhile, in the Fig. 8(a) the Hilbert envelope spectrum of auto-correlation of acceleration signal, the twice rotation frequency is the most significant in low frequency band. It is consistent with Fig. 4(b), and it is not matching with the imbalance fault set of aero-hydraulic pump. The misdiagnosis would also probably be caused if acceleration signal is selected to identify and diagnose fault types of aero-hydraulic pump.
3) In Fig. 8(b), the velocity signal obtained by converting acceleration signal, only the rotation frequency is highlighted in low frequency band. It is exactly matching the imbalance fault set of aero-hydraulic pump.
Fig. 7Auto-correlation function for: a) corresponding with acceleration signal, b) corresponding with velocity signal-imbalance fault occurrence
a)
b)
Fig. 8Hilbert envelope spectrum of auto-correlation function for: a) corresponding with acceleration signal, b) corresponding with velocity signal-imbalance fault occurrence: scheme B
a)
b)
To further analyze the reason, Fig. 8(a) is corresponding with acceleration signal which leads to the amplified frequency amplitude. Meanwhile the noise is reduced due to auto-correlation function, which leads to the result of Fig. 8(a). Fig. 8(b) is corresponding with velocity signal, and the frequency multiplication enlargement effect is greatly decreased. Meanwhile the noise is reduced due to auto-correlation function, which leads to the result shown in Fig. 8(b). It can be found that the weakness imbalance fault of aero-hydraulic pump cannot be identified and diagnosed when acceleration signal is directly selected. If acceleration signal is converted to velocity at first, and auto-correlation analysis is combined with Hilbert envelope analysis, the imbalance fault of aero-hydraulic pump can be identified and diagnosed effectively.
5.3. The weakness imbalance fault identification according to calculation energy ratio: scheme C
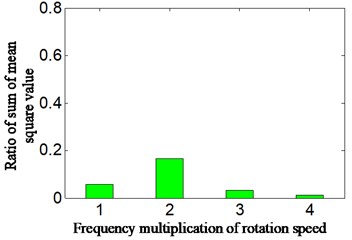
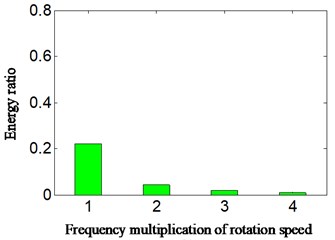
For further identifying and diagnosing the weakness imbalance fault of aero-hydraulic pump in easier and more visual method, the energy ratio of velocity is calculated. Meanwhile, in order to compare with velocity signal, the ratio of sum of mean square value in different selected frequency bands of acceleration signal is calculated. In view of the majority of faults of rotor system in rotation machine which certainly has manifestation on low order frequency multiplication of rotation frequency [10], the 1-4 frequency multiplication of rotate frequency is selected in this paper. The 1 to 4 are taken from subtracting 5 Hz to adding 5 Hz on the basis of calculation of rotation frequency, in the consideration that there is a deviation between theoretical calculation and practice obtaining. For example, suppose that rotation frequency is equal to Hz by calculation, and then the rotation speed band is selected from (5) Hz to (5) Hz, and double rotation frequency band is selected from (25) Hz to (25) Hz and so on. Total low-frequency band is selected from 0 Hz to 300 Hz in consideration that traditional aero-engine real-time monitoring frequency is not high and selected 1-4 times frequency is all contained (the 4T rotation frequency is equal to 4*41.2 = 164.8 Hz), and the result is shown in Fig. 9. Fig. 9(a) and Fig. 9(b) is respectively the ratio of sum of mean square value and energy ratio among different rotation frequency bands and total low frequency bands. Fig. 9(a) is corresponding with casing vibration acceleration signal, and meanwhile matching with scheme A. Fig. 9(b) is corresponding with velocity signal, and meanwhile matching with scheme C. The 1 to 4 of -axis respectively represents 1-4 multiplication rotation frequency.
Fig. 9Ratio value of different scheme for: a) acceleration signal-scheme A, b) velocity signal-scheme C
a)
b)
By analyzing Fig. 9, it can find that the following conclusions:
1) The nature of result shown is consistent among figures. While Fig. 9(a), (b) is more visualized than Fig. 4(b) and Fig. 8(b), they are shown the ratio value among 1 to 4 integer multiplication rotational frequencies and total low-frequency from 0 Hz to 300 Hz.
2) In Fig. 9(a) which is corresponding with acceleration signal and scheme A, the twice frequency of rotation speed is most highlighted than other multiplication frequencies, it is consistent with Fig. 4(b), which is also not matching with set imbalance fault of aero-hydraulic pump. The other fault types, such as misalignment, sliding boots loose instead of imbalance fault can probably be considered, and thereby leads to the misdiagnosis.
3) In Fig. 9(b) which is corresponding with velocity signal, the rotation frequency is more highlighted than other integer multiplication frequencies, and it is exactly consistent with set imbalance fault of aero-hydraulic pump.
The difference of calculation ratio value according to Hilbert envelope spectrum is highlighted between acceleration and velocity signal. The calculation of specific number of different multiplication frequencies according to acceleration signal and velocity signal is shown Table 1. All the 1T-4T respectively represent 1-4 integer multiple rotating frequency; all scheme A corresponding with the traditional analysis method (scheme A). All scheme C corresponding with proposed new method combined with Hilbert envelope spectrum and auto-correlation analysis.
Analyzing further according to Table 1, it can find that the ratio value of rotation frequency is 0.057 that is corresponding with acceleration signal marked by blue based on scheme A. The ratio value of rotation frequency is small and not matching with set imbalance fault. Namely, it cannot identify and diagnose the weakness fault of aero-hydraulic pump based on casing vibration acceleration signal according to Hilbert envelope analysis.
Table 1Ratio value based on different analyze method
Signal types | Different scheme | Multiplication frequency of rotation speed | |||
1T | 2T | 3T | 4T | ||
Acceleration signal | Scheme A | 0.057 | 0.167 | 0.033 | 0.010 |
Velocity signal | Scheme C | 0.221 | 0.042 | 0.019 | 0.008 |
However, the energy ratio of rotation frequency corresponding to velocity signal is 0.221 (marked in red basic on scheme C). The ratio value of rotation frequency is increased from 0.057 which is corresponding with acceleration signal and analyzed by scheme A to 0.221 which is corresponding with velocity signal and analyzed by proposed new method. The highlighted ratio value of rotation frequency is exactly matching with set weakness imbalance fault of aero-hydraulic pump. That is, it was matched with set fault of aero-hydraulic pump based on proposed new methods.
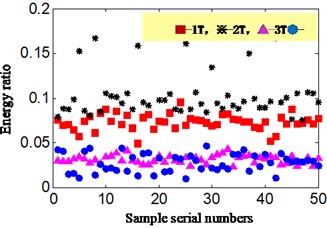
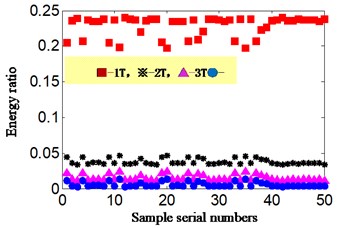
In order to verify the effectiveness and consistency of the proposed new method, the fifty groups data is randomly selected and respectively calculated and analyzed by traditional analysis method (scheme A) and proposed new method (scheme C). The result is shown in Table 2, 3 and Fig. 10. The Table 2 and Table 3 is the 10 groups ratio value which selected randomly from 50 groups date. Meanwhile, the Table 2 and Table 3 is respectively corresponding with traditional analysis method (scheme A) and proposed new method (scheme C). All the 1T-4T respectively represent 1-4 integer multiple rotating frequency; Fig. 10 is the ratio value distribution diagram of selected 50 group date. Fig. 10(a) and Fig. 10(b) is respectively corresponding with traditional research method and proposed new method, and “∎”, “※”, “∆”, and “•” respectively represents the ratio value of 1-4 times rotation frequency band in Fig. 10.
Table 2Ratio of sum of mean square value according to acceleration signal: scheme A
Frequency band | 1T | 2T | 3T | 4T |
Sample number | ||||
1 | 0.078632 | 0.095693 | 0.025842 | 0.038186 |
2 | 0.080782 | 0.10016 | 0.036583 | 0.020041 |
3 | 0.066883 | 0.09981 | 0.027547 | 0.035887 |
4 | 0.081108 | 0.082662 | 0.032035 | 0.035165 |
5 | 0.070865 | 0.094358 | 0.030028 | 0.044432 |
6 | 0.081389 | 0.091382 | 0.031962 | 0.013943 |
7 | 0.070502 | 0.094347 | 0.037325 | 0.020138 |
8 | 0.075507 | 0.088422 | 0.033839 | 0.036911 |
9 | 0.081727 | 0.088363 | 0.038981 | 0.023991 |
10 | 0.069481 | 0.088715 | 0.02914 | 0.040883 |
Mean value of 50 samples | 0.074472 | 0.099508 | 0.03232 | 0.027364 |
From Table 2, 3 and Fig. 10, the following conclusions can be drawn:
1) The consistency of calculation ratio value of each method is excellent whether acceleration signal is analyzed by scheme A or velocity signal is analyzed by scheme C (Hilbert envelope analysis combined with auto-correlation analysis).
2) Meanwhile, the consistency of Fig. 10(b) which is corresponding with velocity signal and proposed new method is more excellent than Fig. 10(a) which is corresponding with acceleration signal and traditional research method (scheme A).
3) In Table 2 and Fig. 10(a), the specific mean value of 50 samples of acceleration signal is about 0.074, 0.10, 0.032 and 0.027 for 1-4 times rotation frequency. The ratio of sum of mean square value of double rotation frequency band is the largest, which does not match set imbalance fault, and misdiagnosis could probably be caused.
4) In Table 3 and Fig. 10(b), the specific mean energy ratio of 50 samples of velocity signal is about 0.228, 0.038, 0.015 and 0.006 for 1-4 times rotation frequency. The energy ratio of rotation frequency band is more obvious and the largest, and it is exactly consistent with imbalance fault set of aero-hydraulic pump.
Table 3Energy ratio according to velocity signal: scheme C
Frequency band | 1T | 2T | 3T | 4T |
Sample number | ||||
1 | 0.20407 | 0.044677 | 0.022163 | 0.0116 |
2 | 0.23573 | 0.035718 | 0.012898 | 0.003976 |
3 | 0.23925 | 0.03387 | 0.011664 | 0.003157 |
4 | 0.20642 | 0.044516 | 0.021852 | 0.011287 |
5 | 0.23703 | 0.03504 | 0.012276 | 0.003658 |
6 | 0.23486 | 0.036336 | 0.013553 | 0.004316 |
7 | 0.23497 | 0.036534 | 0.013507 | 0.004343 |
8 | 0.23763 | 0.034494 | 0.012074 | 0.00344 |
9 | 0.20448 | 0.044548 | 0.02218 | 0.011527 |
10 | 0.23653 | 0.035777 | 0.013116 | 0.003943 |
Mean value of 50 samples | 0.228341 | 0.037912 | 0.015253 | 0.005866 |
Fig. 10Ratio value based on different sample for: a) corresponding with acceleration signal: scheme A, b) corresponding with velocity signal: scheme C
a)
b)
5.4. Status monitor and identification on the status of aero-hydraulic pump normal running: proposed new method
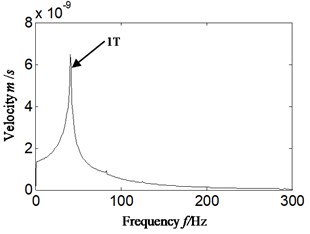
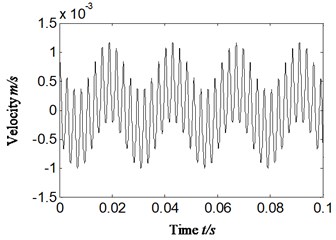
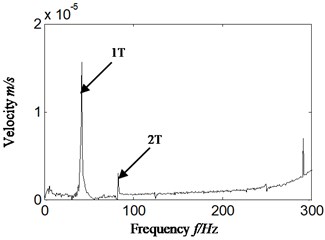
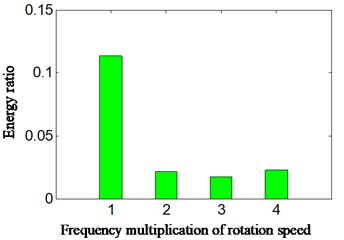
In normal running state of aero-hydraulic pump, we convert acceleration signal to velocity signal by the same method of Section 5.1-5.3 where integral is combined with polynomial least square fitting method and the polynomial-fitting order is also 13. The energy ratio is calculated based on proposed method according to obtained velocity signal. The rotation speed is 2346.2 r/min and the rotation frequency is equal to 39.1 Hz by calculation (2378.3/60 = 39.1). The result is shown in Fig. 11 and Table 4. The Fig. 11(a) is the transformed velocity, and the Fig. 11(b) is the auto-correlation function of velocity, and Fig. 11(c) is the Hilbert envelope spectrum of auto-correlation function of velocity signal, and Fig. 11(d) is the calculation energy ratio based on proposed scheme C. The Table 4 is the specific value of calculation energy ratio.
Analyzing the Fig. 11 and Table 4, and meanwhile comparing with weakness imbalance fault occurrence of aero-hydraulic pump, the following conclusions can be drawn:
The energy ratio of rotation frequency is equal to 0.113 on the normal running status of aero-hydraulic pump. While the ratio value is about equal to 0.228 (the mean value of energy ratio of 50 group samples shown is Table 3) on the weakness imbalance fault occurrence, which exceeds the twice of normal running condition. In the similar running environment, the energy ratio is also approximate, and therefore the sharp increased energy ratio can be used to identify weakness imbalance fault occurrence.
Fig. 12Scheme C-normal running of aero-hydraulic pump for: a) velocity signal, b) auto-correlation function of velocity signal, c) Hilbert envelope spectrum of auto-correlation function of velocity signal, d) energy ratio based on scheme C
a)
b)
c)
d)
Table 4Energy ratio based on proposed method (scheme C) on the condition of normal running of aero-hydraulic pump
Signal types | Scheme | Frequency multiplication of rotation speed | |||
1T | 2T | 3T | 4T | ||
Velocity signal | Scheme C | 0.113 | 0.022 | 0.017 | 0.023 |
6. Conclusions
A method of combining auto-correlation function with Hilbert envelope analysis is proposed and used to identify weakness imbalance fault of aero-hydraulic pump on the conditions of weakness imbalance fault occurrence and normal running. Meanwhile, the energy ratio can be calculated according to Hilbert envelope spectrum of auto-correlation function of velocity signal. The results show the following features:
1) The comparative analysis is implemented between Hilbert envelope analysis of acceleration signal and proposed new method of velocity signal. The result shows that either Hilbert envelope spectrum or calculation energy ratio corresponding with velocity signal can identify the weakness imbalance fault of aero-hydraulic pump correctly and perfectly based on proposed new method.
2) While the acceleration signal cannot directly identify the weakness imbalance fault of aero-hydraulic pump according to either Hilbert envelope spectrum or calculation energy ratios due to the amplitude enlargement effect of acceleration signal itself to frequency multiplication. It will lead to missing diagnosis or misdiagnosis if acceleration signal is directly used to identify and diagnose fault types of aero-hydraulic pump.
3) The excellent consistency of proposed new method is verified by 50 groups of difference fault samples.
4) Finally, the comparative analysis is carried out between normal running and the operation with weakness imbalance fault occurrence of aero-hydraulic pump based on proposed methods. The result shows that the energy ratio calculated based on proposed new method can effectively identify and diagnose if the weakness imbalance fault occurs in aero-hydraulic pump.
The method should require further study in terms of the following aspects:
The proposed research method in this paper should be inspected in the actual project. The proposed method was inspected just by data of the aero-hydraulic pump. As the real aero-engine structure is far more complex than experiment rig, and there are many types of external noises and vibrations in real flight, actual project inspection is required to determine the efficiency of extracting casing characteristics.
References
-
Muszynska A., Goldman P. Chaotic responses of unbalance rotor bearing stator systems with looseness or rubs. Chaos, Solitons and Fractals, Vol. 5, Issue 9, 1995, p. 1683-1704.
-
Huang Jinping, Ren Xingmin A novel method of identifying the imbalance of flexible rotor with one disc. Journal of Aerospace Power, Vol. 23, Issue 2, 2008, p. 293-298.
-
Liu Yujiao, Yao Entao, Xu Hongzhuan Fault diagnosis of hydraulic pump based on particle filtering and auto regressive spectrum. Chinese Journal of Scientific Instrument, Vol. 33, Issue 3, 2012, p. 561-567.
-
Li H. Performance test and fault diagnosis of encapsulated hydraulic system. Journal of Electronic Measurement and Instrument, Vol. 18, 2004, p. 950-953.
-
Gao Yingjie, Kong Xiangdong, Zhang Qin Wavelet packets analysis based method for hydraulic pump condition monitoring. Journal of Mechanical Engineering, Vol. 45, Issue 8, 2009, p. 80-88.
-
Tang Hong Bin, Wu Yun Xin, Hua Guang Jun, et al. Fault diagnosis of pump using EMD and envelop spectrum analysis. Journal of Vibration and Shock, Vol. 31, Issue 9, 2012, p. 44-48.
-
Wu Deng, Shengjie Zhang, Huimin Zhao, et al. A novel fault diagnosis method based on integrating empirical wavelet transform and fuzzy entropy for motor bearing. IEEE Access, Vol. 6, 2018, p. 35042-35056.
-
Wu Deng, Rui Yao, Huimin Zhao, et al. A novel intelligent diagnosis method using optimal LS-SVM with improved PSO algorithm. Soft Computing, 2017, https://doi.org/10.1007/s00500-017-2940-9.
-
Kostyuka A. G., Shatokhinb V. F., Volokhovskayac O. A. Motion of an imbalanced rotor when it rubs against the stator. Thermal Engineering, Vol. 59, Issue 2, 2012, p. 87-95.
-
Chen Guo An Introduction to Detection and Diagnostic Technology of Aircraft. Chinese Civil Aviation Press, Beijing, 2007.
-
Gao Xiaorong, Li Jinlong, Peng Chaoyong Sensor Technology. Southwest Jiaotong University Press of China, Chengdu, 2013.
-
He Peng Ju, Feng Liang Study on the real-time elimination method of random noise and trend terms in acceleration signal. Electronic Design Engineering, Vol. 21, Issue 14, 2013, p. 18-22.
-
Gu Mingshen, Lv Zhenhua Identification of a mechanism’s vibration velocity and displacement based on the acceleration measurement. Mechanical Science and Technology for Aerospace Engineering, Vol. 30, Issue 4, 2011, p. 522-526.
-
Yu Mingyue, Feng Zhigang, Huang Jiajing, et al. Aero-engine rotor-stator rubbing position identification based on casing velocity signal. Journal of Vibroengineering, Vol. 18, Issue 4, 2016, p. 2123-2134.
-
Lei Ya Guo Machinery fault diagnosis based on improved Hilbert-Huang transform. Journal of Mechanical Engineering, Vol. 47, Issue 5, 2011, p. 71-77.
-
Chen Jin, Dong Guangming Cyclostationary Theory and Method of Mechanical Fault Characteristic Extraction. Shanghai, Shanghai Jiao Tong University Press, 2013.
-
Kak S. The discrete Hilbert transform. Proceedings of the IEEE, Vol. 58, 1970, p. 585-586.
-
Padala S. K., Prabhu K. M. M. Systolic arrays for the discrete Hilbert transform. IEE Proceedings - Circuits, Devices and Systems, Vol. 144, 1997, p. 259-264.
-
Schreier P., Scharf L. Statistical Signal Processing of Complex-valued Data: The Theory of Improper and Noncircular Signals. Cambridge University Press, Cambridge, 2010.
Cited by
About this article

This work was supported by National Natural Science Foundation of China (Grant No. 51605309), Aeronautical Science Foundation of China (Grant No. 20163354004) and Provincial Education Department of Liaoning Province of China (Grant No. L201628).
Mingyue Yu: the novel method research and analysis, data processing, the manuscript compiling and revising. Jincai Cheng: experimental measurement. Pan Hui: weakness imbalance fault scheme design of aero-hydraulic pump. Runze Zhang: data acquisition and dynamic analysis of weakness imbalance of aero-hydraulic pump. Zeli Lin: experimental measurement and weakness imbalance fault scheme design of aero-hydraulic pump.
