Abstract
The verification and validation (V&V) has been identified as a key step in quantifying and building confidence of IVHM system to inform about equipment or component health status and ensure safe and reliable application of IVHM system to military and industrial areas. The paper introduces the definition of IVHM and main methods of V&V. Besides, the key aspects of V&V are reviewed including the data sources and performance metrics as well as the challenges.
1. Introduction
The Integrated Vehicle Health Management (IVHM) system is being attached more and more importance as the significant basis of the autonomic logistics system adapting to high-tech local wars in the 21st Century. Having gone through anomaly detection, diagnostics and prognostics and immerged with the state of arts reasoning technologies, IVHM system monitors and controls the function of critical systems and subsystems/components in order to improve the effectiveness of the maintenance and decision-support system, reduce the cost of run and logistics, and decrease probability of the occurrence of catastrophic incidents.
There are more and more attentions in the architecture, algorithms and prototypes of IVHM recently. However, due to generally no rigorously universal methods and no statistically adequate data available, V&V technology remains a challenging open problem. With the support of Defense Advanced Research Projects of America, NASA and other university institutes have obtained some research achievements already. In order to verify and validate specific IVHM system, various types of data sources with different levels of fidelity can be utilized. Also, universal metrics for fault detection, isolation and prediction are important for the effectiveness assessment of IVHM system.
The paper is organized as follows. Section 2 presents the methods of V&V. In Section 3, data sources and metrics are indicated. Conclusions and challenges are followed in Section 4.
2. V&V Methods of IVHM
As shown in Fig. 1, IVHM can monitor the condition of the outside environment, structure, Engine and airborne systems. Besides, IVHM contains seven function layers such as sensor, data processing, monitoring, assessment, prediction, decision and expression. It is a comprehensive system to use all the information including aircraft operation monitoring data, fault data, ground-test data, maintenance data and design documents to diagnose the failure, predict the RUL (residual useful life) and make maintenance decision to prevent accidents and reduce the cost [1].
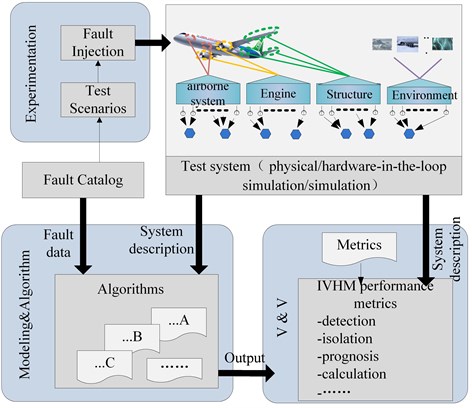
The framework architecture employed for IVHM V&V is shown in Fig. 2. Major elements are the physical system, diagnosis and prognosis algorithms, scenario-based experiments, and performance metrics. The physical system description and sample data (nominal and faulty) are provided to algorithm and model developers to build the models. System documentation in special format specifies the components, connections, and high-level mode behavior descriptions, including failure modes. A diagram with component labels and connection information is also provided. The fault catalog, part of the system documentation, establishes the failure modes that may be injected into experimental test scenarios and diagnosed by the algorithms. The output of the experiment is used to be quantitatively evaluated according the predefined metrics which will be introduced in the next chapter [2].
Fig. 1The scale and function of IVHM
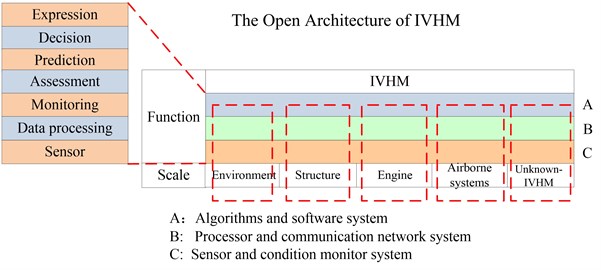
Fig. 2V&V methods
3. Data sources and metrics for V&V
The evaluation process will be capable of assessing IVHM technologies in terms of their ability to detect, diagnose and predict the failure progression of faults. The key factors of IVHM V&V include the system interface, data source and metrics, as shown in Fig. 3. The set of metrics are in conjunction with a database of data from testing, simulation or in-service according the interface standards. The database and performance metrics will be discussed.
3.1. Data sources for V&V
In order to perform validation and verification of specific IVHM algorithms or technologies, various types of data sources with different levels of fidelity can be utilized. From a PHM (Prognostic and Health Management) algorithm designers perspective, some of the most desired data sets would come from either seeded fault testing, accelerated mission testing or actual field data from the entire system where detailed loading profiles are known and selected parameters were monitored that are correlated with the progression of the failure. However, these types of data sets are typically expensive to obtain and hence only typically represent less than 10 % of the data sets required for performing a comprehensive V&V program [3]. In order to supplement these more comprehensive data sets, subsystem or component rig tests can be performed that is more cost effective but limited in applicability and realism. Also, dynamic models with different levels of fidelity can be used to simulate fault signatures and provide data at any desired sampling rate. There are obviously many benefits to the simulate-based approach but many drawbacks as well. Table 1 details these pros and cons of these various data sources and their applicability for V&V of IVHM.
Fig. 3Key aspects of V&V
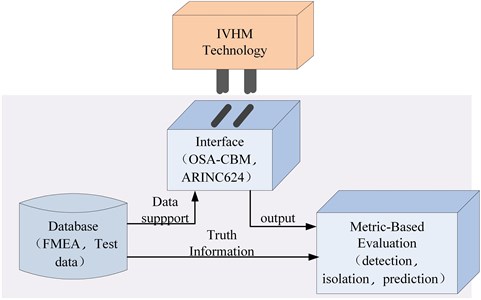
Table 1Description of different data sources
Method | Description | Benefit | Drawback |
Simulation models and fault generation | Signals, noise and fault signatures simulated mathematically | Ideal for generalizing signals and noise, partially overcomes small sample problem | Data may not always be realistic, model may be expensive to develop to reliably simulate. |
Component and LRU fault and failure tests | Use data collected on component or subscale test rigs | Real seeded fault, natural fault, and fault progression data available at little cost to program | Limited applicability for actual system fault observability |
Subsystem/System fault characterization tests | Tests on stands using actual subsystem hardware | Somewhere realistic data, usually well controlled and documented with ground truth information | Seeded faults may not be entirely realistic of natural fault |
Limited vehicle data evaluation | Dedicated missions for normal and off-normal test and evaluation | Realistic data of normal and some performance faults. | Expensive, doesn’t cover full range of potential conditions, no critical faults or progression |
Technology Maturation Field Program | Data collection and tests during vehicle service | Covers full range of vehicle mission, operation, and environmental conditions | Limited to opportunistic fault occurrence. Delays use and implementation in field |
3.2. Performance metrics for V&V
Fault detection, diagnostic and prognostic technology metrics should reflect all of the performance and effectiveness characteristics that influence their value to the overall IVHM system. Performance metrics need to quantify how well a technology responds to changes in normal operation in terms of the ability to detect anomalies, isolate a root cause fault or failure mode or predict the time to a given fault/failure condition.
Table 2Performance metrics
Capability | Metrics | Description |
Fault detection metrics | Fault detection rate | Fault Detection Rate is the percentage that the number of detected fault correctly occupies the number of fault occurred of the measure unit. The metric can indicate the detection capability of the system/equipment |
Mean detection time | It is the mean time to detect and alarm when fault happens. The metric can indicate the effectiveness of detection | |
Max detection time | It is the max time to detect and alarm. The metric can indicate the worst case of detection | |
Fault detection rate of a single fault | It is the percentage that the number of correct detection occupies the number of a single fault occurred | |
False alarm rate | Within the prescribed time, the false alarm rate is the percentage that the number of false alarm occupies the total number of fault at the same time. False alarm is divided into misstatement (indicate B when A failure) and false declaration (indicate failure when no failure occurs) | |
Fault isolation metrics | Fault isolation rate | It is the percentage that the fault number isolated to the specified number of LRUs occupies the fault number detected at the same time |
Mean time of isolation | It is defined as the mean time from the beginning to the end of isolation. Fault isolation time is usually the longest and difficult to predict during the artificial or off-line maintenance | |
Max isolation time | It is defined as the max time from the beginning to the end of isolation. The metric can indicate the effectiveness of isolation | |
Max fuzzy set | Fuzzy set is the units with fault. The metric can indicate the worst case of isolation | |
Fault prognosis metrics | Accuracy | Accuracy is a measure of how close a point estimate of failure time is to the actual failure time. The metrics include mean error, mean absolute error, variance absolute error, mean absolute value relative error, relative error of variance and correlation coefficient |
Precision | Precision is a measure of the narrows of an interval in which the remaining life falls. The accuracy is the highest when the predicted failure time is equal to the actual failure time | |
Robustness | Robustness is defined as the sensitivity which measures how sensitive the prognostic algorithm is to input changes or external disturbances | |
Timeliness of the predicted time to failure | It is defined to account for the impact of the timeliness of the predicted time to failure (TTF), that is, the probability density function’s relative position along the time axis with respect to the occurrence of the actual failure event | |
Calculate metrics | It is important for online prediction. The metrics include mean of the prediction-to-failure time and max of prediction-to-failure time | |
Effectiveness metrics | Cost-benefit | The benefits achieved through accurate detection, fault isolation, and prediction of critical failure modes are weighed against the costs associated with false alarm, inaccurate diagnoses/prognoses, licensing costs, and resource requirements of implementing and operating specific techniques |
Specifically, prognostic metrics should be capable of evaluating prediction time accuracy in terms of remaining useful life or system degradation levels. Overall performance of an IVHM system that consists of diagnostic and prognostic modules may then be estimated as the weighted sum of performance metrics and cost/benefit analysis considerations. Table 2 illustrates the main performance metrics of IVHM [4].
4. Conclusions
V&V has been identified as a key step in quantifying and building confidence of IVHM system to inform about equipment or component health status. The main method, data sources and metrics were illustrated in the paper. However, there are several challenges for V&V technology. Firstly there is no set of methods and tools developed to provide a comprehensive approach. Secondly, there is no statistically adequate data and perfect metrics for V&V in military and industrial areas. Thirdly, it is difficult in establishing standards to perform V&V for IVHM.
Given the current state that we are still at the design stage of IVHM, it is important to develop V&V as soon as possible to speed up the process of IVHM on our civil aircraft. It is hoped that the review presented in the paper will be useful to the researchers in V&V area for IVHM.
References
-
Wang Yi, Zhao Guangtao, Liu Zhifang, Qing Xinlin The review of the integrated vehicle health management. Civil Aircraft Technology Highlights, Vol. 3, 2012, p. 4-6.
-
Wu Mingqiang The integrated engineering environment of IVHM. Computer Measurement and Control, Vol. 19, Issue 5, 2011, p. 98-101.
-
Roemer J. M., Dzakowic J., Orsagh R. F. Validation and verification of prognostic and health management technologies. Proceedings of IEEE Aerospace Conference, 2005, p. 3941-3947.
-
Saxena A., Celaya J., Saha B. Evaluating algorithm performance metrics tailored for prognostics, Proceedings of the Aerospace Conference, 2008.
About this article

This work was supported by Beijing Municipal Science and Technology Commission Fund (Z121100000212020) and China Postdoctoral Science Foundation (No. 2013M541575).
