Abstract
The increasing importance of considering structural scale effects demands better understanding of such effects and their influence on structural properties. To this end, two models of the full-scale Xiaowan Arch Dam, at 1/1500-scale and 1/3000-scale units respectively, are elaborated to numerically and experimentally investigate scale effects on structural dynamic properties and responses. From the experimental aspect, experimental modal analysis shows that the natural frequency of the small arch dam model is greater than that of the large arch dam model, and the two models have similar mode shapes. Five different levels of excitation are used to clarify the random response characteristics of the models, with similar maximal velocity responses in the vertical and horizontal directions observed in all cases. From the numerical aspect, the finite element method is used to analyze the structural dynamic properties and responses of the corresponding simulated arch dam models. The numerical maximum velocity responses have the same orderliness as those from the experiments, indicating the effectiveness of numerical simulation in analyzing size effects on structural dynamic properties and responses.
1. Introduction
In many scientific and technical fields dealing with complex or large structures it can be impossible to study the behavior of the real structure because of constraints on economics, time, and laboratory space. In this situation, small-scale models are commonly built to function as alternatives of the real structure. Unfortunately, small-scale models do not necessarily represent the behavior of full-scale structures due to the possible scale effects. Consequently, examination of the scale effects is essential before employing test results from small-scale models to predict the behavior of full-scale structures [1], with the intention of revealing the scaling law and physical similitude relating the small-scale models to the full-scale structure [2, 3]. Scale effects and their influence on structures have been investigated extensively. Morquio et al. [4] presented experimental and theoretical evidence of the joint influence of size and strain rate on the mechanical properties of steel. Rios et al. [5] used the discrete element approach to analyze the size effects of reinforced concrete structures. Tjernlund et al. [6] investigated the effect of glass sphere size on the development of damage in tensile loaded epoxy. Zhang et al. [7] conducted an experimental program consisting of three groups of 11 specimens to investigate the possible cause of the size effect, which is typically represented by a reduction in shear strength along with an increase in deep beam height. Viso et al. [8] investigated the influence of the shape and size of specimens on the compressive strength of high-strength concrete. Cedolin et al. [9] dealt with the identification of concrete fracture parameters through indirect methods based on size effect experiments. Man et al. [10] studied size effects on the structural strength of concrete prisms subjected to three-point bending using an extended lattice model containing a realistic aggregate structure of concrete, with a size effect of aggregate densities and shapes on structural strength observed. Yi et al. [11, 12] investigated the effects of specimen size, specimen shape, and placement direction on the compressive strength and ultimate strength of concrete. Yazıcı and Sezer [13] studied the influence of size and capping type of cylindrical specimens on the compressive strength of concrete. An et al. [14] inspected the coefficient and law of the size effect of RPC through experiments and theoretical analysis. Elicesa and Rocco [15, 16] analyzed the influence of the aggregate size and shape on the fracture energy, tensile strength, and elasticity modulus in different types of concrete. Meddaha et al. [17] combined four granular fractions in different proportions to investigate the effect of the particle size distribution of aggregate on the properties of concrete. Bažant [18] studied the size effect in shear failure of reinforced concrete. Ungbhakorn and Singhatanadgid [19] explored the scaling law for physical modeling of generally laminated doubly curved shallow shells for free vibration response by applying the similitude transformation to the governing total energy of the system. Kotsovos and Pavlović [20] designed a programme of investigation into the causes of size effects in the behavior of structural-concrete.
Most existing studies have focused on the scale effects of structural static properties, with little concern for structural dynamic properties and responses. For structures operating in dynamic environments, better understanding is needed of the scale effects of those dynamic properties and responses. For this reason, this study targets experimental and numerical investigation of the scale effects on structural dynamic properties and responses, using two scale arch dam models as illustrations.
2. Scale effects on dynamic properties
2.1. Theoretical basis
Operating deflection shape (ODS), a specific type of structural vibration pattern, is defined as the deflection of a structure at a particular frequency [21]. ODS is the actual vibration displacement pattern of a structure that vibrates in the steady-state condition in response to a specific structural loading [22, 23]. When the loading is a harmonic excitation at the natural frequency of the structure, the particular ODS is commonly referred to as a mode shape from the perspective of experimental modal analysis. A scanning laser Doppler vibrometer (LDV) can be used to measure the vibration response for generating an ODS. The use of the LDV as a vibration transducer offers various advantages because of its remarkable capabilities of automation, high sensitivity, high spatial resolution, noncontact, etc., compared with conventional tools [24, 25]. These features can improve the quality and efficiency of ODS testing.
The motion equation for a linear structure with sinusoidal excitation forces acting on the structure is as follows:
where , is time; , , and are the mass, damping, and stiffness matrices, respectively; is the displacement vector, and is the real part of the forces. The sinusoidal forces are applied with possibly complex magnitude vectors at the excitation frequencies , where the superscript denotes the th forcing term. To solve Eq. (1) for the steady-state response, the displacement response is assumed to be:
Thus, the velocity response is:
The scanning function of a LDV can measure structural vibration patterns effectively. The model in the study was initially excited with a periodic chirp of various frequency bandwidths to determine the resonant frequencies. The resonant frequencies were obtained based on the peaks in the frequency response function. When the model was excited at a resonant frequency, the maximum deflection was acquired by the LDV, leading to a mode shape of the structure.
2.2. Experimental procedure and results
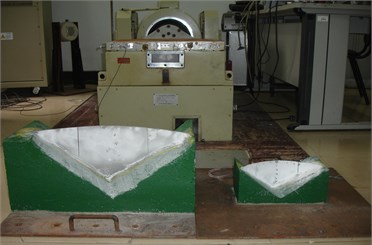
Xiaowan Arch Dam in China, the world's second highest arch dam at 292 m (958 ft), is used as the prototype to investigate the scale effects on structural dynamic properties. One 1/1500-scale units model and another 1/3000-scale units model are designed to model the full-scale Xiaowan Arch Dam as accurately as possible. The large model measures 600 mm×300 mm×250 mm and the small model measures 300 mm×150 mm×125 mm in the length, width, and height directions, as shown in Fig. 1. Each model consists of the dam body and the foundation. The dam body is made of organic glass and the foundation material is concrete. The material parameters of the organic glass are: Young’s modulus 6.4 GPa; density 1190 kg/m3; Poisson’s ratio 0.21. The material parameters of the concrete are: Young’s modulus 14.0 GPa; density 1930 kg/m3; Poisson’s ratio 0.17. Two contraction joints of the model are simulated by two 1 mm wide cracks. The base excitation at a natural frequency is exerted using an electromagnetic vibration system controlled by a COMET USB shaker control system. While the model is vibrating, data acquisition and analysis are performed using a LDV (PSV-400) to measure the mode shape of the model. These sequential operations establish the basic procedure of the experimental modal analysis.
Fig. 11/1500-scale (large) and 1/3000-scale (small) models of full-scale Xiaowan Arch Dam
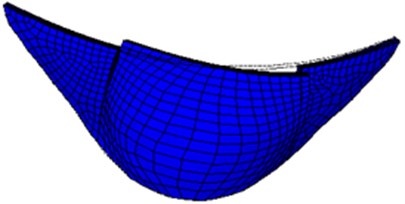
Experimental modal analysis is conducted to compare the vibration patterns between the two scale models. An excitation at the natural frequency of the model is introduced at an acceleration level of 5 m/s2. The first-order and second-order resonant frequencies of the two models are obtained using a LDV, as listed in Table 1. The corresponding mode shapes are plotted in Figs. 2 to 5. From the table and figures, it can be seen that the mode shapes of the two models are similar, but the first-order natural frequency of the small model is 114.5 % higher than that of the large model, and the second-order natural frequency of the small model is 65.1 % higher than that of the large model. The differences between the models for the first and the second natural frequencies are occasioned by the scale effect of the models.
Table 1Experimentally obtained resonant frequencies (Hz)
Case | Large model | Small model |
First-order frequency | 916.9 | 1906.3 |
Second-order frequency | 1328.4 | 2176.1 |
Fig. 2First-order mode shapes of large model in experimental analysis
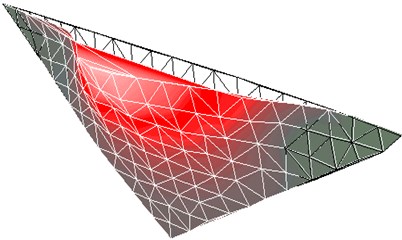
Fig. 3Second-order mode shapes of large model in experimental analysis
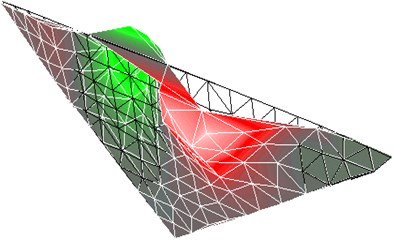
Fig. 4First-order mode shapes of small model in experimental analysis
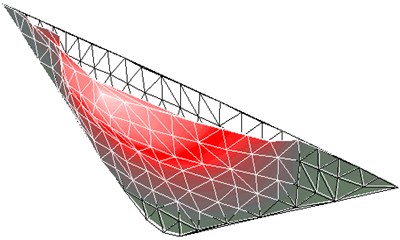
Fig. 5Second-order mode shapes of small model in experimental analysis
2.3. Numerical simulation results and discussion
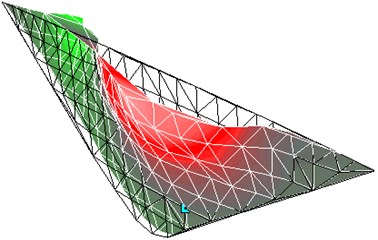
The dynamic properties of the scale arch dam models are numerically analyzed by the finite element (FE) method using ANSYS. Elastic FE models of two scale arch dams are built using the same geometrical and material parameters of the dam body and the foundation as those used in the experiment in Section 2.2. The results of the numerical simulation with the FE mesh illustrated in Fig. 6 are provided in Table 2 and Figs. 7 to 10. From the table and figures, it can be seen that that the mode shapes of the two models are similar, but the first-order natural frequency of the small model is 100.8 % higher than that of the large model, and the second-order natural frequency of the small model is 78.9 % higher than that of the large model.
Table 2Natural frequencies of numerical arch dam models (Hz)
Case | Large model | Small model |
First-order frequency | 896.6 | 1799.8 |
Second-order frequency | 1126.2 | 2014.6 |
Fig. 6FE Mesh of arch dam model
The difference between the numerical simulation and the experimental analysis results for the first-order natural frequency of the large model is 2.2 %; the difference for the second-order natural frequency is 15.2 %. The difference between the numerical simulation and the experimental analysis results for the first-order natural frequency of the small model is 5.6 %; the difference for the second-order natural frequency is 7.4 %. It can be seen that the results from the experiments and the numerical simulation are comparable under the considerations of the approximation of numerical models to the real structures.
Fig. 7First-order mode shape of large numerical arch dam model
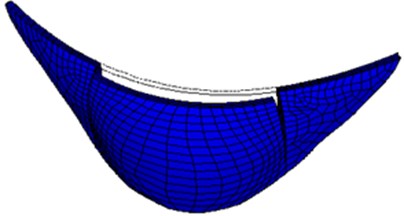
Fig. 8Second-order mode shape of large numerical arch dam model
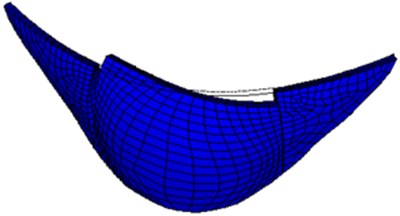
Fig. 9First-order mode shape of small numerical arch dam model
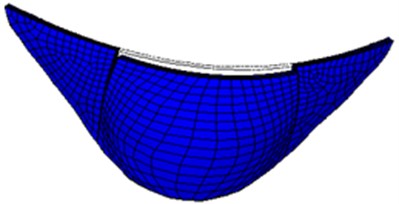
Fig. 10Second-order mode shape of small numerical arch dam model
3. Scale effects on dynamic responses
3.1. Theoretical basis
The motion equations of a structure with degrees of freedom and viscous damping coefficients can be expressed as:
where , , and represent the × mass, damping, and stiffness matrices, respectively; , , and are the acceleration, velocity, and displacement vectors, respectively; and is the time-dependent applied force vector. A scale structure usually causes a change in the mass , damping , and stiffness of the original structure:
where the subscript labels the scale structure. The frequency response function matrix of the scale structure is obtained as:
Thus, the vibration response of the scale structure can be expressed as:
3.2. Experimental procedure and results
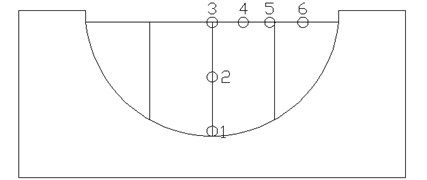
The same models as used in the dynamic property study are considered here. The characteristics of the random vibration responses of the two scale models are experimentally evaluated, with the arrangement of measuring points diagrammatically presented in Fig. 11.
Fig. 11Diagrammatic sketch of measuring points
The excitation equipment used is again an electromagnetic vibration system controlled by a COMET USB shaker control system; data acquisition and analysis are again performed using a LDV (PSV-400). The test is conducted by exciting band-limited white noise vibration of the shaking table along the horizontal direction. The excitation is introduced as random vibration with bandwidth ranging from 20 Hz to 2000 Hz and a constant acceleration power spectral density level. To determine the random response characteristics of the two scale models, five levels of power spectral density of acceleration, namely 0.1 (Case 1), 0.2 (Case 2), 0.3 (Case 3), 0.4 (Case 4), and 0.5 (m/s2)2/Hz (Case 5), are used.
The typical amplitude/time history of velocity is plotted in Fig. 12. The maximal random vibration responses at the different measuring points of the large model at five excitation levels are shown in Table 3 and Fig. 13. The maximum responses of the small model are shown in Table 4 and Fig. 14.
Fig. 12Typical amplitude/time history of velocity
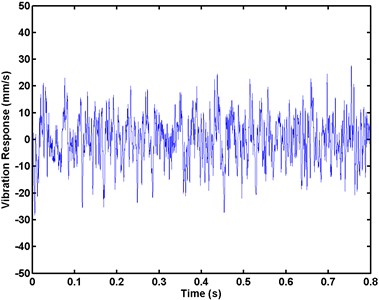
Fig. 13Maximum vibration responses of large model at five excitation levels in experimental analysis
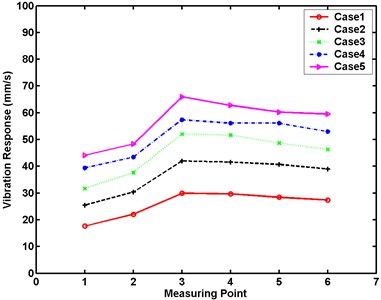
Table 3 and Figs. 13 demonstrate the similarity of the maximum velocity responses in the vertical and horizontal directions of the large model of the arch dam for Cases 1 to 5. Clearly, the maximum velocity responses in the vertical direction increase from the bottom to the top of the dam body in all cases. The maximum vibration responses occurring at the center top of the dam have similar patterns for all cases. The maximum velocity responses in the horizontal direction decrease from the center to the border of the dam body in all cases.
Table 3Experimentally obtained maximum vibration responses of large model (mm/s)
Case | Measuring point | |||||
1 | 2 | 3 | 4 | 5 | 6 | |
Case 1 | 17.6 | 22.1 | 29.9 | 29.7 | 28.4 | 27.4 |
Case 2 | 25.4 | 30.3 | 42.0 | 41.6 | 40.7 | 39.0 |
Case 3 | 31.7 | 37.6 | 52.0 | 51.7 | 48.7 | 46.3 |
Case 4 | 39.4 | 43.4 | 57.4 | 56.1 | 56.1 | 53.0 |
Case 5 | 44.1 | 48.3 | 66.0 | 62.8 | 60.3 | 59.5 |
Table 4 and Fig. 14 demonstrate the similarity of the maximum velocity responses in the vertical and horizontal directions of the small model of arch dam for Cases 1 to 5. The maximum velocity responses in the vertical direction increase from the bottom to the top of the dam body in all cases. The maximum velocity responses in the horizontal direction decrease from the center to the border of the dam body in all cases. The maximum vibration response occurs at the center top of the dam in all cases. The differences in the maximum random vibration responses between the large and small models at five excitation levels are shown in Table 5 and Fig. 15.
Fig. 14Maximum vibration responses of small experimental model at five excitation levels in experimental analysis
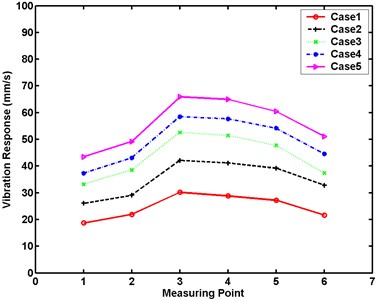
Fig. 15Differences in maximum responses between large and small models in experimental analysis
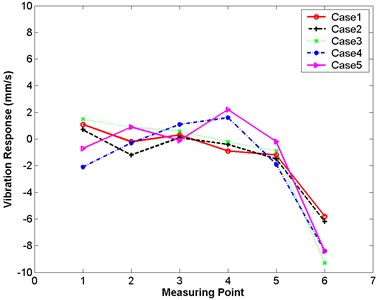
Table 4Experimentally obtained maximum vibration responses of small model (mm/s)
Case | Measuring point | |||||
1 | 2 | 3 | 4 | 5 | 6 | |
Case 1 | 18.7 | 21.9 | 30.2 | 28.8 | 27.2 | 21.6 |
Case 2 | 26.1 | 29.1 | 42.1 | 41.2 | 39.2 | 32.8 |
Case 3 | 33.2 | 38.5 | 52.6 | 51.5 | 47.8 | 37.4 |
Case 4 | 37.3 | 43.1 | 58.5 | 57.7 | 54.2 | 44.6 |
Case 5 | 43.4 | 49.2 | 65.9 | 65.0 | 60.5 | 51.1 |
Table 5Differences in maximum responses between large and small models in experimental analysis (mm/s)
Case | Measuring point | |||||
1 | 2 | 3 | 4 | 5 | 6 | |
Case 1 | 1.1 | –0.2 | 0.3 | –0.9 | –1.2 | –5.8 |
Case 2 | 0.7 | –1.2 | 0.1 | –0.4 | –1.5 | –6.2 |
Case 3 | 1.5 | 0.9 | 0.6 | –0.2 | –0.9 | –9.3 |
Case 4 | –2.1 | –0.3 | 1.1 | 1.6 | –1.9 | –8.4 |
Case 5 | –0.7 | 0.9 | –0.1 | 2.2 | –0.2 | –8.4 |
Table 5 and Fig. 15 demonstrate that the differences in the maximum velocity responses of the structure between the large and small models are not obvious for all cases: the maximum difference is 9.3 mm/s, occurring at measuring point 6.
3.3. Numerical simulation results
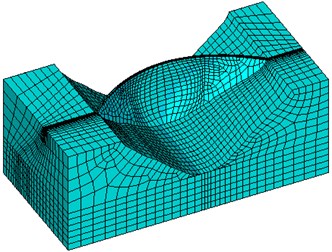
The same FE arch dam models as used in the dynamic properties analysis are employed for the numerical simulation, yielding the dynamic responses of the models. The typical velocity pattern of the structural dynamic response is shown in Fig. 16. The maximum random vibration responses at the different measuring points of the large model at different excitation levels in the numerical simulation are shown in Fig. 17 and in Table 6. The maximum responses of the small model are exhibited in Table 7 and Fig. 18.
Fig. 16Numerically obtained typical velocity pattern of scale arch dam models
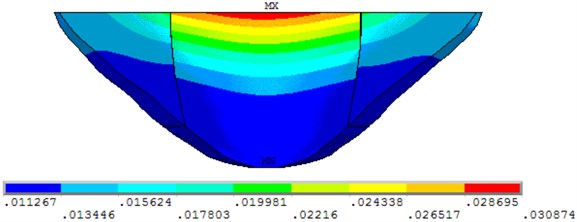
Table 6Maximum vibration responses of large numerical model (mm/s)
Case | Measuring point | |||||
1 | 2 | 3 | 4 | 5 | 6 | |
Case 1 | 11.4 | 15.3 | 28.2 | 28.1 | 25.7 | 17.4 |
Case 2 | 16.1 | 21.6 | 39.9 | 39.7 | 36.3 | 24.6 |
Case 3 | 19.7 | 26.4 | 48.9 | 48.6 | 44.4 | 30.1 |
Case 4 | 22.8 | 30.5 | 56.4 | 56.2 | 51.3 | 34.8 |
Case 5 | 25.5 | 34.1 | 63.1 | 62.7 | 57.4 | 38.9 |
Table 6 and Fig. 17 demonstrate the similarity of the maximum velocity responses of the large model in the vertical and horizontal directions in numerical simulation for Cases 1 to 5. Notably, the maximum velocity responses of the large model in numerical simulation have the same orderliness as those of the large model in the experiment.
Fig. 17Maximum vibration responses of large numerical model at different excitation levels
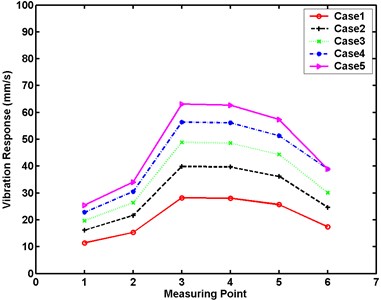
Fig. 18Maximum vibration responses of small numerical model at five excitation levels
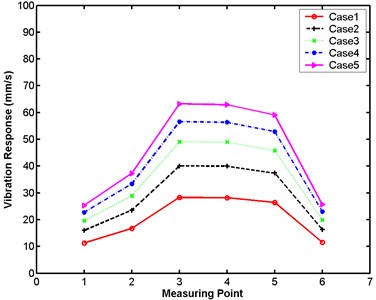
Table 7 and Fig. 18 demonstrate the similarity of the maximum velocity responses of the small model in the vertical and horizontal directions in numerical simulation for Cases 1 to 5. Observably, the maximum velocity responses of the small model in numerical simulation have the same orderliness as those of the small model in the experiment. The differences in the maximum random vibration responses between the large and small models at five excitation levels in the numerical simulation are exhibited in Table 8 and Fig. 19.
Table 7Maximum vibration responses of small numerical model (mm/s)
Case | Measuring point | |||||
1 | 2 | 3 | 4 | 5 | 6 | |
Case 1 | 11.3 | 16.7 | 28.3 | 28.2 | 26.4 | 11.5 |
Case 2 | 16.0 | 23.6 | 40.1 | 40.0 | 37.4 | 16.3 |
Case 3 | 19.6 | 28.9 | 49.1 | 49.0 | 45.8 | 19.9 |
Case 4 | 22.7 | 33.4 | 56.6 | 56.4 | 52.9 | 23.0 |
Case 5 | 25.3 | 37.3 | 63.3 | 62.9 | 59.1 | 25.7 |
Table 8Differences in maximum responses between large and small numerical models (mm/s)
Case | Measuring point | |||||
1 | 2 | 3 | 4 | 5 | 6 | |
Case 1 | –0.1 | 1.4 | –0.1 | –0.1 | –0.7 | –5.9 |
Case 2 | –0.1 | –2.0 | 0.2 | 0.3 | 1.1 | –8.3 |
Case 3 | –0.1 | 2.5 | 0.2 | 0.4 | 1.4 | –10.2 |
Case 4 | –0.1 | 2.9 | 0.2 | 0.2 | 1.6 | –11.8 |
Case 5 | –0.2 | 3.2 | 0.2 | 0.2 | 1.7 | –13.2 |
Fig. 19Differences in maximum responses between large and small numerical models
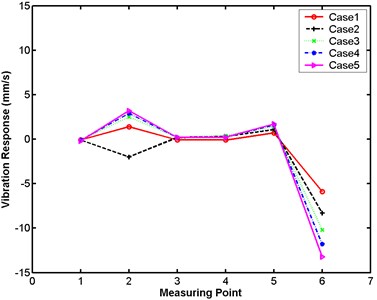
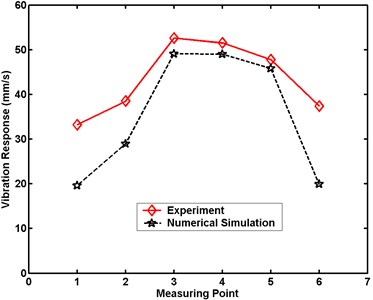
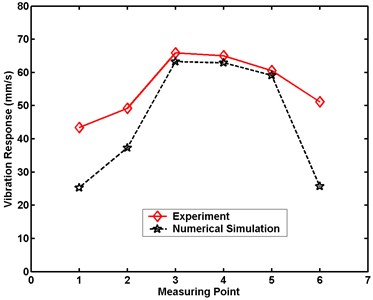
Fig. 20Maximum velocity comparative charts for Case 1 in numerical simulation
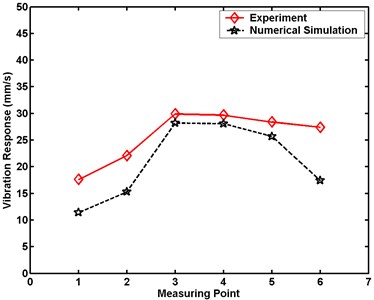
a) Large model
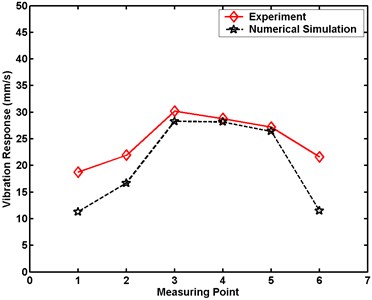
b) Small model
Table 8 and Fig. 19 demonstrate that the differences in the structural maximum velocity responses between the large and small models in numerical simulation are not obvious for all cases. The maximum differences occur at measuring point 6 for all cases; the value is –13.2 mm/s. Maximum velocity comparative charts between experiment and numerical simulation are plotted in Figs. 20 to 24 for Cases 1 to 5, respectively. These charts provide comparisons between (a) the large model and (b) the small model.
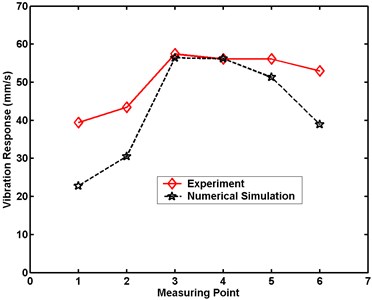
Fig. 21Maximum velocity comparative charts for Case 2 in numerical simulation
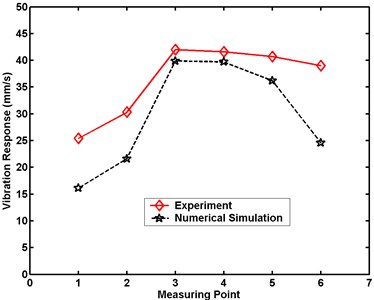
a) Large model
b) Small model
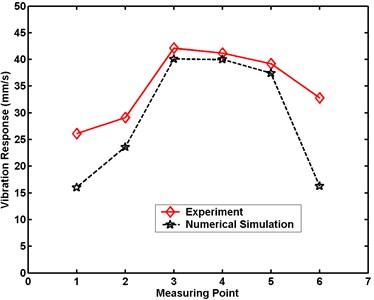
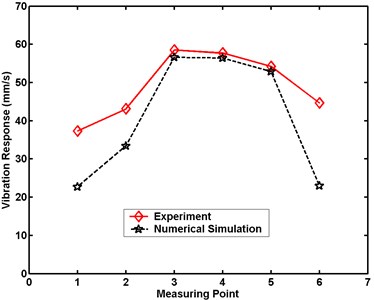
Fig. 22Maximum velocity comparative charts for Case 3 in numerical simulation
a) Large model
b) Small model
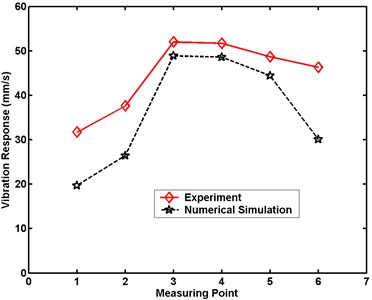
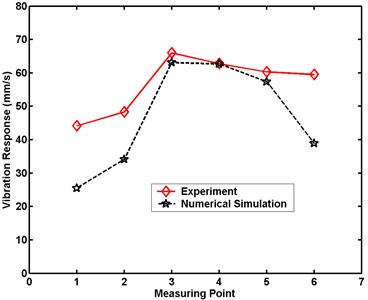
Fig. 23Maximum velocity comparative charts for Case 4 in numerical simulation
a) Large model
b) Small model
Figs. 20 to 24 demonstrate that the maximum velocity responses of the structures are always greater in experiment than in numerical simulation. The differences in the structural maximal velocity responses at the measuring point near the border are greater than those at other locations. The maximum differences in the structural maximum velocity responses of the large model between experiment and numerical simulation are 10.0, 14.4, 16.2, 18.2, and 20.6 mm/s, respectively. The maximum differences in the structural maximal velocity responses of the small model between experiment and numerical simulation are 10.1, 16.5, 17.5, 21.6, and 25.4 mm/s, respectively. These differences between the experimental and numerical results are occasioned by the simplification of the numerical simulation model. From comparisons of the results of experiment and numerical simulation, the numerical analysis is proven an effective method for evaluating dynamic responses under a scale effect study.
Fig. 24Maximum velocity comparative charts for Case 5 in numerical simulation
a) Large model
b) Small model
4. Conclusions
This study used two scale models of the Xiaowan Arch Dam to investigate the scale effects on the dynamic properties and responses of the structure. The scale effects on structural dynamic properties and responses were studied by experimental analysis and numerical simulation. The experimental results showed that the scale arch dam models had similar first-order and second-order mode shapes, but the associated natural frequencies of the small model were higher than those of the large model. The numerical simulation showed similar modal results to the experimental cases. Moreover, the maximum velocity responses in numerical simulation had the same orderliness as those in experimental analysis, with the greatest differences occurring at the measuring point near the border. The high consistency between the experimental and numerical results indicates that numerical simulation is an effective method for evaluating dynamic properties and responses of scale structures.
References
-
Ohtaki T. An experimental study on scale effects in shear failure of reinforced concrete columns. 12th World Conference on Earthquake Engineering, Auckland, New Zealand, Vol. 2: Earthquake engineering in practice, 2000.
-
Ungbhakorn V., Wattanasakulpong N. Structural similitude and scaling laws of anti-symmetric cross-ply laminated cylindrical shells for buckling and vibration experiments. International Journal of Structural Stability and Dynamics, Vol. 7, Issue 4, 2011, p. 609-627.
-
Viot P., Ballere L., Guillaumat L., Lataillade J. L. Scale effects on the response of composite structures under impact loading. Engineering Fracture Mechanics, Vol. 75, Issue 9, 2008, p. 2725-2736.
-
Morquio A., Riera J. D. Size and strain rate effects in steel structures. Engineering Structures, Vol. 26, Issue 5, 2004, p. 669-679.
-
Rios R. D., Riera J. D. Size effects in the analysis of reinforced concrete structures. Engineering Structures, Vol. 20, Issue 8, 2004, p. 1115-1125.
-
Tjernlund J. A., Gamstedt E. K., Gudmundson P. Length-scale effects on damage development in tensile loading of glass-sphere filled epoxy. International Journal of Solids and Structures, Vol. 43, Issue 24, 2006, p. 7337-7357.
-
Zhang N., Tan K. H. Size effect in RC deep beams: Experimental investigation and STM verification. Engineering Structures, Vol. 29, Issue 12, 2007, p. 3241-3254.
-
Vios J. R. del, Carmona J. R., Ruiz G. Shape and size effects on the compressive strength of the high-strength concrete. Cement and Concrete Research, Vol. 38, Issue 3, 2007, p. 386-395.
-
Cedolin L., Cusatis G. Identification of concrete fracture parameters through size effect experiments. Cement and Concrete Composites, Vol. 30, Issue 9, 2008, p. 788-797.
-
Man H.-K., Mier J. G. M. Damage distribution and size effect in numerical concrete from lattice analyses. Cement and Concrete Composites, Vol. 33, Issue 9, 2011, p. 867-880.
-
Yi S. T., Yang E. I., Choi J. C. Effect of specimen sizes, specimen shapes, and placement directions on compressive strength of concrete. Nuclear Engineering and Design, Vol. 236, Issue 2, 2006, p. 115-127.
-
Yi S. T., Kim M. S., Kim J. K., Kim J. H. Effect of specimen size on flexural compressive strength of reinforced concrete members. Cement and Concrete Composites, Vol. 29, Issue 3, 2007, p. 230-240.
-
Yazıcı Ş., Sezer G. İ. The effect of cylindrical specimen size on the compressive strength of concrete. Building and Environment, Vol. 42, Issue 6, 2007, p. 2417-2420.
-
An M. Z., Zhang L. J., Yi Q. X. Size effect on compressive strength of reactive powder concrete. Journal of China University of Mining and Technology, Vol. 18, Issue 2, 2008, p. 279-282.
-
Elicesa M., Roccob C. G. Effect of aggregate size on the fracture and mechanical properties of a simple concrete. Engineering Fracture Mechanics, Vol. 75, Issue 13, 2008, p. 3839-3851
-
Roccob C. G., Elicesa M. Effect of aggregate shape on the mechanical properties of a simple concrete. Engineering Fracture Mechanics, Vol. 76, Issue 2, 2009, p. 286-298.
-
Meddaha M. S., Zitounib S., Belâabesb S. Effect of content and particle size distribution of coarse aggregate on the compressive strength of concrete. Construction and Building Materials, Vol. 24, Issue 4, 2010, p. 505-512.
-
Bažant Z. P. Fracturing truss model: size effect in shear failure of reinforced concrete. Journal of Engineering Mechanics, Vol. 123, Issue 12, 1997, p. 1276-1288.
-
Ungbhakorn V., Singhatanadgid P. A scaling law for vibration response of laminated doubly curved shallow shells by energy approach. Mechanics of Advanced Materials and Structures, Vol. 16, Issue 5, 2009, p. 333-344.
-
Kotsovos M. D., Pavlović M. N. Size effects in structural concrete: a numerical experiment. Computers & Structures, Vol. 64, Issues 1-4, 1997, p. 285-295.
-
Devriendt C., Steenackers G., Sitter G. D., Guillaume P. From operating deflection shapes towards mode shapes using transmissibility measurements. Mechanical Systems and Signal Processing, Vol. 24, Issue 4, 2010, p. 665-677.
-
Xu W., Radzieński M., Ostachowicz W., Cao M. S. Damage detection in plates using two-dimensional directional Gaussian wavelets and laser scanned operating deflection shapes. Structural Health Monitoring – An International Journal, Vol. 12, Issue 5-6, 2013, p. 457-468.
-
Bai R. B., Song X. G., Radzieński M., Cao M. S., Ostachowicz W., Wang S.S. Crack location in beams by data fusion of fractal dimension features of laser-measured operating deflection shapes. Smart Structures and Systems, Vol. 13, Issue 6, 2014, p. 975-991.
-
Siringoringo D. M., Fujino Y. Experimental study of laser Doppler vibrometer and ambient vibration for vibration-based damage detection. Engineering Structures, Vol. 28, Issue 13, 2006, p. 1803-1815.
-
Wang S. S., Ren Q. W. Relationship between local damage and structural dynamic behavior. Science China Technological Sciences, Vol. 55, Issue 12, 2012, p. 3257-3262.
About this article

The authors gratefully acknowledge the financial support provided by the Natural Science Foundations of China (Grant Nos. 11132003 and 51179064), Qing Lan Project and the Fundamental Research Funds for the Central Universities (Grant Nos. 2014B03914 and 2012B05814).
