Abstract
To solve the problems of near-field acoustic holography in actual applications, research based on acoustic radiation modes with double layers is studied in this paper. The sound pressure model by using acoustic radiation modes is selected to express the sound field firstly. Then, the sound field separation with double pressure measurement layers has been applied to remove the interference from the opposite direction. Thirdly, the method based on data interpolation and extrapolation is put forward to increase the holographic value equivalently, the results of which are closer to the actual measured value obtained by more measuring points. Numerical simulations based on the theoretical description are conducted to demonstrate the validity of the proposed method, and experiments for a boundary constraint steel plate and a loudspeaker are performed to demonstrate its feasibility.
1. Introduction
Near-field acoustic holography (NAH) [1] has recently attracted extensive attention as a new technique in sound source identification and localization. However, most testing sites in practical applications cannot meet the requirements that the sound sources should be located on the same side of the measurement plane. Additionally, the holographic aperture when using NAH technique should be greater than the actual size of the sound source. In analyzing the complicated structures over a large area, the number of measuring points should be increased to obtain NAH images with higher spatial resolution.
To solve the aforementioned problems many advances have been made recently, such as the sound field separation method based on NAH, and the Patch method based on data interpolation and extrapolation. Jacobson, Femandez et al have proposed several sound separation techniques for sound field reconstruction in non-free-field environments [2, 3]. Valdivia et al. have proposed double-layer and single-plane sound field separation methods based on the boundary element method (BEM) [4]. Song, et al. have proposed sound field separation methods based on the spherical waves superposition method using single-plane [5]. Aiming at solving the problems induced by aperture effects, Bi et al. have proposed a local NAH technique based on distributed source boundary point method [6]. Zhang et al. have proposed a method based on wave-superposition-based method for enhancing the spatial resolution of NAH images [7]. Xu et al. have proposed a NAH resolution enhancement method using the interpolation of orthogonal spherical waves [8].
However, these methods only focus on a single issue and lack comprehensive considerations to address multiple issues. When two issues exist simultaneously, we should combine the sound field separation technique with the Patch method and perform the optimization selection and control on the related parameters uniformly. Recently, Nie et al. [9] have proposed an acoustic radiation-mode analysis model and a sound-field reconstruction formula for complex structures. This method was then introduced into the field of NAH, and many favorable results were acquired. In this article, using sound-radiation mode analysis, we consider the relationship between the relevant parameters and the proposed problems into a comprehensive account, and propose a method to accurately eliminate the effects of interference sources, while simultaneously enhancing the spatial resolution of the holographic plane when fewer measurement points are used.
2. Theory
Based on acoustic radiation mode theory [9], pressure matrix on the holographic plane can be solved by:
where , and denote the position vectors at the calculating points and on the structure surface respectively. The elements in the matrix are denoted as , denotes the area of the small unit after equal area partitioning on the structure’s surface, denotes density and is the angular frequency of vibrations denotes the matrix of the acoustic radiation modes. denotes the matrix of the sound field distribution modes and denotes the column vector of the expansion coefficients of different acoustic radiation modes.
Fig. 1Illustration of the spatial arrangement
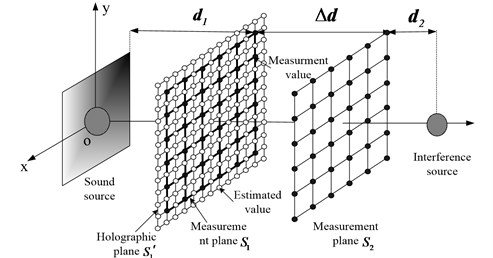
When the sound sources are located at two sides of the measurement plane, a double-layer array is adopted in sound field. Fig. 1 displays the layout of the measurement space, in which the complex pressure data measured on the measurement planes and are denoted as and . The pressure responses on and generated by the target source and the interference source are denoted as , and , respectively. Considering that the pressure is a scalar quantity, we can obtain the following expressions:
where , and , denotes the corresponding matrices of the sound distribution mode on and generated by the target source and the interference source, respectively. The constants and denote the expansion coefficients corresponding to the sound radiation modes of the target source and interference source, respectively.
By combining Eq. (2) and Eq. (3), we can obtain the pressure responses on generated by the target source and interference source can be expressed as:
where ‘’ denotes the pseudo-inverse operation. When the condition number of is comparatively large, regularization should be performed during the inversion process.
Based on the position information of all spatial points on the holographic plane , we can obtain the pressure matrix on the holographic plane containing more estimated data as:
where denotes the transfer function matrix between the holographic plane , and the target source plane, and denotes the sound radiation modes of the target source. To verify the sensibility of the errors of the proposed method, the error index, can be defined as:
where denotes the pressure response generated by the target source and denotes the theoretical value without the existence of the interference source.
3. Numerical simulation
To verify the effectiveness and accuracy of the proposed method, rigid pulsating spheres were adopted for numerical simulation. The center of rigid pulsating sphere as the target source was located at the origin of coordinates, whose radius and vibration velocity were 0.1 m and 0.08 m/s, respectively. The radius and vibration velocity of another rigid pulsating sphere, adopted as the interference source in the present simulations, were 0.15 m and 0.15 m/s, respectively. The two measurement planes, and , have identical sizes (0.5 m×0.5 m), on which 64 measuring points (8×8) were distributed. The distance between the measurement plane near the target source, , and the target source itself was 0.2 m, i.e., 0.2 m. The distance between the measurement plane near the interference source, , and the interference source was 0.5 m, i.e., 0.5 m. The distance between the two holographic planes was 0.15 m, i.e., 0.15 m. In order to obtain simulation results closer to the actual measurements, random white noise with an intensity of 30 dB was added into the pressure data on the measurement planes. To verify the universal applicability of the proposed method, the value of was traversed within the range from 0.1 to 3, which means, the frequency was traversed within the range from 54.6 to 1637.7 Hz.
Using the proposed double-layer field separation technique, the amplitudes of the pressure response (8×8) on generated by the target source was separated firstly. Then, two-fold interpolated and extrapolated holographic data (17×17) were approximately obtained. According to Eq. (9), the errors between the calculated pressure amplitudes with theoretical value without the interference source were calculated and displayed in Fig. 2.
Fig. 2Variation of errors as a function of ka
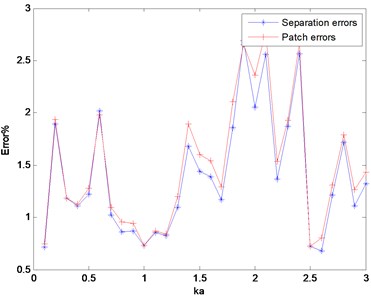
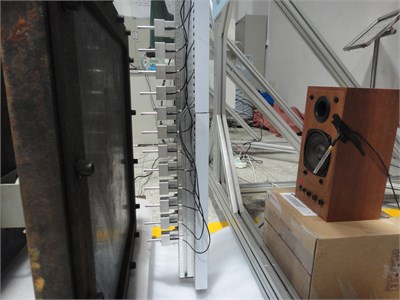
Fig. 3Pictures of the experimental site
As shown in Fig. 2, although the frequency varies within a wide band, the proposed errors are always lower than 3.0 %, suggesting that the proposed method is applicable for the medium- and low-frequency sound fields.
4. Experiments
As shown in Fig. 3, the experiments were performed in an ordinary factory building. A boundary constraint steel plate was selected as the target source and a loudspeaker with a size of 0.23 m×0.14 m×0.13 m was selected as the interference source. Set the plate as coordinate plane, the size is 0.5 m×0.5 m, the thickness is 0.001 m. Then a rectangular coordinate system was constructed, in which the interference source was located at (0, –0.05 m, 0.7 m). In total, 12 pressure sensors were included in the microphone array. The sizes of two holographic planes were both 0.66 m×0.66 m. For the holographic planes, and , the coordinates of the geometric centers were (0, 0, 0.04 m) and (0, 0, 0.1 m), respectively.
In the present experiment, the excitation frequency was set to 292 Hz. To verify the accuracy of the proposed technique, the data with a dimension of 6×6 were extracted, as displayed in Fig. 4(a). Then the processed result was obtained, as displayed in Fig. 4(b), via data interpolation and extrapolation on the separated results. By comparison, the 12×12 measured values without interference were measured, as displayed in Fig. 4(c).
Fig. 4Distributions of pressure amplitude on S1
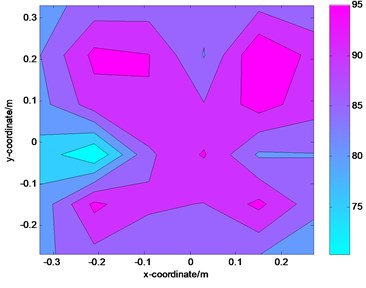
a) The 6×6 extraction of the measured values with interference
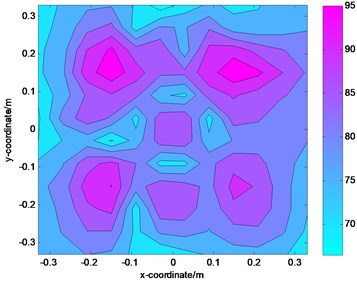
b) The 12×12 processed results using double-layer sound field separation method
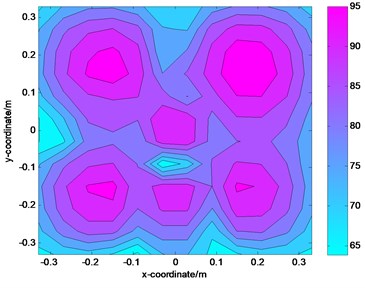
c) The 12×12 measured values without interference
Compared with the theoretical values, the processed results are quite close to the theoretical results, and the error is calculated to be only 10.24 %. In consideration of that experiments were performed in an ordinary factory building, and other noise exists in the surrounding areas, the separation results may be better if the experiments were to be performed in an anechoic room.
5. Conclusions
To solve the problems of NAH in actual applications, a double-layer Patch Technique by using Acoustic Radiation Modes was established. The same sound field and pressure model was selected when using the sound field separation and Patch techniques. With comprehensive consideration of the effects, the optimization selection and control on each parameter could be realized. As indicated by the simulated and experimental results, the effects induced by the interference noise can be eliminated, and moreover, the holographic data that are closer to the actual results using fewer measuring points can be obtained, indicating that the processing method is simple and economic, and quite convenient for engineering applications.
References
-
Mao J., Xu Z. M., Zhang Z. F., et al. The improved separation method of coherent sources with two measurement surfaces based on statistically optimized near-field acoustical holography. Journal of Vibroengineering, Vol. 17, Issue 2, 2015, p. 674-681.
-
Jacobsen F., Chen X. Y., Jaud V. A comparison of statistically optimized near field acoustic holography using single layer pressure-velocity measurements and using double layer pressure measurements. The Journal of the Acoustical Society of America, Vol. 123, Issue 4, 2008, p. 1842-1845.
-
Fernandez-Grande E., Jacobsen F. Sound field separation with a double layer velocity transducer array. The Journal of the Acoustical Society of America, Vol. 130, Issue 1, 2011, p. 5-8.
-
Valdivia N. P., Williams E. G., Herdic P. C. Approximations of inverse boundary element methods with partial measurements of the pressure field. The Journal of the Acoustical Society of America, Vol. 123, Issue 1, 2008, p. 109-120.
-
Song Y. L., Lu H. C., Jin J. M. Sound wave separation method based on spatial signals resampling with single layer microphone array. Acta Physica Sinica, Vol. 63, Issue 19, 2014, p. 195-204, (in Chinese).
-
Bi C. X., Yuan Y., He C. D., et al. Patch nearfield acoustic holography based on the distributed source boundary point method. Acta Physica Sinica, Vol. 59, Issue 12, 2010, p. 8646-8655, (in Chinese).
-
Zhang X. Z., Bi C. X., Xu. L., et al. Resolution enhancement of nearfield acoustic holography by the wave superposition approach. Acta Physica Sinica, Vol. 59, Issue 8, 2010, p. 5564-5571, (in Chinese).
-
Xu L., Bi C. X., Chen X. Z., et al. Patch Near-field Acoustic Holography by Extrapolation Using Orthogonal Spherical Wave Source. Journal of Mechanical Engineering, Vol. 46, Issue 4, 2010, p. 1-7.
-
Nie Y. F., Zhu H. C. Acoustic field reconstruction using source strength density acoustic radiation modes. Acta Physica Sinica, Vol. 63, Issue 10, 2014, p. 256-267, (in Chinese).
About this article

The authors would like to thank the referees for their review of this manuscript. The work is supported by the National Natural Science Foundation of China, Grant No. 51305452.
