Abstract
The paper presents a new approach to optimize the comminution process by using accelerometer measurements of the mill shell. An installation performed in the KGHM Polska Miedź Division – Ore concentration Plant Lubin – one of the largest producers of copper and silver in the world – has been used. It is shown that the measurements are correlated with the lithological structure of the ore, and they can be used in a control system to improve effectiveness of the milling and classification processes.
1. Introduction
The milling and classification systems constitute important parts of copper ore comminution process. They are responsible for preparing the appropriate granulation of processed material, which is very important in production of copper ore concentrate during froth flotation.
The milling efficiency depends on many factors, like throughput and density of the feed, its mineralogical and lithological structure, the wear and tear of milling medium (rods or balls) as well as the technical condition of the mill and its rotational speed. The effectiveness of grinding is also determined by properties of the ore like crushability and granulation [1]. In industrial practice, only three of these factors are usually controlled: the throughput, the density (more precisely the ore-water ratio) and the rotational speed of mill. The density and the rotational speed are stabilized at optimal levels, which guarantee the best efficiency of comminution [2, 3]. Increasing the throughput shortens flow time of the ore through the mill chamber, what results in worse milling efficiency. However, if final product quality is still acceptable, in spite of worse granulation it is common to increase the throughput to maximize the production and incomes.
Other factors mentioned above have been out of automatic control up to this moment. Measurements of ore properties and lithological structure have been found difficult and not always easy accessible, although some approach to this topic is currently being developed [1]. Evaluation of mill state and of the wear and tear of rods or balls is possible only during planned breaks in the production process.
The efficiency of classification depends mostly on density of the classified material. The appropriate density is needed to separate properly high granulated material, which needs to be comminuted again from low granulated particles able to be processed in flotation.
In this paper the authors present the new approach to optimize the comminution process by using accelerometer measurements of rod mill shell, basing on installation performed in KGHM Polska Miedź, Ore concentration Plant Lubin. They prove that the measurements correlate with lithological structure of processed ore and propose their usage in an automatic control system improving effectiveness of the milling and classification process.
1.1. Copper ore enrichment process
The copper ore enrichment process is a mechanical process of recovering ore before it undergoes smelting. It is composed of four main stages: mined ore crushing, milling, flotation and drying.
The crushing process prepares fresh ore (1.3 % of pure copper) from copper mine to milling process. At this stage, ore is screened on two main fractions: sandstones and carbonates. Sandstones are characterized by good crushability, so they are transported directly to mills after screening. The carbonates are more resistant and they need to be crushed in impact crushers and then in cone crusher. After this process the maximal feed granulation for milling varies from 16 to 40 mm [4].
During the milling stage, the crushed ore is comminuted in rod mills in wet milling which should produce the maximal granulation of about 2 mm. Then, the slurry is separated in spiral classifiers into well grinded fraction (overflow of classifier, granulation of 150 μm) and badly grinded one (underflow of classifier). The overflow stream is transported to the flotation stage, and meanwhile underflow stream is processed in the second milling stage, i.e. in ball mills. After this operation the pulp is transported to hydrocyclones where fraction under 200 μm is separated and redirected to flotation. Bigger particles return again to ball mills, where they are processed until they reach the appropriate size.
The flotation is a process of selective separation of hydrophobic materials from hydrophilic. The comminuted ore is mixed with collector chemicals and frothers, which make the surface of copper sulfides hydrophobic and capable to create the froth [5]. Then, the pulp is transported into flotation machines, where froth with beneficiated ore is collected and sent to drying process as concentrate. The tailings are processed in a similar way in consecutive flotation stages until they reach low content of copper (less than 0.15 %).
The effectiveness of flotation depends on many factors among which the granulation of comminuted ore plays important role [6]. Too large particles are too heavy to create froth and sink in tailings. Too small particles form too large froth bubbles, which reduce the total beneficiation surface and decrease the flotation efficiency. For this reason it’s important to control granulation of pulp and allow only appropriate particles to flotate.
The final step of copper ore enrichment is drying. The concentrate is condensed and dried in thermal driers. After this step the final product (14 % of copper in concentrate) is obtained and it is transported to smelters where pure copper is recuperated.
1.2. Comminution process optimization
The object of comminution optimization is to maximize the production (the throughput) and to conserve at the same time the quality of production (14 % of pure copper in concentrate, tailings less than 0.15 %). The aim of optimization has seemed to be in opposition to the nature of the milling process. A high throughput results in worse milling effect, which worsen the flotation quality. Besides that, there is no other possibility to significantly improve milling when density and rotational speed are optimally controlled. Other factors having influence on comminution have been unmeasurable.
For these reasons it has not been possible to control the milling directly and achievement of optimization object has only been possible by good control of the flow of well and badly granulated pulp. In the Lubin concentrator, the maximization of throughput has been done by an automatic control system presented in Fig. 1. The crushed ore transported on conveyor belts (CB) is directed into rod mills from which it comes to spiral classifiers (C). The granulation controller (GIC) sets the control value to the density controllers (DIC) in classifiers to assure that only grains with expected size are sent to fines flotation. The change of the density changes the sedimentation time, so when it is low, big (heavy) particles sink faster and only small granulation overflows into fines. When the density is growing, heavy particles sink slower and granulation in fines increases successively. Sunk particles of ore are transported by spiral classifier to ball mill (BM), where they are comminuted and sent to the hydrocyclone. The hydrocyclone constitutes other classification method designed for smaller granulation than in spiral classifiers, but it is controlled in similar way. The granulation controller (GIC) sets the control value for density (DIC) of feed of hydrocyclone so finer particles can be transported to the coarses flotation. Larger ones are redirected to the ball mills (R* stream) to comminute again and the cycle is repeated.
The optimization of throughput has been done when the flow of mass in recycle stream (R*) has been decreasing. The flow controller (FIC) has noticed the fall of dry mass in recycle and has increased the throughputs on conveyor belts.
Fig. 1Simplified scheme of milling and classification process. CB – conveyor belt, RM – rod mill, C – classifier, SM – sump, MB – ball mill, HC – hydrocyclone, FIC – flow indicator/controller, DIC – density indicator/controller, LIC – level indicator/controller, PIC – pressure indicator/controller, GIC – granulation indicator/controller, W – water, R* – recycle stream
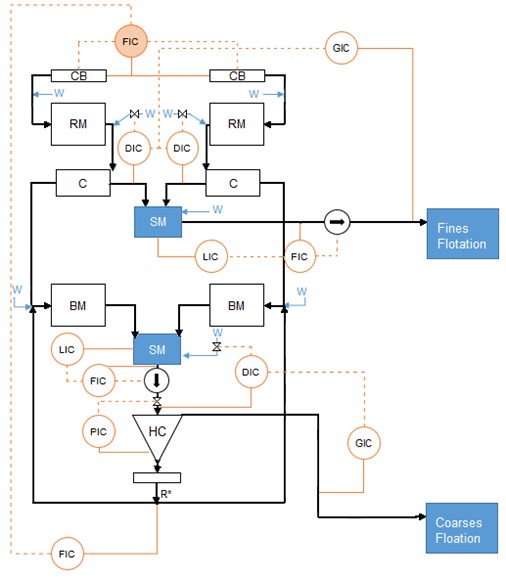
Fig. 2Flow fluctuation in spiral classifier underflow during constant throughput
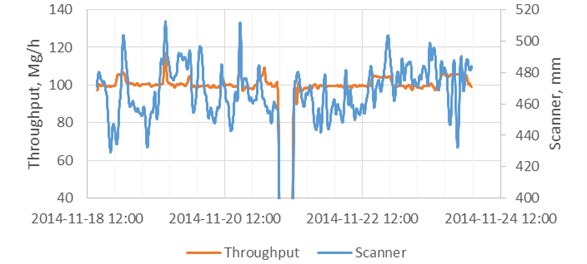
The presented strategy of throughput control guarantees the expected quality of feed sent to flotation process. However, during tests made in concentrator plant in Lubin it was noticed that separation of coarse particles from fines in spiral classifier causes the fluctuation of mass flow in underflow and overflow stream despite constant throughput to rod mill. The described effect in form of relation between throughput and underflow stream in classifier is presented in Fig. 2. The underflow stream was measured by laser scanner installed under classifier. Each growth of 10 mm measured by scanner corresponds to growth of 10 Mg/h of dry mass flow in the classifier underflow.
The mentioned fluctuations result in propagation of disturbances on throughput controller. When low mass quantity appears on throughput controller, it tries to increase it. However when disturbances occur and coarser feed appears on ball mills, increased throughput cause worse milling efficiency, which perturbs granulation on coarses flotation. In this case the granulation controller reacts by decreasing density before hydrocyclone, which increases the recycle stream. In effect, flow controller must decrease the throughput, what makes (regarding the long time constants in the system and its multi-inertial character) the regulation time very long and all system is bouncing. For this reason it is important to identify the source of disturbances and try to compensate it.
2. Vibration measurements
To identify the cause of disturbances observed on streams of the spiral classifier, the vibration measurements of mill shell were registered. The authors have out forward a hypothesis that the flow fluctuations depend on lithological composition in the feed, which may vary in time. The variation of lithological composition could be motivated by low efficiency of screening process before ore crushing – only about 20 % [4]. Variation of non-screened sandstones in the feed can perturb the classification process after milling in rod mills.
The authors have decided to verify the hypothesis if lithological composition changes would result in variation in vibrational pattern. Such phenomenon is justified, because the sandstones are more abrasive than carbonates [4]. It should result in higher friction between comminuted stones, rods, and mill shell, which might change properties of registered vibrations.
To measure the vibration of the mill, two accelerometer sensors (to assure the redundancy) have been installed at opposite sides of the mill shell. To send the data from accelerometers to the computer analysis, the wireless data recorder has been installed. It can transmit vibrations records of 20 seconds for each five minutes. The equipment was supplied from accumulator rotating with it on the mill. When data is received, the computer system filters frequencies above 100 Hz from the recording and computes the variance of resulting signal according to:
where: – vibration variance, – number of samples, – sample mean, – th sample.
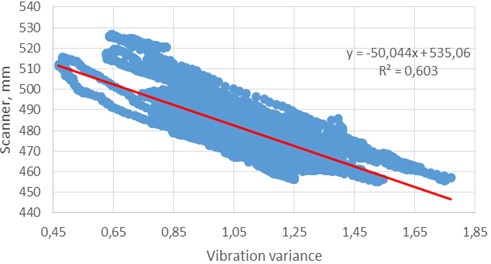
A two-month registration has proven the existence of correlation between vibrations and the scanner signal (Fig. 3). The correlation level of 0.60 is high regarding the industrial conditions of tests where it was impossible to stabilize for so long time other important factors like density in classifier and throughput, which can disturb the scanner measurements.
Fig. 3Relation between variation of accelerometer signal and laser scanner
When trying to identify a linear model of scanner given by:
where: – scanner model, – density in classifier, – vibration variance, – throughput, , , – coefficients to identify, it is possible to obtain the output of which correlation with the scanner measurement is 0.68. The model is statistically significant what proves the influence of density, throughput and vibration measurements on the mass flow measured by scanner.
When the relevance of vibration with the mass flow has been proven, it has been then necessary to find out the source of this phenomenon. Three tests have been performed: influence of the change of throughput, the density in rod mill and the lithological composition on vibrations and on scanner. During the test step changes of the control value of these three signals have been made out and the reaction of the variance and the scanner measurements have been observed.
The modification of the throughput and the density in rod mill have had certain influence on mass flow registered by the scanner. No reaction on the accelerometer signals has been observed. However, changing the lithological composition by feeding the rod mill by carbonates, then by sandstones and again by carbonate ore involved the reaction on both the scanner and the variance signal, which is presented in Fig. 4.
Fig. 4Reaction of scanner and vibration variance on lithological composition change
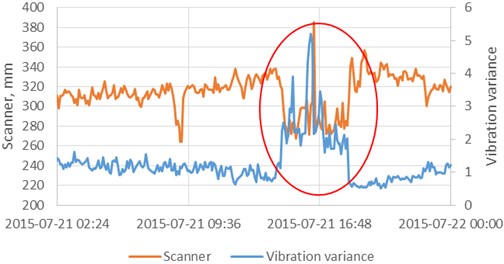
Fig. 5Control system to compensate the lithological composition disturbances. CB – conveyor belt, RM – rod mill, C – classifier ,SM – sump, MB – ball mill, FIC – flow indicator/controller, DIC – density indicator/controller, LIC – level indicator/controller, GIC – granulation indicator/controller, VI – vibration indicator (feedforward controller)
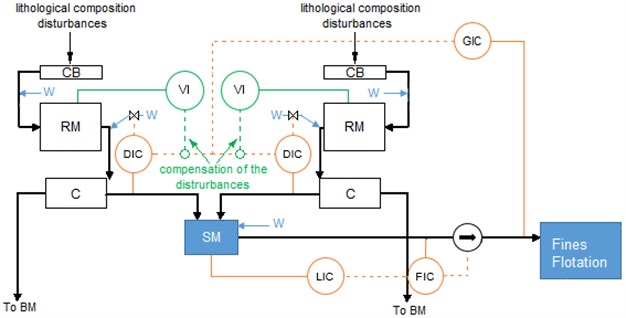
These experiments have proven the hypothesis that flow fluctuations on spiral classifier are involved by lithology changes in feed. The reaction of vibrational signal is in accordance with expectations: sandstones involve higher variance of signal (the mill works louder) than carbonates. The tests reveal also that accelerometer signal can be used to compensate fluctuations in classifier.
To achieve the objective, the authors propose to design a control system with feedforward from the vibration signal to modify the density in spiral classifier (Fig. 5). This structure of control system should assure removal of disturbances coming from lithological composition and improve the stability of milling and classification process by stabilization of mass flow to fines and coarses flotation. It will be the subject of further research and experiments.
3. Conclusions
The experiments presented in this paper prove the possibility of lithological composition estimation based on vibration measurements. The advantage of presented method is that the vibration can be measured online in an industrial area and provide the information useful for control systems.
The authors propose to use the vibration measurements to compensate for mass flow fluctuations on the spiral classifier. The measurements should be used for feedforward control correcting the density control value in the classifier for fast disturbance removal. In effect, the mass flow will be independent from lithology and will only change according to granulation controller. No flow fluctuations will also prevent the flow controller responsible for throughput from too fast and not necessary feed flow change to rod mills. In consequence, the overall system of milling and classification should be more stable and robust which should in turn assure better optimization of the throughput.
References
-
Konieczny A., Ogonowski S., Kurzydło M., Foszcz D. Vision systems in divisions of concentrators as a support tool for production management and optimization. Proceedings of the Mineral Engeineering Conference ME, Istebna, 2014.
-
Lux J., Clermont B. The influence of mill speed and pulp density on the grinding efficiency for secondary stage grindig. International Platinum Conference ‘Platinum Adding Value’, The South African Institute of Mining and Metallurgy, 2004.
-
Costea C., Silaghi H., Silahi M., Silahi P. Grinding circuit control using programmable logic controllers. Proceedings of the 11th WSEAS International Conference on Signal Processing, Computational Geometry and Artificial Vision, Florence, 2011.
-
Malewski J. Analysis of ore crushing system in division – ore concentration plant Lubin. Mining Science – Mineral Aggregates, Vol. 22, 2015.
-
Myłasa E., Iwańska A. Influence of Air Bubbles Velocity on Coal Flotation Results. Górnictwo i Geoinżynieria, Kraków, 2014.
-
Kasińska-Pilut E. Influence of Feed Characetristics on Effects of Polish Copper Ore Preparation to Beneficiation Processes. Ph.D. Dissertation, Kraków, 2014.
About this article

The research has been supported by the National Centre for Research and Development under the project PBS3/B3/0/2015 within the Applied Research Programme. The authors are greatly indebted to the KGHM S.A. and AmePlus sp. z o.o. companies for providing access to the production process and agreeing to publish collected data.
