Abstract
This paper analyzes the stator vibration response under static air-gap eccentricity and rotor inter-turn short circuit composite faults (SAERISC). The detailed formula of the magnetic force on stator is firstly deduced. Then the finite element simulations and practical experiments are taken to investigate the stator vibration response. It’s shown that, 1st to 4th stator vibrations will be produced. The development of the short circuit will decrease the 2nd vibration but increase the 4th vibration, while the increment of the eccentricity will increase the 1st to 4th vibrations at the same time.
1. Introduction
SAGE and RITSC are common faults in generator. When the eccentricity is more than 10 %, intense vibrations, winding damages will be caused [1]. Similarly, RITSC will increase the excitation current, and even lead to an earth fault [2]. Scholars have studied much about these two faults, such as the circulating current inside parallel branches (CCPB) [3], and the unbalanced magnetic pull (UMP) [4, 5] under SAGE, and also the UMP features and vibration characters [6, 7] under RITSC.
However, most of the studies only focused on either of these two faults, while few of them have considered these two occurring together. As an improvement, this paper investigates the composite fault composed by these two faults, focusing on the stator vibration.
2. Theoretical analysis
The magnetic flux density (MFD) is indicated in Eq. (1) [8]:
where and are MFD in normal condition and composite fault, respectively, , are the fundamental frequency of magnetomotive force (MMF) under normal condition and the composite fault (), respectively, is the 2nd harmonic component of the reverse MMFs produced by RITSC.
The MPPUA on the stator under normal condition and composite fault is shown in Eq. (2), and their amplitudes are shown in Table 1. The subscript in the equations stands for normal condition, while stands for the composite fault.
Table 1Amplitudes of MPPUA on stator under SAERISC
Component | Amplitude of MPPUA |
0 Hz | |
50 Hz | |
100 Hz | |
150 Hz | |
2000 Hz |
As indicated in Eq. (2) and Table 1, normally, the stator is affording a constant force and a pulsating force at 2, of which the constant one will not generate vibrations. When the composite fault occurs, MPPUA has a constant force and 1st-4th harmonics. Keeping SAGE constantly, the 2nd harmonic will be decreased as the RITSC develops, but the 4th harmonic will be increased. However, with the increment of SAGE, the DC component and the 1st-4th harmonics will be all increased.
3. Study on simulation and experiment
3.1. Object and methods
The digital simulation with Ansoft Maxwell is taken together with the experiment for the object of SDF-9 type fault simulating generator, as indicated in Fig. 1(a). The rotor is kept to the underframe by the bearing pedestal, while the stator can be moved along the horizontally radial direction by adjusting the screws so that different faulty degrees of SAGE can be simulated, as shown in Fig. 1(b). Meanwhile, there are several short circuit taps of the excitation winding on the generator which can be connected to simulate different degrees of RITSC. The stator vibration is sampled and collected by a CD-21C velocity sensor and a U60116C collector. More details about the corresponding parameters of the generator are shown in Table 2.
The simulation model is shown in Fig. 1(c), where SAGE is modeled by shifting the rotor of 12.5 %, 25 %, and 37.5 % degree, respectively, which have also been set in the experiment. The short circuit is set to 10 % degree, 20 % degree and 30 % degree, respectively.
Table 2Primary parameters of study object
Parameters | Values | Parameters | Values |
Rated capacity | 7.5 kVa | Radial air-gap length | 0.8 mm |
Rated exciting current | 1.5 A | Number of exciting slots per pole | 6 |
Rated rotation speed | 3000 r/min | Number of exciting turns peer pole | 480 |
Number of pole pairs | 1 | Number of stator slots | 24 |
Polar distance | 252 mm | Power factor | 0.8 |
Fig. 1Study object: a) generator outlook, b) method to set static eccentricity, c) simulation model
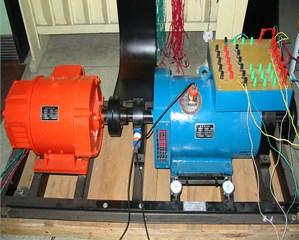
a)
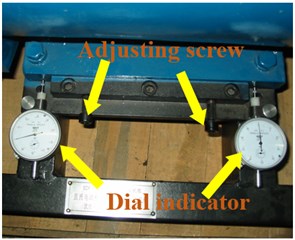
b)
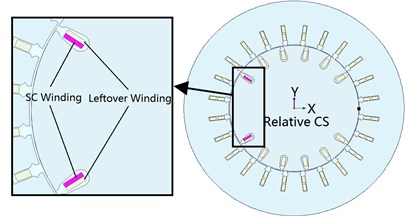
c)
3.2. Results and discussion
3.2.1. Different RITSC degrees with constant SAGE
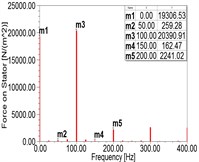
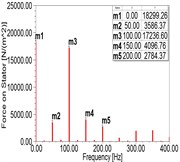
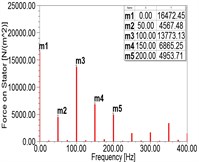
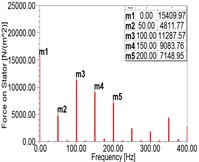
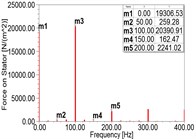
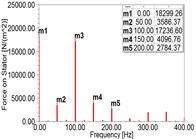
According to the simulation results, as shown in Fig. 2(a)-(d) and Table 3, with the increment of RITSC, the 2nd harmonic of MPPUA decreases while the 4th harmonic increases. Compared with the faulty condition composed by 12.5 % SAGE and 0 % RITSC, as RITSC is increased to 10 %, 20 %, 30 %, respectively, the 2nd harmonic of MPPUA decreased by 25.0 %, 40.0 %, and 50.9 %, while the 4th harmonic increased by 11.3 %, 98.0 %, and 185.7 %.
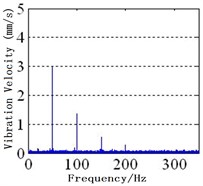
Fig. 2Spectra of MPPUA and vibration: a)-d) MPPUA under normal condition, 12.5 % SAGE and 10 % RITSC, 12.5 % SAGE and 20 % RITSC, and 12.5 % SAGE and 20 % RITSC, respectively, e)-h) stator vibrations under normal condition, 12.5 % SAGE and 3 % RITSC, 12.5 % SAGE and 6 % RITSC, and 12.5 % SAGE and 12 % RITSC, respectively
a)
b)
c)
d)
e)
f)
g)
h)
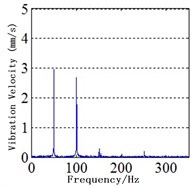
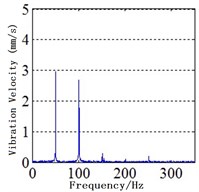
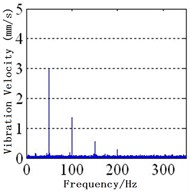
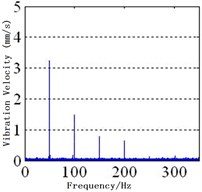
As indicated in Fig. 2(e)-(h) and Table 4, it is shown that, keeping SAGE at 12 %, the corresponding decease rates from no RITSC to 12 % RITSC for the 2nd harmonic are 60.8%, 74.5 %, and 82.4 %, respectively, while the rise rates for the 4th harmonic are 230 %, 400 %, and 800 %. In addition, there is also stator vibration at fundamental frequency due to the rotor vibration transmission and the asymmetry inside the generator. Combined with the foregoing, the simulation analysis and the experimental study are generally consistent with the theoretical analysis.
Table 3Amplitude of MPPUA obtained from simulation under different conditions (N/m2)
Working conditions | 50 Hz | 100 Hz | 150 Hz | 200 Hz |
Normal | 259.28 | 20390.91 | 162.47 | 2241.02 |
SAGE = 12.5 % RITSC = 0 % | 284.94 | 22997.80 | 187.89 | 2501.83 |
SAGE = 12.5 % RITSC = 10 % | 3586.37 | 17236.60 | 4096.76 | 2784.37 |
SAGE = 12.5 % RITSC = 20 % | 4567.48 | 13773.13 | 6865.25 | 4953.71 |
SAGE = 12.5 % RITSC = 30 % | 4811.77 | 11287.57 | 9083.76 | 7148.95 |
Table 4Amplitude of stator vibration under different conditions (mm/s)
Working conditions | 50 Hz | 100 Hz | 150 Hz | 200 Hz |
Normal | 2.95 | 2.7 | 0.3 | 0.1 |
SAGE = 12.5 % RITSC = 0 % | 2.30 | 3.7 | 0.3 | 0.1 |
SAGE = 12.5 % RITSC = 3 % | 3 | 1.45 | 0.55 | 0.33 |
SAGE = 12.5 % RITSC = 6 % | 3.1 | 0.94 | 0.35 | 0.5 |
SAGE = 12.5 % RITSC = 12 % | 2.79 | 0.65 | 0.47 | 0.9 |
3.2.2. Different degrees of SAGE with constant RITSC
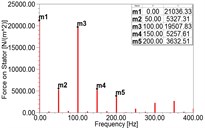
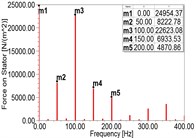
In faulty conditions, the DC component and the 1st-4th harmonics of the MPPUA increase with the increment of SAGE, as illustrated in Fig. 3(a)-(d) and Table 5. When the degree of SAGE varies from 0 % to 37.5 % but meanwhile keeping RITSC at 10 %, the amplitude of the fundamental frequency component is increased by 42.6 %, 111.9 % and 227 %, respectively, while the 2nd harmonic is increased by 11.1 %, 25.6 %, and 45.8 %. Moreover, the 3rd harmonic is increased by 26.1 %, 61.8 %, and 113.4 %, and the 4th harmonic increased by 28.1 %, 67.1 %, and 124.0 %.
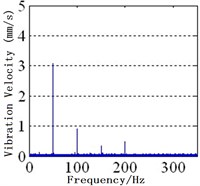
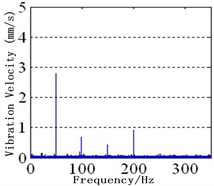
Fig. 3Spectra of MPPUA and vibration: a)-d) MPPUA under normal condition, 12.5 % SAGE and 10 % RITSC, 25.0 % SAGE and 10 % RITSC, and 37.5 % SAGE and 10 % RITSC, respectively, while e)-h) stator vibrations under normal condition, 12.5 % SAGE and 3 % RITSC, 25.0 % SAGE and 3 % RITSC, and 37.5 % SAGE and 3 % RITSC, respectively
a)
b)
c)
d)
e)
f)
g)
h)
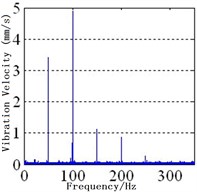
The experimental results are shown in Fig. 3(e)-(f) and Table 6. The 1st-4th harmonics will be increased with the development of SAGE, keeping the RITSC degree unchanged. As illustrated in Table 6, compared with the faulty condition of 0 % SAGE and 3 % RITSC, when the faulty degree of SAGE is 12.5 %, 25.0 %, and 37.5 %, respectively, the amplitude of the fundamental frequency component is increased by 0.7 %, 10.1 %, and 17.4 %, while the 2nd harmonic is increased by 20.8 %, 33.3 %, and 312.5 %. At the mean time, the 3rd harmonic is increased by 37.5 %, 100.0 %, and 166.7 %, while the 4th harmonic is increased by 120 %, 366.7 %, and 466.7 %. This shows that the simulation and the experiment results match the previously theoretical deduction well.
Table 5Amplitude of MPPUA obtained from simulation under different conditions (N/m2)
Working conditions | 50 Hz | 100 Hz | 150 Hz | 200 Hz |
Normal | 259.28 | 20390.91 | 162.47 | 2241.02 |
SAGE = 0 % RITSC = 10 % | 2514.23 | 15512.35 | 3249.70 | 2174.91 |
SAGE = 12.5 % RITSC = 10 % | 3586.37 | 17236.60 | 4096.76 | 2784.37 |
SAGE = 20.0 % RITSC = 10 % | 5327.31 | 19507.83 | 5257.61 | 3632.51 |
SAGE = 37.5 % RITSC = 10 % | 8222.78 | 22623.08 | 6933.53 | 4870.86 |
Table 6The amplitude of stator vibration under different conditions (mm/s)
Working conditions | 50 Hz | 100 Hz | 150 Hz | 200 Hz |
Normal | 2.95 | 2.70 | 0.30 | 0.10 |
SAGE = 0 % RITSC = 3 % | 2.98 | 1.20 | 0.40 | 0.15 |
SAGE = 12.5 % RITSC = 3 % | 3.00 | 1.45 | 0.55 | 0.33 |
SAGE = 20.0 % RITSC = 3 % | 3.28 | 1.60 | 0.80 | 0.70 |
SAGE = 37.5 % RITSC = 3 % | 3.50 | 4.95 | 1.15 | 0.85 |
4. Conclusions
This paper investigates the stator vibration response under the normal condition and the composite fault composed by SAGE and RITSC. According to the results, primary conclusions can be drawn up as follows.
1) The spectrums of both MPPUA and stator vibration consist of 2nd harmonic in normal condition while composed by 1st-4th harmonics under composite fault.
2) With the development of RITSC while SAGE remains unchanged, the amplitudes of 2nd harmonic of MPPUA and stator vibration decrease and 4th harmonic increase.
3) The spectrums of MPPUA and stator vibration are composed by 1st-4th harmonics which increase with the development of SAGE though the degree of RITSC unchanged.
References
-
Tan Shanjun Research on steam turbine generator eccentric fault cross characteristics and diagnostic methods. China Electric Power (Technology Edition), Vol. 12, 2012, p. 39-43.
-
Chen Quantao, Yang Xiangyu On line detection of interturn short-circuit fault in generator rotor windings. Small and Special Electrical Machines, Vol. 4, 2008, p. 25-27+56.
-
Wan Shuting, He Yuling, Tang Guiji, Li Yonggang Analysis on stator circulating current characteristics under eccentricity faults of turbo-generator. High Voltage Engineering, Vol. 6, 2010, p. 1547-1553.
-
Zarko D., Ban D., Vazdar I., Jaric V. Calculation of unbalanced magnetic pull in a salient-pole synchronous generator using finite-element method and measured shaft orbit. IEEE Transactions on Industrial Electronics, Vol. 59, Issue 6, 2012, p. 2536-2549.
-
Wu L. J., Zhu Z. Q., Chen J. T., Xia Z. P. An analytical model of unbalanced magnetic force in fractional-slot surface-mounted permanent magnet machines. IEEE Transactions on Magnetics, Vol. 46, Issue 7, 2010, p. 2686-2700.
-
Wan Shuting Analysis of Detection Method and Research on the Cross Feature of Winding Short Circuit and Eccentricity Composite Faults. North China Electric Power University, Baoding, 2005.
-
He Yuling Analysis on Mechanical and Electrical Characteristics of Generator under Air-Gap Eccentricity and Winding Short Circuit Composite Faults. North China Electric Power University, Beijing, 2012.
-
Tang Yunqiu Electrical Motor (Version 4). China Machine Press, Beijing, 2011.
About this article

This work is in part supported by National Natural Science Foundation of China (51307058), Natural Science Foundation of Hebei Province, China (E2014502052, E2015502013), and Chinese Fundamental Research Funds for the Central Universities (2015ZD27).
