Abstract
Base on the phase I project of Nanjing metro line IV, the blasting vibration response of shallow buried tunnel in complex urban environment was studied with ANSYS/LS-DYNA, the real load change was simulated with the loading way of measured stress curve, and there was a consistent between numerical simulation results and the measured data. The numerical results indicated that the velocity distribution in different directions were close in the close area (0-2 m); the vertical seismic wave attenuated at the fastest speed in the transferring process, and the radial seismic wave attenuated the fastest in the excavation direction ; in the distance from 2 m to 5 m, the tangential and radial vibration of the initiating side were both obviously larger than the other side of the core tube, which was still more violent than the vertical vibration, and the difference decreases with the distance increases. In the surrounding rocks , the radial vibration velocity was the biggest and attenuated at the fastest speed, which was close to linear attenuation ;the tangential vibration velocity is the smallest with the a relatively gentler damping, the vertical vibration attenuated until 8 m and then increased gradually and the resultant velocity obeyed the exponential damping law.
1. Introduction
The surrounding environment of urban subway tunnel is very complex and there will be serious threat to the construction of nearby building and underground pipe network security under the mine method construction. So it is essential to deeply study the effect of blasting vibration on urban shallow tunnel to ensure the safety of other buildings and the construction speed of the tunnels.
The finite element numerical simulation method is quite effective and widely applied in solving practical engineering problems, which can give a detailed description of the characteristics of blasting vibration in time and space to provide an important basis for the research of blasting vibration control. JIANG [1] studied urban tunnel driving blasting effect with numerical simulation and found that the spectrum characteristics of earthquake waves produced by different charges were different and the attenuation of the horizontal blasting vibration was respectively slower; With the application of numerical simulation, Lu [2] found the attenuation law of the peak velocity of blasting vibration with the increasing of distance, and Li [3] studied the vibration damage induced by blasting on double-track tunnel, and got the distribution law of the maximum principal stress of the particles of the driving tunnel and adjacent tunnels; Zhou, et al. [4] combined the numerical simulation and viscous rock blasting vibration express, which was based on the introduction of the term of medium damping, and made a comparative analysis the attenuation law of vibration frequency of blasting seismic wave propagation caused by spherical and column charge. The references above provide an important reference for the tunnel blasting vibration effect study.
The phase I project of Nanjing metro line IV is at the interval of Cloud Road station and Gulou station, which has a length of 600 m and blasting excavation quantity of 35000 cubic meters, and the way of “small charge, short footage, slotting and subsection delay initiation” was used in the field construction. The process of blasting excavation is shown in Fig. 1. Based on this blasting excavation engineering, we used the finite element program ANSYS/LS-DYNA to study the special tunnel excavation methods and proved the reliability of numerical model. A further study on the distribution law of vibration peak of the ground and the attenuation law of the inside of surrounding rocks in the driving direction was also simulated through numerical ways.
Fig. 1Schematic diagram of blasting excavation of shallow buried tunnel
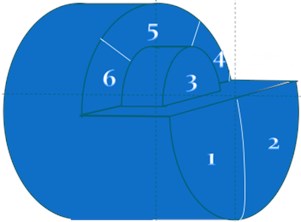
a) Blast zoning
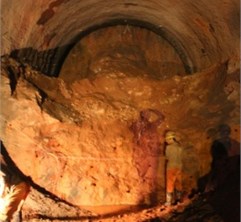
c) Field construction
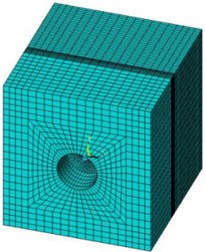
Fig. 2Numerical model
2. Numerical simulation model
2.1. Finite element model
As shown in Fig. 2, the numerical model was built according to the actual size. The section of the tunnel part was horseshoe with an external diameter of 6.5 m and a buried depth of 10 m, the bench had a height of 3.25 m with a width of 5 m, and the diameter and width of the core wall were 3.5 m and 1 m, respectively. The size of the model was 24 m×25.25 m×25 m, which contained 86484 elements, and a non-reflection boundary was set respectively on the left, right, front and back of the model to release the influence of the boundary effect. The depth of the loading surface was 0.7 m, with an element size of 0.117 m×1 m×1 m, and the size of the elements in the excavation and non-excavation direction were 0.5 m×1 m×1 m and 0.25 m×1 m×1 m, respectively.
2.2. Material behavior
The Moore-Coulomb (M-C) yield criterion and Drucker-Prager (D-P) yield Criterion are widely used to depict the geotechnical materials, and the latter one was adopt in this paper, which could be expressed as:
where and are the first and second invariant of the stress, respectively. The empirical relationship between the dynamic modulus and the dynamic elastic modulus is expressed:
The empirical relationship of static Poisson’s ratio between the dynamic Poisson’s ratio can be written as:
The strength of surrounding rock is improved by referring to the dynamic parameters of the materials used by other scholars and the modified parameters of the rock mass are shown in Table 1.
Table 1Materials mechanical parameters
Material | Type | Elastic modulus (GPa) | Poisson ratio | Bulk density (kN/m3) | Cohesion (MPa) | Internal friction angle (o) |
Tertiary surrounding rocks | Static | 15.13 | 0.25 | 27.23 | 3.77 | 50.0 |
Dynamic | 43.07 | 0.20 | 27.23 | 3.77 | 50.0 |
2.3. Loading mode
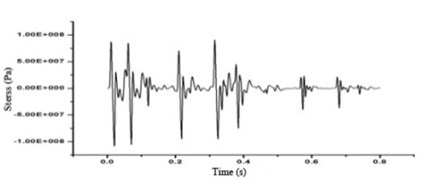
The tunnel was loading according to the measured stress curve. on the basis of the attenuation law of dominant frequency with the decrease of the distance from the explosion center, which was summed up by Xia and Li [5], namely, the vertical, radial and tangential vibration frequency of the particles out of 20 m from the blasting center, which are less than 10 %, can be regarded as unchanged and directly put in, and it can also be proved that the vibration velocity of the tunnel face has directionality. However, the normal directions of the nodes at the fan-shaped area of the zoning 4 of the model are not all along the coordinate system, and the velocity components cannot be input parameters. So, the stress is selected as blasting vibration input (Fig. 4) through the conversion of measured velocity time-dependent curves (Fig. 3) with the formula as followed:
where is the material density (kg/m3), is the velocity of P-wave in the material (m/s) and is the particle vibration velocity in the wave propagation direction (m/s). In the loading process, the stress values were defined as arraies and sequentially loaded to the zoning 4 and five loading surfaces of the fan-shaped area with a depth of 0.75 m.
Fig. 3Collected blasting vibration signals
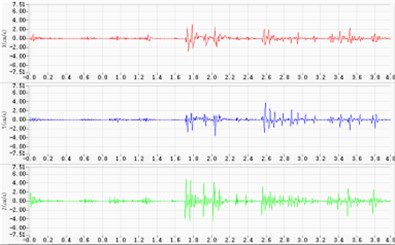
Fig. 4Blasting vibration load of the numerical model
3. Numerical simulation results and discussion
3.1. Comparison of numerical simulation and measured data
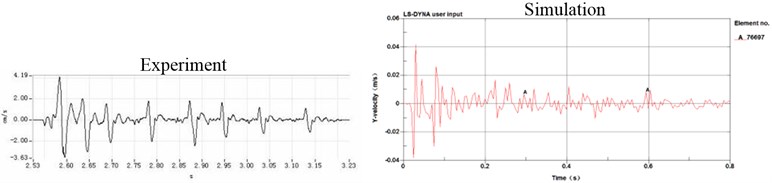
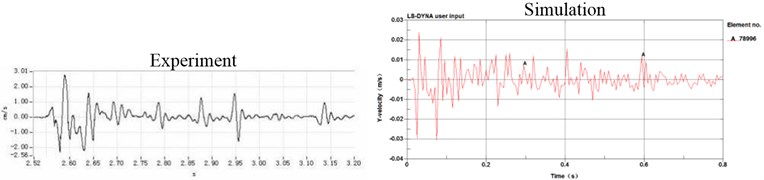
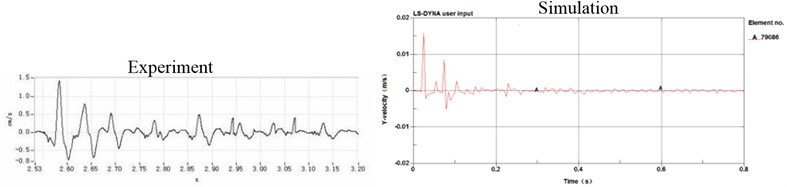
According to the conclusion [6] that the vibration velocity peak values of the ground surface generated by blasting seismic waves have a large fluctuation within the scope of 10 m. So, five measuring points were selected in the relative front, back and side of the tunnel face to the ground face, which are defined Ve010-Ve05, with intervals of 2 m, 2 m, 3 m, 5 m, successively. The comparison of part of the measured data and numerical simulation result of the vertical velocity are shown in Fig. 5.
To ease the simulation calculation and model building, the surrounding rock material was regarded isotropic body. From Fig. 5, it can be seen that there was a good matching between the measured data and numerical simulation result regardless of the certain differences, which attribute to special geological phenomena, such as cracks, joints, faults, lava development, et al.
Through the analysis of the data of the simulation results, the lag defects of the measurement can be made up, and the blasting design scheme can get improved and optimized with the combination of measured data and numerical data, and it can also give more reliable basis for the blasting vibration control.
Fig. 5Time-history curves of radial blasting vibration of ground
a) Vibration response of Ve01
b) Vibration response of Ve03
c) Vibration response of Ve05
3.2. Vibration response of tunnel ground surface in different directions
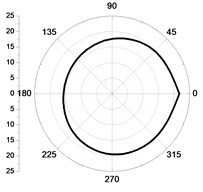
In order to study the distribution law of the vibration responses in different directions, several elements were select, which were at the distance of 2 m, 5 m and 10 m, respectively from the circle center of ground surface, which is vertical to the zoning 4 of shallow buried tunnel face. The vibration values of every elements in three directions are shown in Fig. 6.
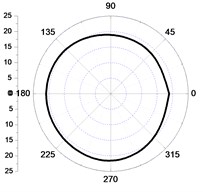
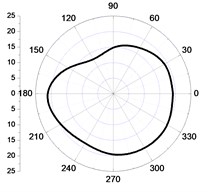
Comparing Fig. 6(a) and Fig. 6(b), and Fig. 6(c) and Fig. 6(d), respectively, and it can be found the tangential and vertical vibration velocity values of the left elements of the core wall were bigger than the right within the distance of 5 m from the central point, and the radial vibration velocity values were bigger at the right (Fig. 6(e), Fig. 6(f)). Within the scope of 2 m, the vibration velocity values in the excavation and non-excavation direction were close, which can be seen from Fig. 6(a), (c), (e), and the vibration velocity values in the excavation direction were bigger than the excavated part, which was more obvious with the increase of the distance. Within the distance from 2 m to 5 m, the decay of tangential and radial vibration values were lower than the vertical vibration velocity values. Because the stresses were loaded in sector area, which were asymmetry in directions and values, so, the distribution of the vibration velocity values were irregular.
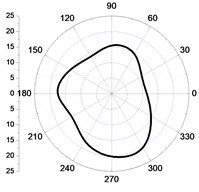
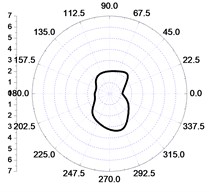
The vibration distribution at the distance of 10 m (Fig. 6(g) to Fig. 6(i)) showed that the vibration velocity values in the excavation direction were bigger than the values in the non-excavation direction. And in Fig. 6(g) and Fig. 6(h), the lateral component of the tangential and vertical vibration velocity values were bigger than the values in both excavation and non-excavation direction, which leaded to a groove in the two vibration graphs, respectively. However, the distribution of the radial vibration velocity was opposite to the tangential and vertical vibration velocity, which had a faster decay in the excavation direction, so there was a groove in the non-excavation direction.
So, it can be concluded that, in the close zone (0-2 m), the distribution of the vibration velocities in different directions are close .The vertical blasting seismic wave attenuates fastest in the transferring progress, and the radial blasting seismic wave attenuates the slowest in the side of the tunnel, although it has the quickest attenuated velocity in the excavation direction. In the area from 2 m to 5 m, the tangential and radial vibration of the initiating side are both obviously larger than the other side of the core tube, which is still more violent than the vertical vibration, and the difference decreases with the distance increases.
Fig. 6Schematic diagram of the vibration distribution within 10 m
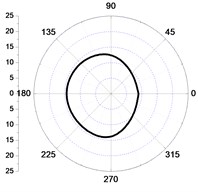
a) 2 m-tangential
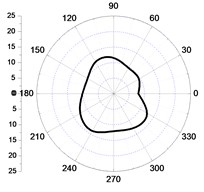
b) 5 m-tangential
c) 2 m-vertical
d) 5 m-vertical
e) 2 m-radial
f) 5 m-radial
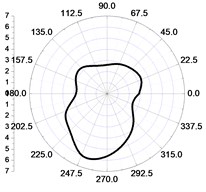
g) 10 m-tangential
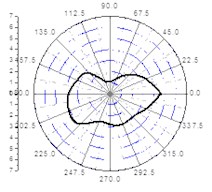
h) 10 m-vertical
i) 10 m-radial
3.3. Vibration response of the inside of the surrounding rocks
Because there is an airshaft engineering under building and a civil air defense projects underground, so it is quite essential to study the inner vibration of the surrounding rocks to prevent the damage effect of the seismic waves on the underground structures. In the numerical simulation, the central node of the tunnel face was at the center of the bottom of the core wall, which was designated as 486. A total of 26 nodes were selected along the central axis to the inside of the surrounding rocks, and a total of 13 m was defined as the study area, where the blasting vibration in three different directions were collected in an interval of a node (Fig. 7).
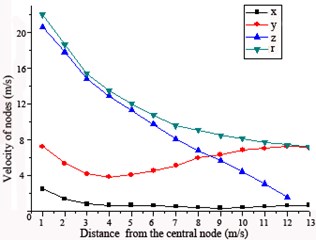
Form the curves of velocity (Fig. 8), it can be found that the radial velocity attenuates at the fastest speed and the initial peak values is the biggest; the vibration in tangential direction is unobvious and the vibration velocity attenuates at the slowest speed; the vertical vibration velocity has a gentle decay until 8 m, and after that, increase gradually, which attributed to the superposition of reflect and vibration of the ground; the resultant velocity obey the exponential damping law.
Fig. 7Schematic diagram of the collection of nodes
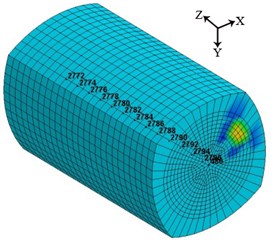
Fig. 8Vibration velocities of the nodes
4. Conclusion
Based the measuring vibration velocities, the tunnel were loaded as stress in the numerical simulation, and there was a consistent between numerical simulation and the measuring data, which proved the reliability of the numerical model. The numerical simulation results indicated that the velocity distribution in different directions were close in the close area (0-2 m); the vertical seismic wave attenuated at the fastest speed in the transferring process, and the radial seismic wave attenuated at the fastest speed in the excavation direction; in the distance from 2 m to 5 m, the tangential and radial vibration of the initiating side were both obviously larger than the other side of the core wall, which was still more violent than the vertical vibration, and the difference decreases with the distance increases.
In the surrounding rocks , the radial vibration velocity was the biggest and attenuates at the fastest speed, which was close to linear attenuation; the tangential vibration velocity was the smallest with the a relatively gentler damping, the vertical vibration attenuated until 8 m and then gradually increased; the resultant velocity obeyed the exponential damping law.
References
-
Jiang Deyi, Li Fu-Sheng, Teng Hong-Wei, et al. Smooth blasting design and optimization of large-span urban highway tunnels. Journal of Chongqing University, Vol. 31, 2009, p. 1920-1925.
-
Lu Xiaobing, Guo Yiyuan, Li Shihai Dam analysis of the third period longitudinal cofferdam of the three gorges under blast loading. Chinese Journal of Rock Mechanics and Engineering, Vol. 21, 2002, p. 158-162.
-
Su Chuang, Liu Dunwen, Xiang Haibo, et al. Numerical simulation of blasting induced vibration damage on double-track tunnel. Mineral Engineering Research, Vol. 25, 2010, p. 32-36.
-
Zhou Junru, Lu Wenbo, Zhang Le, et al. Attenuation of vibration frequency during propagation of blasting seismic wave. Chinese Journal of Rock Mechanics and Engineering, Vol. 33, 2014, p. 2171-2178.
-
Xia Xiang, Li Jun-Ru Udec modeling of vibration characteristics of jointed rock mass under explosion Rock and Soil Mechanics, Vol. 26, 2005, p. 50-56.
-
Dowding C. H. Blast vibration monitoring and control. Practice Periodical on Structural Design and Construction, Vol. 11, 2006, p. 8-12.
-
Alfred Hack Latest developments in tunneling technology and their perspectives. Tunnel, 2002, p. 4-6.
-
Paine A. S., Please C. P. An improved model of fracture propagation by gas during rock blasting-some analytical results. International Journal of Rock Mechanics and Mining Sciences and Geomechanics Abstracts, Vol. 31, 1994, p. 699-706.
About this article

This research was supported by the National Nature Science Foundation of China, Nos. 51339006 and 51304218.
