Abstract
A new damage imaging method of composite structure based on Lamb wave wavenumber response and Piezoelectric Transducer (PZT) 2D cross-shaped array is proposed. The 2D cross-shaped array constructed by two linear PZT arrays is placed on composite structure to acquire Lamb wave damage scattering signal in spatial domain. For each linear PZT array, a wavenumber-time image of the damage scattering signal can be obtained by using spatial FFT and a time scanning process. Based on the two images, the wavenumbers of the damage scattering signal projecting at the two arrays can be obtained. By combining with the two projection wavenumbers, the damage can be localized without blind angle. The validation performed on a composite plate shows a good damage localization accuracy of this method.
1. Introduction
Piezoelectric Transducer (PZT) and Lamb wave based damage imaging methods have been studied widely in recent ten years. These damage imaging methods can be divided into two branches called sparse PZT array based method and dense PZT array based method respectively. For sparse PZT array, the most straightforward damage imaging method is the delay-and-sum imaging [1, 2]. The main idea is to enhance the real damage point by overlapping its time domain reflection packets. Another typical sparse PZT array based imaging method is time reversal focusing method [3, 4], which makes use of Lamb wave spatial reciprocity and time reversal invariance. Damage path probability imaging has also been studied [5]. For dense PZT array, ultrasonic phased array [6, 7] has a unique feature of structural beam scanning based on phase modulation and synthesis of Lamb wave signals in time domain. Spatial filtering imaging [8, 9] and multiple signal classification [10] are the other two kinds of dense PZT array based damage imaging methods.
In this paper, a new damage imaging method of composite structure based on dense PZT array is proposed. In the method, the dense PZT array is a 2D cross-shaped array which is constructed by two linear PZT arrays. For each linear PZT array, the spatial sampling of damage scattering signal is realized. By combing spatial FFT with a time scanning process, a wavenumber-time image can be obtained. According to the two images, the wavenumbers of the damage scattering signal projecting at the arrays can be obtained. The damage can be localized without blind angle based on the two projection wavenumbers. Finally, the method function is validated on a carbon fiber laminate plate.
2. The new damage imaging method
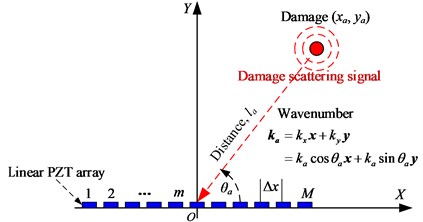
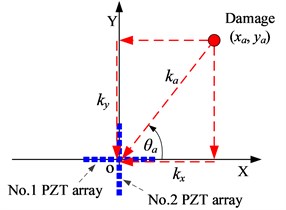
There is a linear PZT array placed on a structure as shown in Fig. 1. It consists of M PZTs numbered as 1, 2,…, and the distance between each two adjacent PZTs is . A coordinate is built on the array. The center point of the array is set to be the original point.
There is a damage located at (, ). The direction and distance of the damage relative to the linear PZT array are supposed to be and respectively. To obtain the damage scattering signal, a frequency narrowband excitation of central frequency is input to the PZT at the original point to excite frequency narrowband Lamb wave. Based on the studies [6, 7], the amplitude of Lamb wave mode is dominant at low excitation frequency. Thus, the damage scattering signal can be approximated to be single-mode when the frequency is low. The wavenumber of the damage scattering signal is denoted as . It is wavenumber narrowband and it can be considered as two components. The first is the wavenumber projecting at the array direction (-axis) and the second is the -axis projection wavenumber .
Fig. 1Lamb wave spatial sampling by a linear PZT array
The linear PZT array can be regarded as a spatial sampling device to acquire spatial response of the damage scattering signal. The spatial sampling rate is . The spatial response acquired by the linear PZT array at time can be represented as Eq. (1):
where is the damage scattering signal acquired by the PZT located at (, 0) at time , . and 1,…, .
For one time spatial sampling of the damage scattering signal of wavenumber narrowband at low excitation frequency, can be represented as Eq. (2), in which, is the normalized amplitude. and represent the distance vector of and :
Based on Fraunhofer approximation, Eq. (2) can be approximated to be Eq. (3), in which, denotes the unit direction vector of the . In far-field situation, the damage scattering signal can be regarded as a planar wave received by the linear PZT array [7]. Thus, Eq. (3) can be approximated to be Eq. (4):
By using spatial FFT, the spatial response shown in Eq. (1) can be transformed to wavenumber response shown in Eq. (5), in which, is the Dirac function:
It can be seen from Eq. (5) that the wavenumber of the spatial sampling signal is the wavenumber of the damage scattering signal projecting at the -axis in far-field situation. Thus, based on the wavenumber response obtained by using spatial FFT, the wavenumber which is corresponding to the maximum amplitude of the wavenumber response is the wavenumber of damage scattering signal projecting at the -axis.
However, the accurate wavenumber of high spatial resolution is difficult to be obtained because the length of the linear PZT array is limited and only small amount of PZTs are allowed to be used in practical application. But in this method the goal is to realize damage localization not to measure the accurate wavenumber, thus it is enough if the wavenumber which is corresponding to the maximum amplitude can be obtained correctly. This goal can be achieved if one spatial cycle of the signal can be acquired completely by using the linear PZT array. To increase the wavenumber resolution of spatial FFT, the method of padding zeros is adopted. The length of padding zeros can be calculated by Eq. (6), in which, is the length of padding zeros, is the length of the linear PZT array and is wavenumber resolution:
Fig. 2 gives out an example of the spatial FFT of the spatial sampling signal on an aluminum plate. The length of the array is 7 (7 PZTs), 0.09 m, and 0.1 rad/m. Thus, based on Eq. (6), 6974 zeros are padded to the signal and 3487 zeros on each side. The theoretic wavenumber of the signal is 212.2 rad/m. As it can be seen from Fig. 2 that the wavenumber which is corresponding to the maximum amplitude of the wavenumber response is very close to the theoretic wavenumber. The range of the wavenumber response is from to . is the maximum cutoff wavenumber of the spatial sampling and . The length of the wavenumber response is .
Fig. 2An example of spatial FFT based wavenumber response calculation
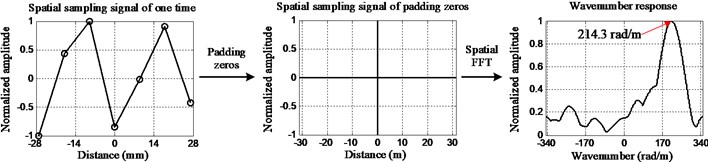
Fig. 3Time scanning and damage imaging
a) Demonstration of damage imaging process
b) Example of damage imaging result
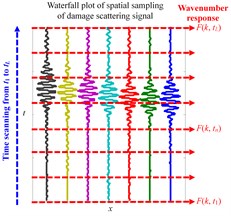
As discussed above, the spatial FFT can be used to calculate the wavenumber response of damage scattering signal of one time spatial sampling at time . It can be also applied to the damage scattering signal of times spatial sampling. This process can be regarded as a time scanning process performed from to , as shown in Fig. 3(a). The waterfall plot of damage scattering signal is constructed by times spatial sampling from to . Based on the time scanning process, a matrix of wavenumber response at different time can be obtained as .
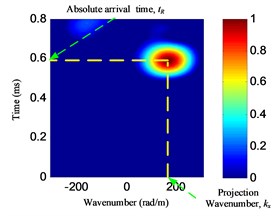
Finally, a wavenumber-time image can be generated by imaging the matrix , as shown in Fig. 3(b). In the wavenumber-time image, the wavenumber and the time corresponding to the point of the highest pixel value can be estimated to be the -axis projection wavenumber and the absolute arrival time of the damage scattering signal respectively.
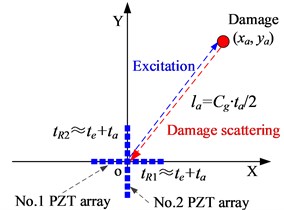
For damage localization, a 2D cross-shaped array is used and it is constructed by two linear PZT arrays which are numbered as No. 1 and No. 2 respectively as shown in Fig. 4. The center point of the array is set to be the origin point. The Lamb wave is excited at the origin point at time . When the damage scattering signal is acquired by the array, the axis projection wavenumber and the absolute arrival time (, ) of No. 1 PZT array and the (, ) of No. 2 PZT array can be obtained by using the damage imaging method.
Fig. 4Damage localization based on 2D cross-shaped array
a) Damage direction estimation
b) Damage distance estimation
For damage direction estimation as shown in Fig. 4(a), based on and , the direction can be calculated by Eq. (7). It shows that can be calculated from 0° to 360° without blind angle. For damage distance estimation as shown in Fig. 4(b), the damage distance can be calculated by Eq. (8) combing with Lamb wave group velocity . Finally, the damage localization result can be obtained as and :
3. Validation on a carbon fiber laminate plate
The validation system shown in Fig. 5 is constructed by a carbon fiber laminate plate, a 2D cross-shaped array and a Lamb wave based SHM system. The dimension of the composite plate is 600 mm×600 mm×2.25 mm (length×width×thickness). Each linear PZT array of the 2D cross-shaped array is constructed by 7 PZTs. The distance between the centers of each two adjacent PZTs is 10 mm. The maximum cutoff wavenumber of the array is 314 rad/m. The PZTs in No.1 PZT array are labeled as PZT 1-1,…, PZT 1-7 and the PZTs in No. 2 PZT array are labeled as PZT2-1,…, PZT 2-7. A PZT used as an actuator for Lamb wave excitation is placed at the center point of the array on the opposite side of the plate. Another 3 reference PZTs labeled as Ref1 to Ref3 are used to measure Lamb wave group velocity. The mass block is used to change the local stiffness of the structure to simulate damage [2, 4]. Totally 7 damages labeled as A to G are simulated on the structure. The SHM system is adopted to excite and acquire Lamb wave signals. The excitation signal is a five-cycle sine burst modulated by Hanning window [2]. The excitation frequency is 35 kHz and the amplitude is ±70 volts. The sampling rate is 10 MS/s and the sampling length is 8000 samples including 1000 pre-samples.
Fig. 5The validation system on the composite plate
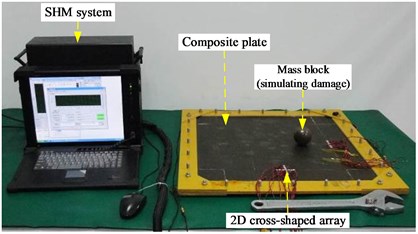
a) Experiment system
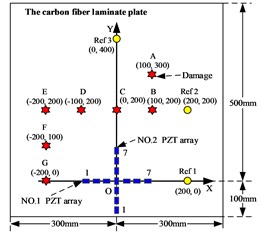
b) The array and the damage
Fig. 6Health reference signal
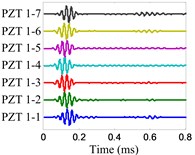
a) No. 1 array
b) No. 2 array
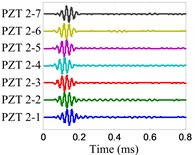
Fig. 7On-line damage monitoring signal
a) No. 1 array
b) No. 2 array
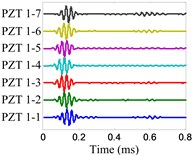
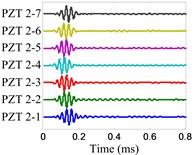
Fig. 8Damage scattering signal of damage E
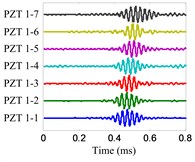
a) No. 1 array
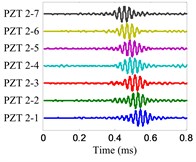
b) No. 2 array
Fig. 9Wavenumber-time images of damage E
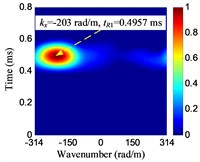
a) No. 1 array
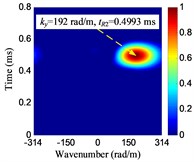
b) No. 2 array
Table 1Damage localization results of the composite plate
Damage label | (, ) (rad/m, ms) | (, ) (rad/m, ms) | Localized result (°, mm) | Actual position (°, mm) | (mm) |
A | (92, 0.5415) | (251, 0.5479) | (69.9, 313.7) | (71.6, 316.2) | 9.7 |
B | (128, 0.4274) | (237, 0.4240) | (61.6, 228.0) | (63.4, 223.6) | 8.4 |
C | (4, 0.3785) | (264, 0.3758) | (89.1, 193.4) | (90.0, 200.0) | 7.3 |
D | (-132, 0.4121) | (247, 0.4189) | (118.1, 220.7) | (116.6, 223.6) | 6.7 |
E | (-203, 0.4957) | (192, 0.4993) | (136.6, 279.2) | (135.0, 282.8) | 8.6 |
F | (-253, 0.4330) | (119, 0.4272) | (154.8, 232.0) | (153.4, 223.6) | 10.0 |
G | (-284, 0.3943) | (5, 0.3974) | (179.0, 207.6) | (180.0, 200.0) | 8.4 |
The damage E is selected to be an example to show the damage imaging and localization process. The health reference signal and on-line monitoring signal of the array are shown in Fig. 6 and Fig. 7 respectively. The damage scattering signal extracted by subtracting from are shown in Fig. 8. The damage imaging method is applied to the damage scattering signal. The wavenumber resolution of spatial FFT is set to be 1 rad/m. Fig. 9 shows the damage imaging results of the damage E.
For damage direction estimation, –203 rad/m and 192 rad/m can be obtained from the images. According to Eq. (7), the damage direction 136.6° is obtained. For damage distance estimation, the excitation time must be obtained first. By using the wavelet transform [2], the envelope of the excitation signal can be obtained. The time which is corresponding to the maximum value of the envelope is judged to be the excitation time, 0.1059 ms. The arrival time 0.4957 ms and 0.4993 ms can be obtained based on the damage imaging results shown in Fig. 9. The method based on wavelet transform [2] is also used to measure the group velocity. The average group velocity 1425.8 m/s is obtained and used. Based on Eq. (8), the damage distance is 279.2 mm. Finally, the damage position is obtained to be (–202.8 mm, 191.8 mm). The damage localization error is 8.6 mm.
The damage localization results of the 7 damages are listed in Table 1. It indicates that the damage localization results are in good agreement with the actual damage positions, and the maximum damage localization error is less than 1 cm. The whole abovementioned damage imaging and localization process for one damage can be finished in less than 5 seconds on a common laptop computer by using MATLAB 2009a.
4. Conclusion
This paper proposes a new on-line damage imaging method based on Lamb wave wavenumber response and PZT 2D cross-shaped array. The method is validated on a composite plate and the validation results show that the damage localization error is less than 1cm. It is simple and high efficiency, and it can be applied to on-line damage monitoring of composite structure easily.
References
-
Hall J. S., Michaels J. E. Computational efficiency of ultrasonic guided wave imaging algorithms. IEEE Transactions on Ultrasonics, Ferroelectrics, and Frequency Control, Vol. 58, Issue 1, 2011, p. 244-248.
-
Qiu L., Liu M., Qing X., Yuan S. A quantitative multidamage monitoring method for large-scale complex composite. Structural Health Monitoring, Vol. 12, 2013, p. 183-196.
-
Wang C. H., Rose J. T., Chang F. K. A synthetic time-reversal imaging method for structural health monitoring. Smart Materials and Structures, Vol. 13, Issue 2, 2004, p. 415-423.
-
Cai J., Shi L., Yuan S., Shao Z. High spatial resolution imaging for structural health monitoring based on virtual time reversal. Smart Materials and Structures, Vol. 20, Issue 5, 2011, p. 055018.
-
Zhou C., Su Z., Cheng L. Quantitative evaluation of orientation-specific damage using elastic waves and probability-based diagnostic imaging. Mechanical Systems and Signal Processing, Vol. 25, Issue 6, 2011, p. 2135-2156.
-
Yu L., Giurgiutiu V. In situ 2-D piezoelectric wafer active sensors arrays for guided wave damage detection. Ultrasonics, Vol. 48, Issue 2, 2008, p. 117-134.
-
Holmes C., Drinkwater B. W., Wilcox P. D. Advanced post-processing for scanned ultrasonic arrays: application to defect detection and classification in non-destructive evaluation. Ultrasonics, Vol. 48, Issue 6, 2008, p. 636-642.
-
Qiu L., Yuan S., Liu B. A spatial filter and two linear PZTs arrays based composite structure imaging method. Journal of Vibroengineering, Vol. 17, Issue 3, 2015, p. 1218-1231.
-
Wang Y., Yuan S., Qiu L. Improved wavelet-based spatial filter of damage imaging method on composite structures. Chinese Journal of Aeronautics, Vol. 24, Issue 5, 2011, p. 665-672.
-
Zhong Y., Yuan S., Qiu L. Multiple damage detection on aircraft composite structures using near-field MUSIC algorithm. Sensors and Actuator A: Physical, Vol. 214, 2014, p. 234-244.
About this article

This work is supported by the National Science Fund for Distinguished Young Scholars (Grant No. 51225502), the Natural Science Foundation of China (Grant No. 51205189), State Key Laboratory of Mechanics and Control of Mechanical Structures (Nanjing University of Aeronautics and Astronautics) (Grant No. 0515Y01), the Priority Academic Program Development of Jiangsu Higher Education Institutions, the Qing Lan Project and the Hong Kong Scholars Program.
