Abstract
Aerospace structures make increasing use of composite materials which can generate inner damage easily by outer impact. Thus, the damage and impact monitoring of composite structures is an important research topic of structural health monitoring (SHM) technology. Among existing SHM methods, piezoelectric transducer (PZT) array and Lamb wave based structural imaging method has become an effective approach to monitor the damage and impact. However, the anisotropic feature of the composite structures makes it difficult to achieve accurate damage and impact localization which are dependent on Lamb wave group velocity. In recent years, a linear PZT array and spatial filter based damage imaging method has been developed. But this method is only applied to damage monitoring at the current stage and it also needs the Lamb wave group velocity to fulfill the damage localization. In this paper, a spatial filter and two linear PZT arrays based structural imaging method for composite structures is proposed. With this method, an acoustic source angle-time image for each linear PZT array can be obtained by using the spatial filter technique. Then, it is transformed to an acoustic source probability-angle image of the linear PZT array. Based on the probability-angle image, the angle of the acoustic source relative to the linear PZT array can be estimated accurately. By fusing the two probability-angle images of the two linear PZT arrays, the acoustic source can be localized accurately without using the Lamb wave group velocity. Damage and impact can be both considered to be acoustic source on composite structure. Thus, they can be localized easily and accurately by using the proposed structural imaging method. This method is validated on a carbon fiber composite laminate plate, including damage imaging and impact imaging. The imaging and localization results are in good agreement with the actual damage and impact positions, and the maximum localization error is no more than 1 cm.
1. Introduction
Composite materials have been widely applied to aircraft structures in recent years, such as B787 and A350XWB [1-3]. However, the composite structures are susceptible to impact which can lead to structural inner damage easily. Hence, damage and impact monitoring of composite structures is always an important research topic in the field of Structural Health Monitoring (SHM) [4]. In the existing SHM methods, much attention has been paid to piezoelectric transducer (PZT) and Lamb wave based SHM method because it has the capability of active and passive monitoring as well as large monitoring range [5-7].
In recent decade, structural imaging methods based on PZT array and Lamb wave have been widely studied, such as delay-sum imaging [8, 9], time reversal focusing imaging [10-13], probability-based imaging [14, 15], phased array imaging [16-18], system identification [19], multiple signal classification method [20], etc. These methods utilize a large number of actuator-sensor channels from PZT array to map the structure and produce a visual indication of damage or impact position. It has the advantages of high signal-to-noise ratio, large scale structure monitoring and better fault tolerance of damage or impact localization [4].
All the aforementioned structural imaging methods are performed in time domain or frequency domain. Comparing with that, the analysis of Lamb wave in spatial-wavenumber domain is an effective approach to distinguish signal propagating direction and various signal modes. Thus, the spatial-wavenumber filtering technique has been gradually studied in recent years [21-23]. Considering the research on the spatial filter based structural imaging method, Purekar [24] used the spatial filter and a linear PZT array to realize damage imaging of an aluminum plate combining with the wavenumber mode obtained by using finite element modeling. Yuan [25] developed the spatial filter method for damage imaging of a composite plate without using any wavenumber model. However, these methods need Lamb wave group velocity to realize damage localization at the current stage. The anisotropic feature of the composite structures can lead to low damage localization accuracy. And the spatial filter is only applied to damage monitoring in the researches mentioned above. But the damage and impact are both needed to be monitored for composite structures.
To solve these problems mentioned above, this paper proposes an imaging method for damage and impact localization of composite structures based on the spatial filter and two linear PZT arrays without using Lamb wave group velocity. In this method, two linear PZT arrays are adopted to acquire Lamb wave signals introduced by structural damage or impact. The angle of the damage or impact relative to each PZT array is estimated based on a probability-angle image obtained by using the spatial filter. And then, the probability-angle images of the two linear PZT arrays are fused together and transformed to be a damage or impact coordinate image. Finally, the damage or impact position is estimated accurately by using a coordinate probability weighted algorithm based on the coordinate image.
The rest of this paper is organized as follows. The spatial filter is introduced and discussed in Section 2. In Section 3, the structural imaging method based on the spatial filter and the two linear PZT arrays without using the Lamb wave group velocity is proposed. In Section 4, the proposed imaging method is validated on a carbon fiber composite laminate plate. Finally, the conclusion is made in Section 5.
2. The principle of spatial filter
A linear PZT array constructed by PZTs is placed on the surface of a structure as shown in Fig. 1. The PZTs are numbered as 1, 2,..., . A Cartesian coordinate is constructed on the structure and the center point of the linear PZT array is set to be the origin point. The distance between each two adjacent PZTs, which is also equivalent to the spatial sampling rate, is denoted as .
Fig. 1Schematic diagram of the spatial filter
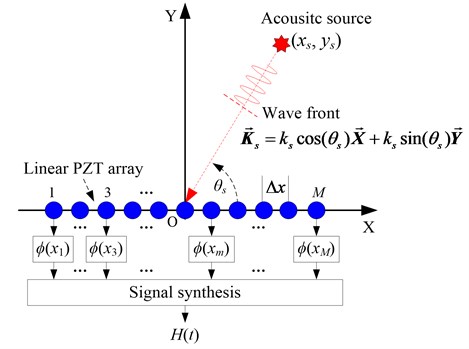
As illustrated in Fig. 1, an acoustic source occurs and excites Lamb wave signal in the structure. The position of the acoustic source is unknown and supposed to be , and the angle is assumed to be . The wavenumber of the Lamb wave signal is denoted as , and it contains the information of the Lamb wave propagation direction relative to the linear PZT array. The output of the PZT located at is represented as , where , is the label of PZT. Finally, the output synthesis signal of the linear PZT array for the acoustic source can be expressed as Eq. (1), in which, is the sampling time:
By applying a weight function to the output signal of each PZT, Eq. (1) can be rewritten to be Eq. (2). The output feature of the linear PZT array is dependent on the weight function. It is represented as Eq. (3), in which, is the angle of the weight function:
By using the spatial-wavenumber transform, Eq. (3) can be transformed to be Eq. (4):
where is the Dirac function which is expressed as Eq. (5):
It can be seen from Eq. (4) and Eq. (5) that the weight function can pass through the signal of angle and reject the signal of the other angles in the range of [0°, 180°). Therefore, similar to frequency domain signal filter, the weight function shown in Eq. (3) can be interpreted as a spatial filter. Finally, the filtered output synthesis signal of the linear PZT array, which is represented as Eq. (6), can be obtained by combining Eq. (3) with Eq. (2):
The angle of the spatial filter can be changed in the range of [0°, 180°) with the angle resolution to search the direction of the acoustic source. Then an angle-time image of the acoustic source can be obtained by imaging the filtered output synthesis signal at each angle [24].
The structural damage and impact can be both considered to be acoustic source on a structure [13]. Thus, the angle-time image of the damage or impact can be obtained by using the spatial filter. The direction of the damage or impact relative to the linear PZT array can be estimated based on the angle-time image directly. If the Lamb wave group velocity is known beforehand, the distance of the damage relative to the linear PZT array can be also obtained based on the angle-time image. But the distance of the impact is difficult to be obtained because there is no excitation reference time [13]. For anisotropic composite structures, the Lamb wave group velocity is different at different propagating direction. Thus, the damage localization error would be high by using the group velocity directly. In addition, this method can not be applied to estimate the distance of the impact. To solve these problems mentioned above, a spatial filter and two linear PZT arrays based structural imaging method is proposed in this paper.
3. Spatial filter and two linear PZT arrays based structural imaging method
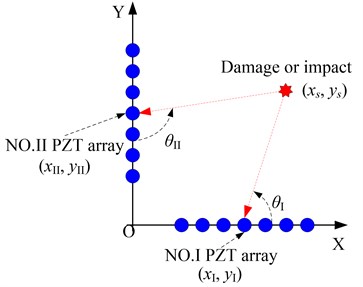
There are two linear PZT arrays placed on a structure, as shown in Fig. 2. The two linear PZT arrays are labeled as No. I and No. II, which are set to be along the - and -axes respectively. The center point of the No. I PZT array is (, ) and the center point of the No. II PZT array is (, ). If there is an acoustic source (a damage or an impact) located at (, ), then it will introduce Lamb wave signals propagating in the structure. By using the spatial filter, the angle-time image of the acoustic source relative to a linear PZT array can be obtained without using the Lamb wave group velocity.
Fig. 2The composite structure imaging method
In the angle-time image, the energy of the filtered output synthesis signal at angle can be calculated by using Eq. (7), in which, is the signal sampling length:
Then a probability-angle plot of the acoustic source can be obtained by normalizing the energy of filtered output synthesis signal at each angle. The angle of position relative to the linear PZT array can be obtained by Eq. (8). According to the probability-angle plot, the probability of the position relative to the linear PZT array can be obtained. After searching all the probabilities of the positions on the structure, an acoustic source angle image relative to the linear PZT array can be obtained by imaging the probability of each position on the structure:
As shown in Fig. 2, the final probability of the position can be obtained by fusing the acoustic source angle images of the two linear PZT arrays, which is expressed as Eq. (9):
Finally, an acoustic source coordinate image can be obtained by imaging the probability of each position. And the acoustic source can be localized based on a coordinate probability weighted algorithm which is expressed as Eq. (10):
where is the weighted position of the acoustic source, is a position on the structure, is the probability of position , and is the maximum value of and respectively.
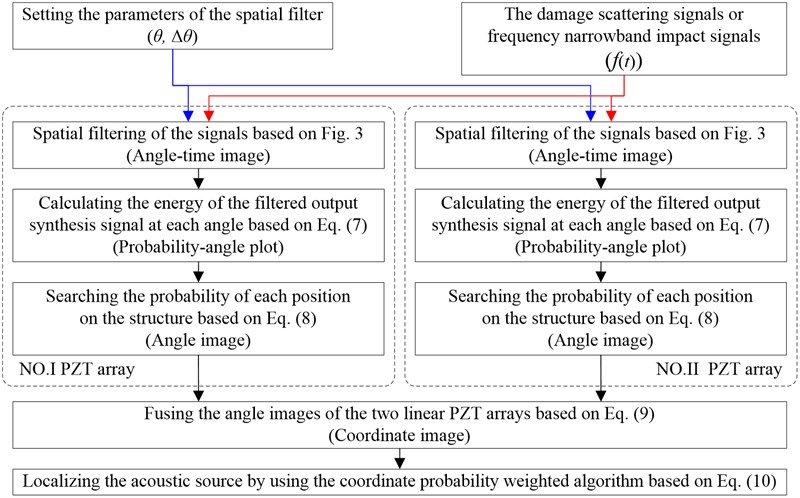
Based on the above research, the implementation process of the spatial filter is given in Fig. 3 first. And then, the composite structure imaging method based on the spatial filter and two linear PZT arrays is shown in Fig. 4.
Fig. 3Implementation process of the spatial filter
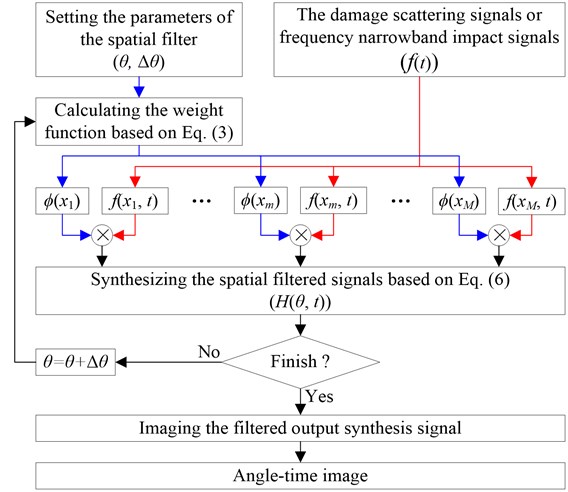
There should be noted that the Lamb wave signal is required to be frequency narrowband signal to realize spatial filter. For damage localization, this requirement can be satisfied because a frequency narrowband excitation signal can be used to excite frequency narrowband Lamb wave signal. But for impact localization, the impact response signal is frequency wideband. Thus, the complex Shannon wavelet transform is adopted to extract frequency narrowband signal from the impact response signal to fulfill the spatial filter.
The continuous complex wavelet transform of a signal can be defined as [13, 26]:
where and are scale factor and time factor respectively. The mother function of the complex Shannon wavelet transform is defined as Eq. (12) [13]:
where and are the frequency band and the central frequency of the wavelet. The function of is represented as Eq. (13):
Fig. 4The implementation process of the composite structure imaging method
The Fourier transform of Eq. (12) can be represented as Eq. (14):
where , , .
Eq. (14) indicates that the central frequency of the frequency spectrum of the complex Shannon wavelet function is at and the frequency band is limited in the range of . It means that the continuous complex Shannon wavelet transform of a signal is a frequency narrowband signal of central frequency and frequency band . Based on this principle, the continuous complex Shannon wavelet transform can be used to extract the frequency narrowband signal from the frequency wideband impact response signal.
A typical impact response signal and the corresponding frequency spectrum in the following experiment are shown in Fig. 5. The frequency range of the impact response signal is 0-60 kHz approximately. By setting the frequency band to be , the frequency narrowband signal of central frequency 30 kHz is extracted from the impact response signal, as shown in Fig. 6.
Fig. 5The impact response signal and its frequency spectrum
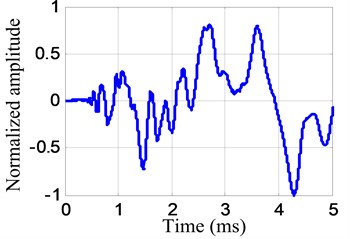
a) Impact response signal
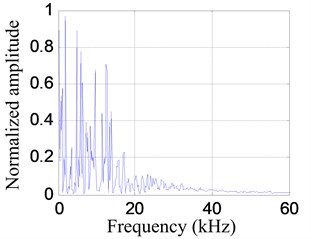
b) Frequency spectrum
Fig. 6The extracted frequency narrowband signal and its frequency spectrum
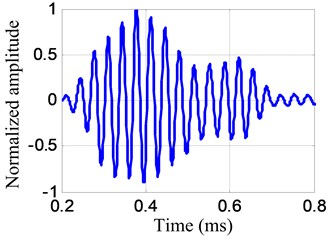
a) Frequency narrowband impact response signal
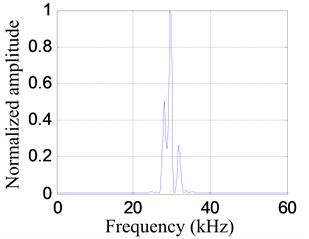
b) Frequency spectrum
4. Experimental validation
The validation experimental system shown in Fig. 7 is consisted of a carbon fiber composite laminate plate, an integrated SHM system [27] and two linear PZT arrays. The dimension of the composite plate is 60×60×0.216 cm (length×width×thickness). The composite plate is stacked by 18 single layers and the ply sequences is [45/0/–45/90/0/–45/0/–45/0. The material property of each layer is given in Table 1.
Fig. 7Experimental setup for method validation
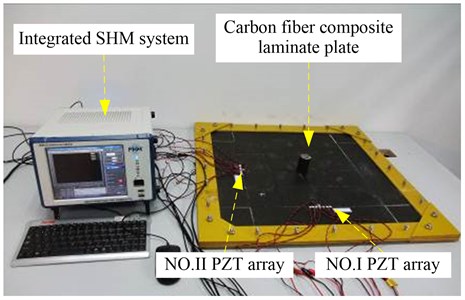
a) Experimental setup
b) Damage and impact positions
Each linear PZT array is constructed by 7 PZT-5A sensors and the distance between each two adjacent PZTs is 1 cm. The diameter and thickness of the PZT are 0.8 cm and 0.048 cm respectively. The distance between the center point of a linear PZT array and the boundary of the composite plate is 10 cm. The PZTs in No. I PZT array are labeled as PZTI-1, PZTI-2,…, PZTI-7 respectively and the PZTs in No. II PZT array are labeled as PZTII-1, PZTII-2,…, PZTII-7 respectively. A PZT used as an actuator for Lamb wave excitation is bonded at the above center position of each linear PZT array.
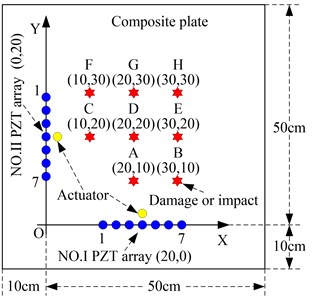
As shown in Fig. 7, a Cartesian coordinate is built on the structure. The -axis is set along the No. I PZT array and -axis is set along the No. II PZT array. The center point of the No. I PZT array is (20, 0) cm and the center point of the No. II PZT array is (0, 20) cm. The monitoring area is 50×50 cm. The damage and impact positions labeled A to H are shown in Fig. 7 and Table 2. The angle is defined according to counterclockwise direction relative to the -axis. 8 damages are applied on the positions A to H for damage imaging validation, and 8 impacts are also applied on the positions A to H for impact imaging validation.
Table 1Material property of single layer of the carbon fiber composite laminate plate
Parameter | Value |
0º tensile modulus (GPa) | 135 |
90º tensile modulus (GPa) | 8.8 |
±45º in-plane shearing modulus (GPa) | 4.47 |
Poisson ratio | 0.328 |
Density (kg·m-3) | 1.61×10³ |
Table 2The damage and impact positions for method validation
Position | Actual coordinates (cm) | (°) | (°) |
A | (20,10) | 90.0 | 63.4 |
B | (30,10) | 45.0 | 71.6 |
C | (10,20) | 116.6 | 90.0 |
D | (20,20) | 90.0 | 90.0 |
E | (30,20) | 63.4 | 90.0 |
F | (10,30) | 108.4 | 135.0 |
G | (20,30) | 90.0 | 116.6 |
H | (30,30) | 71.6 | 108.4 |
For damage imaging validation, the method of applying damage on the structure is bonding a mass block on the structure to change the local stiffness of the structure at the bonding area [28]. The excitation signal is modulated five-cycle sine burst. The center frequency of the excitation signal is 50 kHz and the amplitude is ±70 Volts. The sampling rate is 10 MHz and the sampling length is 8000 samples including 1000 pre-samples. The trigger voltage is 5 Volts.
The validation process of damage imaging is described as follows: (1) the Lamb wave signals of the two linear PZT arrays are acquired as the health reference signals when the structure is in health status. (2) Damage is applied at each position shown in Table 2 and the corresponding Lamb wave signals of the two linear PZT arrays are acquired as the on-line monitoring signals . (3) The composite structure imaging method is applied to damage imaging and localization.
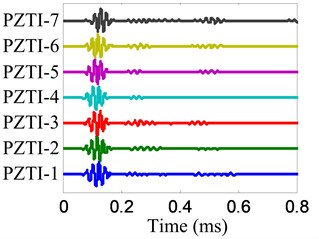
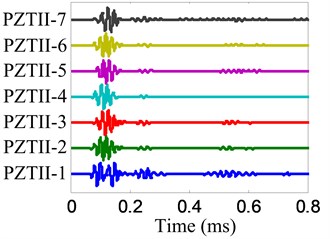
Fig. 8Health reference signals
a) No. I PZT array
b) No. II PZT array
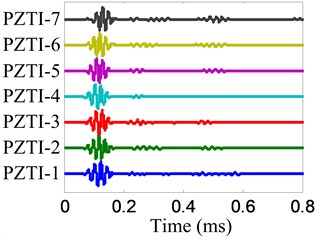
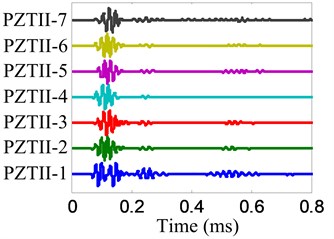
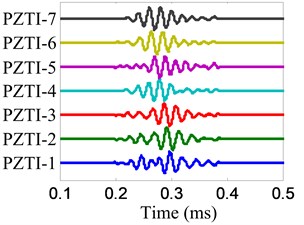
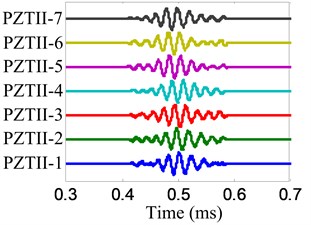
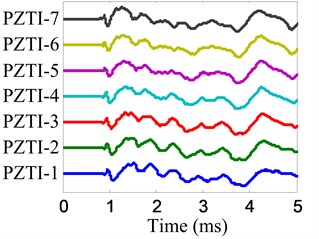
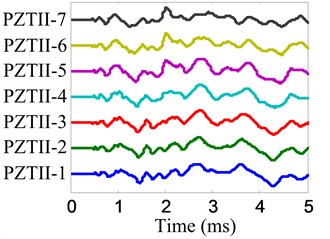
The damage imaging of position B is chosen to be an example to show the damage imaging method. The health reference signals and on-line monitoring signals of the two linear PZT arrays are shown in Fig. 8 and Fig. 9 respectively. The damage scattering signals extracted by subtracting from are shown in Fig. 10.
Fig. 9On-line monitoring signals
a) No. I PZT array
b) No. II PZT array
Fig. 10Damage-scattering signals
a) No. I PZT array
b) No. II PZT array
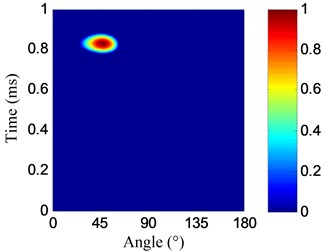
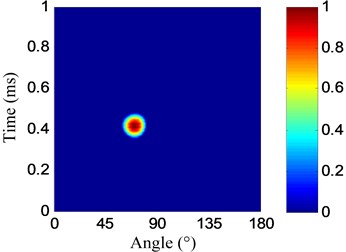
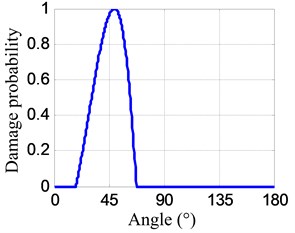
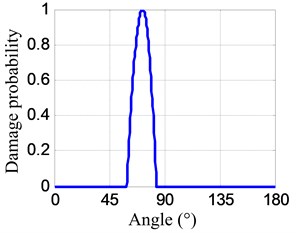
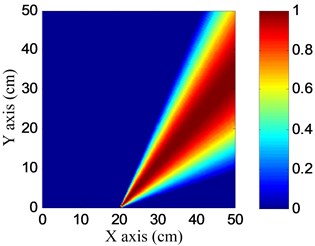
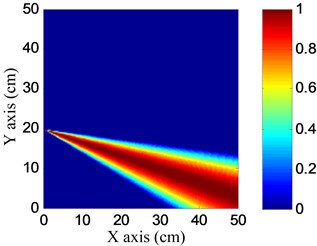
The angle searching range of the spatial filter is set to be [0°, 180°) and the angle resolution is 0.36°. The damage angle-time image of each linear PZT array can be obtained by spatial filtering the damage-scattering signals, as shown in Fig. 11. Based on Eq. (7), the damage probability-angle plot can be obtained, as shown in Fig. 12. By searching all the damage probabilities of the positions on the plate based on Eq. (8) and the damage probability-angle plot, the damage angle image of each linear PZT array can be obtained, as shown in Fig. 13. After that, the damage coordinate image can be obtained by fusing the damage angle images of the two linear PZT arrays, as shown in Fig. 14. Finally, the damage position (29.3, 9.5) cm can be calculated by using the coordinate probability weighted algorithm, and the damage localization error is 0.86 cm.
Fig. 11Damage angle-time images
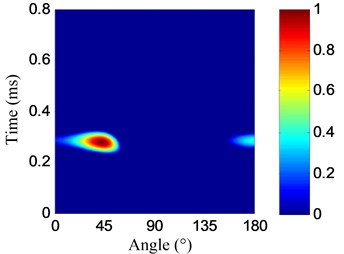
a) No. I PZT array
b) No. II PZT array
Fig. 12Damage probability-angle plots
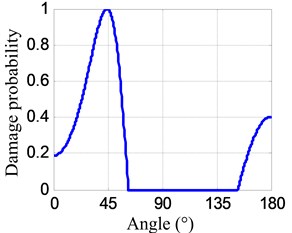
a) No. I PZT array
b) No. II PZT array
Fig. 13Damage angle images
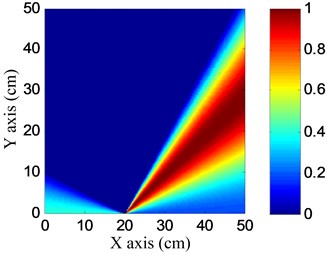
a) No. I PZT array
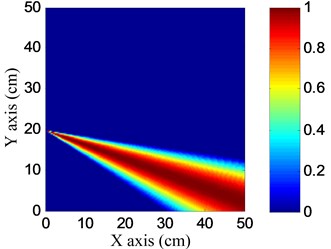
b) No. II PZT array
Fig. 14Damage coordinate image
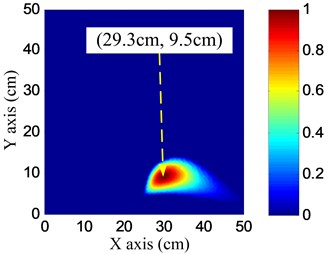
According to the damage imaging process of position B discussed above, the imaging and location results of the 8 damages, and the distance errors comparing with actual damage positions are listed in Table 3. It indicates that the maximum damage localization error is no more than 1 cm.
An impact hammer is used to introduce an impact of 2 J energy on the structure. 8 impacts are performed at the positions shown in Table 2 by using the impact hammer in turn. The trigger voltage is 1 Volts, the sampling rate is 1 MHz, and the sampling length is 5000 samples including 1000 pre-samples.
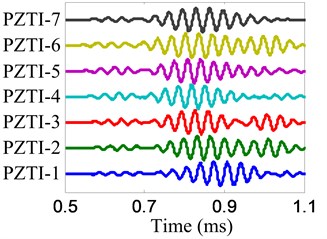
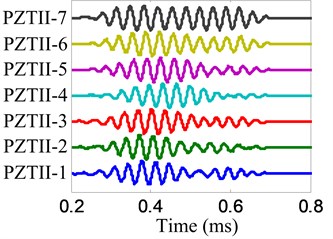
The impact imaging of position B is chosen to be an example to show the impact imaging method. The impact response signals of the two linear PZT arrays are shown in Fig. 15 and the frequency narrowband signals extracted from impact response signals by using the complex Shannon wavelet transform are shown in Fig. 16. The center frequency of these frequency narrow band signals is 30 kHz and the frequency band is 6 kHz.
Fig. 15Impact response signals
a) No. I PZT array
b) No. II PZT array
Fig. 16The extracted frequency narrowband signals
a) No. I PZT array
b) No. II PZT array
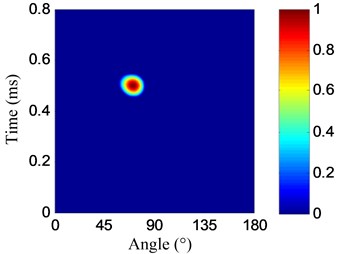
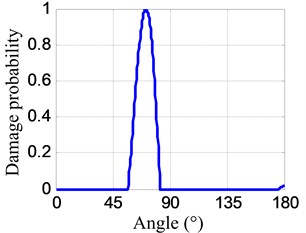
The parameters of the spatial filter are set to be the same with damage imaging. The impact angle-time image of each linear PZT array can be obtained by spatial filtering the frequency narrowband signals, as shown in Fig. 17. Then the impact probability-angle plot of each linear PZT array can be obtained by using Eq. (7), as shown in Fig. 18. By searching all the impact probabilities of the positions on the plate based on Eq. (8) and the impact probability-angle plot, the impact angle image of each linear PZT array can be obtained, as shown in Fig. 19. Then the impact coordinate image can be obtained by fusing the impact angle images of the two linear PZT arrays, as shown in Fig. 20. The impact position (29.1, 10.4) cm can be calculated by using the coordinate probability weighted algorithm, and the impact localization error is 0.98 cm.
Fig. 17Impact angle-time images
a) No. I PZT array
b) No. II PZT array
According to the impact imaging process of position B discussed above, the impact imaging and location results of the 8 impacts, and the distance errors comparing with the actual impact positions are listed in Table 3. It indicates that the maximum damage localization error is no more than 1 cm.
Fig. 18Impact probability-angle plots
a) No. I PZT array
b) No. II PZT array
Fig. 19Impact angle images
a) No. I PZT array
b) No. II PZT array
Fig. 20Impact coordinate image
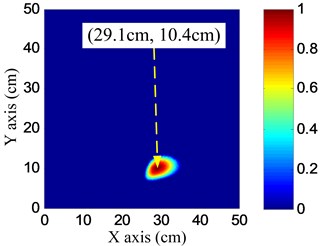
Table 3Damage and impact localization results without using Lamb wave group velocity
Position | Actual coordinates (cm) | Damage | Impact | ||
Location (cm) | Distance error (cm) | Location (cm) | Distance error (cm) | ||
A | (20, 10) | (19.7, 9.4) | 0.67 | (19.5, 10.7) | 0.86 |
B | (30, 10) | (29.3, 9.5) | 0.86 | (29.1, 10.4) | 0.98 |
C | (10, 20) | (10.8, 19.7) | 0.85 | (10.3, 19.7) | 0.42 |
D | (20, 20) | (19.6, 19.1) | 0.98 | (19.4, 19.3) | 0.92 |
E | (30, 20) | (29.5, 19.5) | 0.71 | (29.4, 19.3) | 0.92 |
F | (10, 30) | (10.7, 30.6) | 0.92 | (10.8, 30.5) | 0.94 |
G | (20, 30) | (19.7, 29.9) | 0.32 | (19.5, 29.4) | 0.78 |
H | (30, 30) | (29.3, 29.8) | 0.73 | (29.1, 29.9) | 0.90 |
5. Conclusions
This paper proposes a spatial filter and two linear PZT arrays based composite structure imaging method. Each PZT array can be used to estimate the angle of the acoustic source accurately based on the spatial filter. By fusing the angle estimation results of the two linear PZT arrays, the acoustic source can be localized accurately without using the Lamb wave group velocity. This method can be applied to damage and impact localization of composite structures easily and accurately. The validation results on a carbon fiber composite laminate plate show that the damage and impact localization errors are less than 1 cm. However, detailed research also needs to be performed on real aircraft composite structures in the future.
References
-
Boller C. Next generation structural health monitoring and its integration into aircraft design. International Journal of Systems Science, Vol. 31, Issue 11, 2000, p. 1333-1349.
-
Seydel R., Chang F. K. Impact identification of stiffened composite panels: II. Implementation studies. Smart Materials and Structures, Vol. 10, Issue 2, 2001, p. 370-379.
-
Staszewski W. J., Mahzan S., Traynor R. Health monitoring of aerospace composite structures – active and passive approach. Composites Science and Technology, Vol. 11, Issue 69, 2009, p. 1678-1685.
-
Boller C., Chang F. K., Fujino Y. Encyclopedia of Structural Health Monitoring. John Wiley and Sons, , 2009.
-
Qing X. P., Chan H. L., Beard S. J., Kumar A. An active diagnostic system for structural health monitoring of rocket engines. Journal of Intelligent Material Systems and Structures, Vol. 17, Issue 7, 2006, p. 619-628.
-
Su Z., Ye L., Lu Y. Guided Lamb waves for identification of damage in composite structures: A review. Journal of Sound and Vibration, Vol. 295, Issue 3, 2006, p. 753-780.
-
Qiu L., Yuan S., Huang T. Lamb wave temperature compensation method based on adaptive filter ADALINE network. Journal of Vibroengineering, Vol. 15, Issue 3, 2013, p. 1463-1476.
-
Hall J. S., Michaels J. E. Computational efficiency of ultrasonic guided wave imaging algorithms. IEEE Transactions on Ultrasonics, Ferroelectrics, and Frequency Control, Vol. 58, Issue 1, 2011, p. 244-248.
-
Qiu L., Liu M., Qing X. P., Yuan S. A quantitative multi-damage monitoring method for large-scale complex composite. Structural Health Monitoring, Vol. 12, 2013, p. 183-196.
-
Wang C. H., Rose T. J., Chang F. K. A synthetic time-reversal imaging method for structural health monitoring. Smart Materials and Structures, Vol. 13, Issue 2, 2004, p. 415-423.
-
Wang L., Yuan F. G. Damage identification in a composite plate using prestack reverse-time migration technique. Structural Health Monitoring, Vol. 4, Issue 3, 2005, p. 195-211.
-
Ciampa F., Meo M. Impact detection in anisotropic materials using a time reversal approach. Structural Health Monitoring, Vol. 11, Issue 1, 2012, p. 43-49.
-
Qiu L., Yuan S., Zhang X., Wang Y. A time reversal focusing based impact imaging method and its evaluation on complex composite structures. Smart Materials and Structures, Vol. 20, Issue 10, 2011, p. 105014.
-
Wang D., Ye L., Lu Y., Su Z. Probability of the presence of damage estimated from an active sensor network in a composite panel of multiple stiffeners. Composites Science and Technology, Vol. 69, Issue 13, 2009, p. 2054-2063.
-
Zhou C., Su Z., Cheng L. Probability-based diagnostic imaging using hybrid features extracted from ultrasonic Lamb wave signals. Smart Materials and Structures, Vol. 20, Issue 12, 2011, p. 125005.
-
Yu L., Giurgiutiu V. In situ 2-D piezoelectric wafer active sensors arrays for guided wave damage detection. Ultrasonics, Vol. 48, Issue 2, 2008, p. 117-134.
-
Holmes C., Drinkwater B. W., Wilcox P. D. Advanced post-processing for scanned ultrasonic arrays: Application to defect detection and classification in non-destructive evaluation. Ultrasonics, Vol. 48, Issue 6-7, 2008, p. 636-642.
-
Wang Z., Yuan S., Qiu L., Cai J., Bao Q. Ultrasonic phased array with dispersion compensation for monitoring multiple damages in structures. Journal of Vibroengineering, Vol. 16, Issue 8, 2014, p. 4102-4114.
-
Park J., Ha S., Chang F. K. Monitoring impact events using a system-identification method. AIAA Journal, Vol. 47, Issue 9, 2009, p. 2011-2021.
-
Zhong Y., Yuan S., Qiu L. Multiple damage detection on aircraft composite structures using near-field MUSIC algorithm. Sensors and Actuators A-Physical, Vol. 214, 2014, p. 234-244.
-
Ruzzene M. Frequency-wavenumber domain filtering for improved damage visualization. Smart Materials and Structures, Vol. 16, Issue 6, 2007, p. 2116-2129.
-
Michaels T. E., Michaels J. E., Ruzzene M. Frequency-wavenumber domain analysis of guided wavefields. Ultrasonics, Vol. 51, Issue 47, 2011, p. 452-466.
-
Rogge M. D., Leckey C. A. Characterization of impact damage in composite laminates using guided wavefield imaging and local wavenumber domain analysis. Ultrasonics, Vol. 53, Issue 7, 2013, p. 1217-1226.
-
Purekar A. S., Pines D. J., Sundararaman S., Adams D. E. Directional piezoelectric phased array filters for detecting damage in isotropic plates. Smart Materials and Structures, Vol. 13, Issue 4, 2004, p. 838.
-
Wang Y., Yuan S., Qiu L. Improved wavelet-based spatial filter of damage imaging method on composite structures. Chinese Journal of Aeronautics, Vol. 24, Issue 5, 2011, p. 665-672.
-
Katunin A. Damage assessment in composite structures using modal analysis and 2D undecimated fractional wavelet transform. Journal of Vibroengineering, Vol. 16, Issue 8, 2014, p.3939-3950.
-
Qiu L., Yuan S. On development of a multi-channel PZT array scanning system and its evaluating application on UAV wing box, Sensors and Actuators A, Vol. 151, Issue 2, 2009, p. 220-230.
-
Sohn H., Park H. W., Law K. H., Farrar C. R. Damage detection in composite plates by using an enhanced time reversal method. Journal of Aerospace Engineering, Vol. 20, Issue 3, 2007, p. 141-151.
About this article

This work is supported by the National Science Fund for Distinguished Young Scholars (Grant No. 51225502), the National Science Foundation of China (Grant No. 51205189), the China Postdoctoral Science Foundation (Grant No. 2012M510134), the Research Fund for the Doctoral Program of Higher Education of China (Grant No. 20123218120007), the Priority Academic Program Development of Jiangsu Higher Education Institutions and the Qing Lan Project.
