Abstract
In recent decay, composite materials have widely applied to important load-bearing structures of advanced aircrafts. On-line damage monitoring of composite structure is an important research topic in the field of Structural Health Monitoring (SHM). Among the existing SHM techniques for composite structures, Lamb wave and Piezoelectric Transducer (PZT) array based damage imaging methods have been widely studied because they have the advantages of high signal-to-noise ratio and high damage sensitivity, and they can be applied to large scale structure monitoring. In this paper, a new on-line damage imaging method of composite structure which is based on Lamb wave wavenumber response and PZT 2D cross-shaped array is proposed. In this method, the PZT 2D cross-shaped array constructed by two linear PZT arrays is placed on composite structure to acquire Lamb wave damage scattering signal in spatial domain on-line. For each linear PZT array, a wavenumber-time image of the damage scattering signal can be obtained by using spatial Fourier transform and a time scanning process. Based on the two wavenumber-time images, the wavenumbers of the damage scattering signal projecting at the two arrays can be obtained. By combining with the two projection wavenumbers, the damage can be localized without blind angle. The method validation performed on a carbon fiber composite laminate plate shows a good damage localization accuracy. This method is simple but efficiency and it can be applied to on-line damage monitoring of composite structure easily.
1. Introduction
Modern structures on advanced aircrafts make increasing use of large-scale composite structures due to their superior stiffness and weight characteristics, such as B787 and A350XWB, which are both composed of over 50 % composite materials [1]. However, the inner damage can reduce the strength and the stiffness of the structures, and even cause air crash [2, 3]. Therefore, to ensure the safety and reduce the maintenance cost, on-line damage monitoring of composite structures is a hot topic in the research field of Structural Health Monitoring (SHM) [4-5]. Among the existing SHM methods, much attention has been paid to piezoelectric transducer (PZT) and Lamb wave based on-line damage monitoring method because it is sensitive to small damage and it has a long detection range [6].
Damage imaging methodology has been widely studied in recent decade. It has utilized large number of actuator-sensor channels from a network of PZTs to map the structure being interrogated based on the measurement of damage reflections and damage induced features differences, producing a visual indication of damage location and size, which result in high signal-to-noise ratio, high damage sensitivity and large scale structure monitoring. The damage imaging methodology can be divided into two branches called sparse PZT array based method and dense PZT array based method respectively. For sparse PZT array, the most straightforward damage imaging method is the delay-and-sum imaging method [7-8] whose main idea is to enhance the real damage point by overlapping time domain damage scattering signals. Another typical sparse PZT array based damage imaging method is time reversal focusing method [9-11] which makes use of Lamb wave spatial reciprocity and time reversal invariance. The time reversal focusing process is realized by using measured or modeled frequency domain transfer functions or by phase synthesis of time domain signals directly. Damage path probability imaging method has also been studied [12]. Different from those sparse PZT array based damage imaging methods, dense PZT array based damage imaging method, such as ultrasonic phased array [13-14], has a unique feature of structural beam scanning based on phase modulation and synthesis of Lamb wave signals in time domain. It is able to enhance a desired signal component at a specific direction while eliminating other signal components from other directions. Multiple signal classification [15] is another kind of dense PZT array based damage imaging method.
In recent years, Lamb wave wavenumber processing technique for damage estimation has been gradually studied. Compared with the time domain and frequency domain analysis of Lamb wave signals, the wavenumber domain analysis is an effective approach to distinguish wave propagating direction and wave modes. Michaels [16] used a frequency-wavenumber filter to analyze the direction and various wave modes of damage scattering signal on an aluminum plate. Sohn [17] created a signal processing technique in frequency-wavenumber domain to isolate standing wave components on a composite plate for delamination and disband evaluation. Rogge [18] built the relationship between wavenumber and wave spatial location to estimate delamination size and depth of a composite laminate. Yu [19] presented short time-spatial-frequency-wavenumber analysis for obtaining a wavenumber spectrum at a selected frequency and time to decompose Lamb wave modes. In the above research, the accurate wavenumber response of Lamb wave signal was needed and measured by using a scanning Laser Doppler Vibrometer (LDV) of high spatial resolution. However, these methods researched so far still have their own limitations for on-line damage monitoring in practical application. For on-line damage monitoring, Purekar [20] and Qiu [21-22] studied a spatial filtering technique based damage imaging method.
In this paper, a new on-line damage imaging method of composite structure based on Lamb wave wavenumber response and dense PZT array is proposed. In the method, the dense PZT array is a PZT 2D cross-shaped array which is constructed by two linear PZT arrays. For each linear PZT array, the on-line spatial domain sampling of damage scattering signal is realized. Based on the spatial Fourier transform and combining with a time scanning process, a wavenumber-time image of damage scattering signal can be obtained. According to the two wavenumber-time images obtained by using the PZT 2D cross-shaped array, the wavenumbers of damage scattering signal projecting at the two arrays can be obtained and the damage can be localized without blind angle. Finally, the method function is validated on a carbon fiber composite laminate plate. Comparing with the other dense PZT array based damage imaging method, the proposed method is simple and high computational efficiency, and it can be applied to on-line damage monitoring of composite structure easily.
2. The new damage imaging method
2.1. Wavenumber response based on spatial Fourier transform
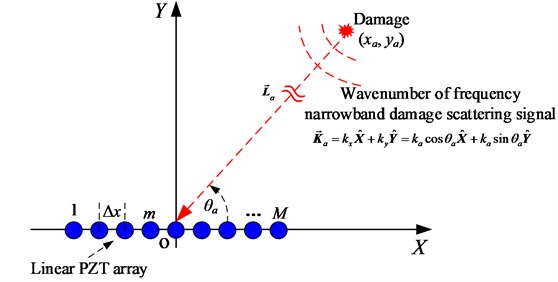
A linear PZT sensor array consists of PZT sensors is placed on a plate-like structure shown in Fig. 1. The PZT sensors are numbered as 1, 2,..., . A Cartesian coordinate is constructed on the structure. The center point of the linear PZT array is set to be the origin point of the Cartesian coordinate. The distance between the centers of each two adjacent PZT sensors is .
There is a damage on the structure. The position of the damage is unknown and supposed to be (, ). The direction and distance of the damage relative to the linear PZT array are supposed to be and respectively.
To obtain the damage scattering signal, a frequency narrowband excitation of central frequency is input to the PZT at the original point to excite frequency narrowband Lamb wave. Based on the studies [6, 13-14], the amplitude of Lamb wave mode is dominant at low excitation frequency. Thus, the damage scattering signal can be approximated to be single-mode when the frequency is low. Based on this point, the damage scattering signal acquired by the PZT located at (, 0) can be expressed as Eq. (1). The wavenumber of the damage scattering signal is denoted as . It is wavenumber narrowband and it can be considered as two components. The first is the wavenumber projecting at the array direction (-axis) and the second is the Y-axis projection wavenumber :
where is the normalized amplitude of the damage scattering signal. and represent the distance vector of and . . and 1,…, .
Fig. 1Schematic diagram of Lamb wave spatial sampling by a linear PZT array
Based on Fraunhofer approximation, Eq. (1) can be approximated to be Eq. (2), in which, denotes the unit direction vector of the . In far-field situation, the damage scattering signal can be regarded as a planar wave received by the linear PZT array [13, 14]. Thus, Eq. (2) can be approximated to be Eq. (3). The amplitude term of Eq. (3) is expressed as Eq. (4):
Eq. (3) gives out the damage scattering signal of time domain sampling by using one PZT sensor. The linear PZT array can be also seemed to be a spatial sampling device. The array response at time is the damage scattering signal of spatial sampling and it can be expressed as Eq. (5). The spatial sampling rate is .
By using spatial Fourier transform, the spatial response at time shown in Eq. (5) can be transformed to wavenumber response shown in Eq. (6), in which, is the Dirac function as shown in Eq. (7):
Eq. (6) and Eq. (7) show that if which is corresponding to the -axis projection wavenumber of the damage scattering signal, the wavenumber response obtained by using spatial Fourier transform will reach to the maximum value. Thus, the wavenumber of damage scattering signal projecting at the -axis can be easily obtained based on the spatial Fourier transform and the array spatial response.
However, only small amount of PZT sensors are allowed to be used in practical application especially in aviation field. Thus, the length of the linear PZT array is so limited as to the limited spatial sampling length of the damage scattering signal. It will lead to low wavenumber spatial resolution. But one thing should be noted that the goal of this method is to realize damage localization not to measure the accurate wavenumber. If the wavenumber which is corresponding to the maximum amplitude can be obtained correctly, this method still can be used. This goal can be realized if the length of the linear PZT array is long enough to acquire a full spatial cycle of the signal. In this paper, the method of padding zeros is adopted to increase the wavenumber resolution of spatial Fourier transform. Supposing that is the length of the linear PZT array and the wavenumber resolution is set beforehand, the length of the padded zeros can be calculated by Eq. (8), in which, is the length of the zeros which must be padded:
To validate the function of the wavenumber response calculation method based on spatial Fourier transform mentioned above. An experimental study is performed on an aluminum plate, as shown in Fig. 2. The experimental system is constructed by a 2024-T3 aluminum plate, a linear PZT array and a Lamb wave based SHM system [23]. The dimension of the 2024-T3 aircraft aluminum alloy specimen is 1200 mm×1200 mm×2 mm (length×width×thickness). The mechanical properties of the 2024-T3 aluminum plate are shown in Table 1.
Fig. 2Experimental setup
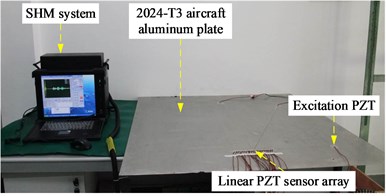
a) Experiment system
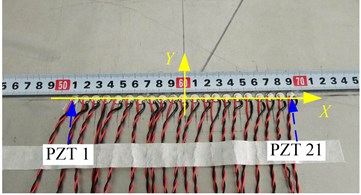
b) The linear PZT sensor array
Table 1Mechanical properties of the 2024-T3 aluminum
Parameter | Value |
Density (kg·m-3) | 2.78×10³ |
Elastic modulus (GPa) | 73.1 |
Shear modulus (GPa) | 28 |
Poisson ratio | 0.33 |
As shown in Fig. 2, the linear PZT array is constructed by 21 PZT-5A sensors. The diameter and thickness of the PZT-5A sensor is 8 mm and 0.48 mm respectively. The distance between the centers of each two adjacent PZT sensors is 0.09 m. The corresponding maximum cutoff wavenumber for the array is 349 rad/m. Another PZT sensor is used as a Lamb wave excitation. The direction and the distance of excitation PZT relative to the linear PZT sensor array are 0° and 400 mm respectively. The excitation signal is a five-cycle sine burst modulated by Hanning window [8] and the center frequency is 20 kHz. The frequency used in this experiment is low. Thus, mode is dominant in the guided wave response signal and the theoretic central wavenumber of the signal is 212.2 rad/m.
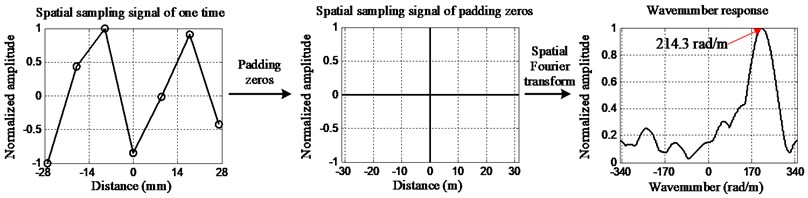
Fig. 3 gives out an example of the spatial Fourier transform of a spatial sampling signal on the aluminum plate by using only 7 PZT sensors (Number 5, 7, ,9, 11, 13, 15 and 17) in the linear PZT array. Thus, the length of the PZT array is 7, 0.09 m, and 0.1 rad/m. Based on Eq. (8), 6974 zeros are padded to the signal and 3487 zeros on each side. As it can be seen from Fig. 3 that the wavenumber which is corresponding to the maximum amplitude of the wavenumber response is very close to the theoretic wavenumber. The range of the wavenumber response is from – to . is the maximum cutoff wavenumber of the spatial sampling and . The length of the wavenumber response is .
Fig. 3An example of spatial Fourier transform based wavenumber response calculation
2.2. Damage imaging and localization
The damage scattering signal acquired by the linear PZT array can be considered a spatial sampling signal matrix which contains times spatial sampling. As shown in Fig. 4(a), the wavenumber response of damage scattering signal of one time spatial sampling at time can be obtained by the spatial Fourier transform based on the above method. This method can be also applied to the damage scattering signal of times spatial sampling from to . It is considered to a time scanning process based on the spatial Fourier transform. Based on the time scanning process, a matrix of wavenumber response from to can be obtained as shown in Eq. (9):
Fig. 4Demonstration of the time scanning process and damage imaging result
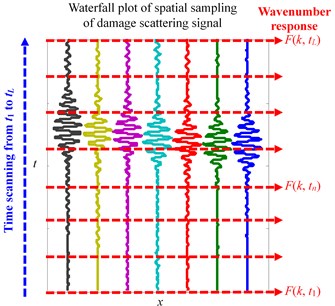
a) Demonstration of damage imaging process
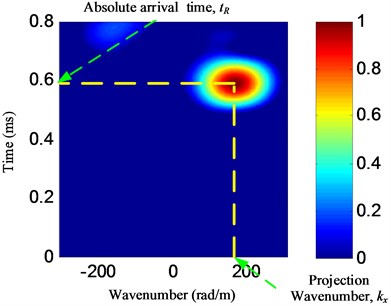
b) Example of damage imaging result
Based on Eq. (9), a wavenumber-time image shown in Fig. 4(b) can be obtained by imaging the matrix . According to the wavenumber-time image, the wavenumber corresponding to the point of the highest pixel value can be estimated to be the -axis projection wavenumber and the corresponding time can be estimated to be the absolute arrival time of the damage scattering signal. But it should be noted that the absolute arrival time is not the actual time-of-flight of damage scattering signal.
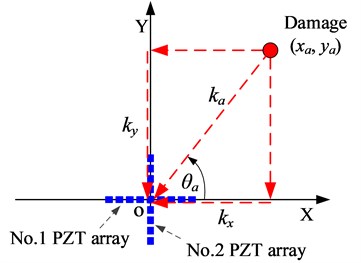
As it can be seen from the above imaging method, the axis projection wavenumber and the absolute arrival time of the damage scattering signal can be obtained by using a linear PZT array. Thus, a PZT 2D cross-shaped array which is constructed by two linear PZT arrays (No. 1 PZT array and No. 2 PZT array) is used to localize the damage as shown in Fig. 5. A Cartesian coordinate is constructed on the PZT 2D cross-shaped array. The Lamb wave of wavenumber narrow band is excited at the origin point at time . When the Lamb wave passes through the damage, the damage scattering signal is generated and it can be acquired by the PZT 2D cross-shaped array. Based on the imaging method, the axis projection wavenumber and the absolute arrival time (, ) and the (, ) of the No. 1 PZT array and the No. 2 PZT array can be obtained respectively.
For damage direction estimation as shown in Fig. 5(a), based on the two projection wavenumbers and , the direction of the damage direction relative to the center point of the array can be calculated by Eq. (10). It shows that can be calculated from 0° to 360° without blind angle. Generally speaking, the wavenumber of the damage scattering signal depends on the position of the damage. It means that the wavenumbers of damage scattering signals introduced by two damages at different positions may have the same coordinate-axis projection wavenumber, even if the two damages are at different directions relative to the PZT 2D cross-shaped array. But this problem can be overcome by using the ratio between the -axis projection wavenumber and -axis projection wave number, as shown in Eq. (10):
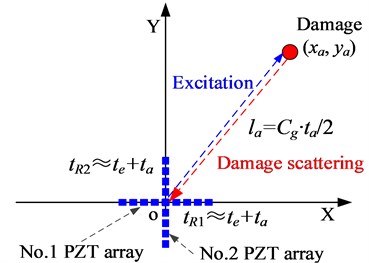
For damage distance estimation as shown in Fig. 5(b), the arrival time obtained from the damage imaging result contains two parts. The first part is the Lamb wave excitation time which can be determined by the excitation signal. The second part is the actual time-of-flight including the time of Lamb wave signal propagating from the excitation position to the damage position and the time of the damage scattering signal propagating from the damage position to the PZT 2D cross-shaped array. The damage distance relative to the center point of the PZT 2D cross-shaped array can be calculated by Eq. (11) combing with Lamb wave group velocity :
Finally, the damage localization result can be obtained by using Eq. (12):
Fig. 5Damage localization based on PZT 2D cross-shaped array
a) Damage direction estimation
b) Damage distance estimation
3. Validation on a carbon fiber composite laminate plate
3.1. Validation setup
The validation system shown in Fig. 6 is constructed by a carbon fiber composite laminate plate, a PZT 2D cross-shaped array and the Lamb wave based SHM system. The dimension of the composite plate is 600 mm×600 mm×2.25 mm (length×width×thickness). The composite plate is stacked by 18 single layers and the ply sequences is [45/0/–45/90/0/-45/0/–45/0]s. The material property of each layer is shown in Table 2. Each linear PZT array of the PZT 2D cross-shaped array is constructed by 7 PZTs as shown in Fig. 6(b) and (c). The distance between the centers of each two adjacent PZTs is 10 mm. The maximum cutoff wavenumber of the linear PZT array is 314 rad/m. The PZTs in No.1 PZT array are labeled as PZT 1-1, …, PZT 1-7 and the PZTs in No. 2 PZT array are labeled as PZT2-1, …, PZT 2-7. A PZT used as an actuator for Lamb wave excitation is placed at the center point of the array on the opposite side of the plate.
Table 2Material parameters of single layer of the carbon fiber composite laminate plate
Parameter | Value |
0° tensile modulus / GPa | 135 |
90° tensile modulus / GPa | 8.8 |
±45° in-plane shearing modulus / GPa | 4.47 |
Poisson ratio | 0.328 |
Density / (kg·m-3) | 1.61×10³ |
Table 3The position of the simulated damages
Damage | Cartesian coordinates (mm, mm) | Polar coordinates (°, mm) |
A | (100, 300) | (71.57, 316.2) |
B | (100, 200) | (63.43, 223.6) |
C | (0, 200) | (90.00, 200.0) |
D | (-100, 200) | (116.57, 223.6) |
E | (-200, 200) | (135.00, 282.8) |
F | (-200, 100) | (153.43, 223.6) |
G | (-200, 0) | (180.00, 200) |
Another 3 reference PZTs shown in Fig. 6(c) are labeled as Ref 1, Ref 2 and Ref 3. They are used to measure Lamb wave group velocity. The method of applying damage on the structure is bonding a mass block shown in Fig. 6(a) on damage position to change the local stiffness of the structure at the bonding area. 7 damages labeled A to G are applied on the structure by bonding a mass block one-by-one respectively as shown in Fig. 6(c). The position of these damages is shown in Table 3. The SHM system is adopted to excite and acquire Lamb wave signals. The excitation signal is a five-cycle sine burst modulated by Hanning window. The center frequency of the excitation signal is 35 kHz and the amplitude is ±70 volts. The sampling rate is 10 MS/s and the sampling length is 8000 samples including 1000 pre-samples.
Fig. 6The validation system of the damage imaging method on the composite plate
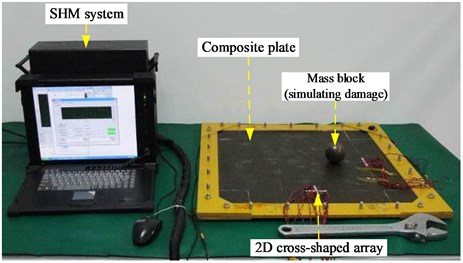
a) Experiment system
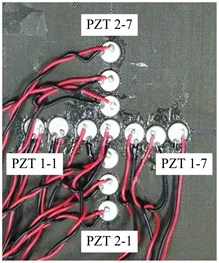
b) The PZT 2D cross-shaped array
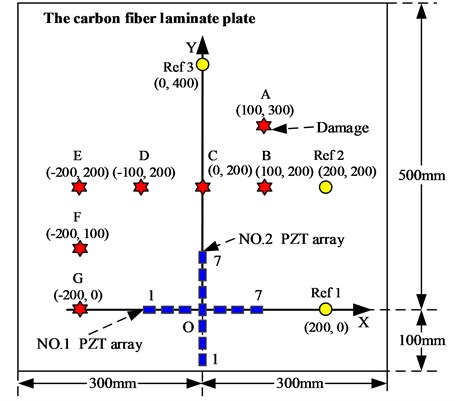
c) The PZT 2D cross-shaped array placement and damage position
3.2. Validation results
The validation process is 1) In the health state of the structure, the Lamb wave signals of the PZT 2D cross-shaped array are acquired as the health reference signals, . 2) Damage is applied at each position shown in Table 2 and the corresponding Lamb wave signals of the PZT 2D cross-shaped array are acquired as the on-line monitoring signals, .
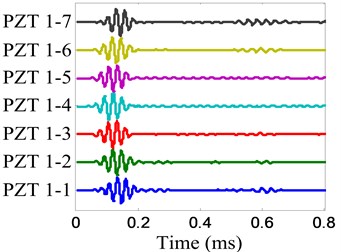
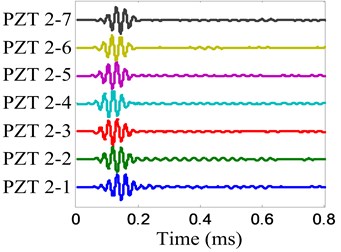
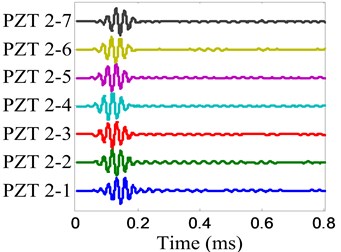
To show the damage imaging and localization process, the damage is selected to be an example. The and of the PZT 2D cross-shaped array are shown in Fig. 7 and Fig. 8 respectively. The damage scattering signal is extracted by subtracting from and it is shown in Fig. 9. For damage imaging based on the damage scattering signal. The wavenumber resolution of spatial Fourier transform is set to be 1 rad/m. Fig. 10 gives out the damage imaging results of the PZT 2D cross-shaped array.
For damage direction estimation, the wavenumbers –203 rad/m and 192 rad/m can be obtained from the two wavenumber-time images. According to Eq. (10), the damage direction 136.6° is obtained.
Fig. 7Health reference signal of damage E
a) No. 1 array
b) No. 2 array
Fig. 8On-line damage monitoring signal of damage E
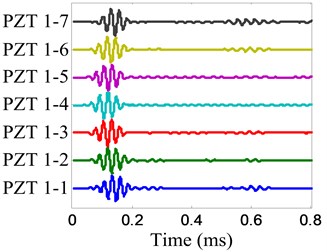
a) No. 1 array
b) No. 2 array
Fig. 9Damage scattering signal of damage E
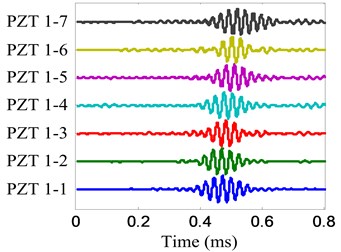
a) No. 1 array
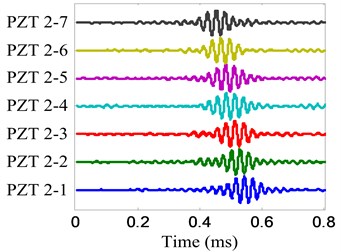
b) No. 2 array
For damage distance estimation, the group velocity of the signal propagating on the structure should be measured beforehand. The group velocity measuring method based on continuous complex wavelet transform [8] is used to achieve this goal. The group velocity measuring results by using the 3 reference PZTs are 1485.20 m/s, 1439.87 m/s and 1352.27 m/s respectively. The average group velocity 1425.8 m/s is used to damage distance estimation. From Fig. 10, the absolute arrival time of the damage scattering signal 0.4957 ms and tR2=0.4993 ms can be obtained. But the absolute arrival time is not the actual time-of-flight of the damage scattering signal. By using the continuous complex wavelet transform [8], the envelope of the excitation signal can be obtained as shown in Fig. 11. The time corresponding to the envelope maximum value of is regarded to be the excitation time, 0.1059 ms. Thus, based on Eq. (11), the time-of-flight is obtained to be 0.3916 ms and the damage distance is 279.2 mm. According to Eq. (12), the damage position is obtained to be (–202.8 mm, 191.8 mm) and the damage localization error is 8.6 mm based on Eq. (13):
where, is damage localization result and is the actual position of damage.
Fig. 10Wavenumber-time images of damage E
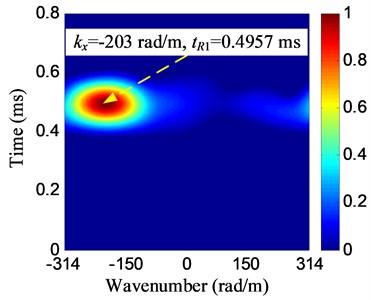
a) No. 1 array
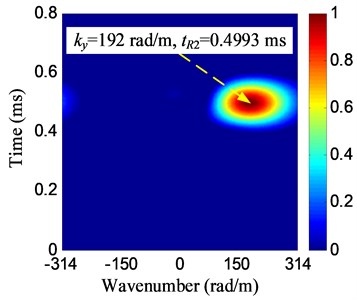
b) No. 2 array
The whole abovementioned damage imaging and localization process for one damage can be finished in less than 5 seconds on a common laptop computer by using MATLAB 2009a.
According to the damage imaging and location process of the damage discussed above, the damage localization results and the localization errors of the 7 damages are listed in Table 4. It indicates that the damage localization results are in good agreement with the actual damage positions, and the maximum damage localization error is less than 1 cm.
Fig. 11The envelope of the excitation signal
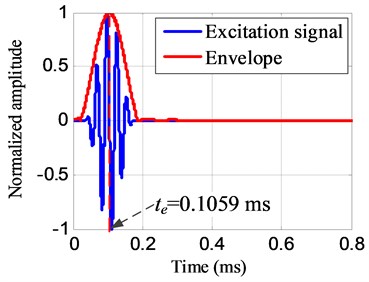
Table 4Damage localization results of the composite plate
Damage label | (, ) (rad/m, ms) | (, ) (rad/m, ms) | Localized position (°, mm) | Actual position (°, mm) | Direction and distance error (°, mm) | (mm) |
A | (92, 0.5415) | (251, 0.5479) | (69.9, 313.7) | (71.6, 316.2) | (–1.7, –2.5) | 9.7 |
B | (128, 0.4274) | (237, 0.4240) | (61.6, 228.0) | (63.4, 223.6) | (–1.8, 4.4) | 8.4 |
C | (4, 0.3785) | (264, 0.3758) | (89.1, 193.4) | (90.0, 200.0) | (–0.9, –6.6) | 7.3 |
D | (–132, 0.4121) | (247, 0.4189) | (118.1, 220.7) | (116.6, 223.6) | (1.6, –2.9) | 6.7 |
E | (–203, 0.4957) | (192, 0.4993) | (136.6, 279.2) | (135.0, 282.8) | (1.6, –3.6) | 8.6 |
F | (–253, 0.4330) | (119, 0.4272) | (154.8, 232.0) | (153.4, 223.6) | (1.4, 8.4) | 10.0 |
G | (–284, 0.3943) | (5, 0.3974) | (179.0, 207.6) | (180.0, 200.0) | (–1.0, 7.6) | 8.4 |
4. Conclusion
This paper proposes a new on-line damage imaging method based on Lamb wave wavenumber response and PZT 2D cross-shaped array. The method function has been validated on a composite structure. The main contributions of this method are summarized as follows.
1) It does not rely on any Lamb wave propagation model of composite structure and it is high efficiency. Thus it can be applied to on-line damage monitoring of aircraft composite structures easily.
2) By using the PZT 2D cross-shaped array, the damage can be localized without blind angle.
However, the method has two main limitations which need to be further studied.
1) The group velocity is needed to achieve damage distance estimation. For complex composite structures, the isotropic feature will increase the damage localization error.
2) The method is based on the far-field situation at the current stage.
In addition, more validations should be performed on complex composite structures.
References
-
Staszewski W. J., Mahzan S., Traynor R. Health monitoring of aerospace composite structures – active and passive approach. Composite Science and Technology, Vol. 69, Issue 11, 2009, p. 1678-1685.
-
Seydel R., Chang F. K. Impact identification of stiffened composite panels: 2. Implementation studies. Smart Materials and Structures, Vol. 10, Issue 2, 2001, p. 370-379.
-
Boller C., Buderath M. Fatigue in aerostructures-where structural health monitoring can contribute to a complex subject. Philosophical Transactions of the Royal Society of London A: Mathematical, Physical and Engineering Sciences, Vol. 365, Issue 1851, 2007, p. 561-587.
-
Staszewski W. J., Boller C., Tomlinson G. R. Health Monitoring of Aerospace Structures: Smart Sensor Technologies and Signal Processing. John Wiley and Sons, Hoboken, New York, 2004.
-
Boller C., Chang F. K., Fujino Y. Encyclopedia of Structural Health Monitoring. John Wiley and Sons, Hoboken, New York, 2009.
-
Su Z., Ye L. Identification of Damage Using Lamb Waves: from Fundamentals to Applications. Springer, Berlin, 2009.
-
Hall J. S., Michaels J. E. Computational efficiency of ultrasonic guided wave imaging algorithms. IEEE Transactions on Ultrasonics, Ferroelectrics, and Frequency Control, Vol. 58, Issue 1, 2011, p. 244-248.
-
Qiu L., Liu M., Qing X., Yuan S. A quantitative multidamage monitoring method for large-scale complex composite. Structural Health Monitoring, Vol. 12, 2013, p. 183-196.
-
Wang C. H., Rose J. T., Chang F. K. A synthetic time-reversal imaging method for structural health monitoring. Smart Materials and Structures. Vol. 13, Issue 2, 2004, p. 415-423.
-
Cai J., Shi L., Yuan S., Shao Z. High spatial resolution imaging for structural health monitoring based on virtual time reversal. Smart Materials and Structures. Vol. 20, Issue 5, 2011, p. 055018.
-
Zhu R., Huang G. L., Yuan F. G. Fast damage imaging using the time-reversal technique in the frequency-wavenumber domain. Smart Materials and Structures. Vol. 22, Issue 7, 2013, p. 075028.
-
Zhou C., Su Z., Cheng L. Quantitative evaluation of orientation-specific damage using elastic waves and probability-based diagnostic imaging. Mechanical Systems and Signal Processing, Vol. 25, Issue 6, 2011, p. 2135-2156.
-
Yu L., Giurgiutiu V. In situ 2-D piezoelectric wafer active sensors arrays for guided wave damage detection. Ultrasonics, Vol. 48, Issue 2, 2008, p. 117-134.
-
Holmes C., Drinkwater B. W., Wilcox P. D. Advanced post-processing for scanned ultrasonic arrays: Application to defect detection and classification in non-destructive evaluation. Ultrasonics, Vol. 48, Issue 6, 2008, p. 636-642.
-
Zhong Y., Yuan S., Qiu L. Multiple damage detection on aircraft composite structures using near-field MUSIC algorithm. Sensors and Actuator A: Physical, Vol. 214, 2014, p. 234-244.
-
Michaels T. E., Michaels J. E., Ruzzene M. Frequency-wavenumber domain analysis of guided wavefields. Ultrasonics, Vol. 51, 2011, p. 452-466.
-
Sohn H., Dutta D., Yang J. Y., DeSimio M., Olson S., Swenson E. Automated detection of delamination and disbond from wavefield images obtained using a scanning laser vibrometer. Smart Materials and Structures, Vol. 20, 2011, p. 045017.
-
Rogge M. D., Leckey C. A. Characterization of impact damage in composite laminates using guided wavefield imaging and local wavenumber domain analysis. Ultrasonics, Vol. 53, 2013, p. 1217-1226.
-
Yu L., Leckey C. A., Tian Z. Study on crack scattering in aluminum plates with lamb wave frequency-wavenumber analysis. Smart Materials and Structures, Vol. 22, 2013, p. 065019.
-
Purekar A. S., Pines D. J., Sundararaman S., Adams D. E. Directional piezoelectric phased array filters for detecting damage in isotropic plates. Smart Materials and Structures, Vol. 13, 2004.
-
Qiu L., Yuan S., Liu B. A spatial filter and two linear PZTs arrays based composite structure imaging method. Journal of Vibroengineering, Vol. 17, Issue 3, 2015, p. 1218-1231.
-
Wang Y., Yuan S., Qiu L. Improved wavelet-based spatial filter of damage imaging method on composite structures. Chinese Journal of Aeronautics, Vol. 24, Issue 5, 2011, p. 665-672.
-
Qiu L., Yuan S. On development of a multi-channel PZT array scanning system and its evaluating application on UAV wing box. Sensors and Actuators A, Vol. 151, Issue 2, 2009, p. 220-230.
About this article

This work is supported by the National Science Fund for Distinguished Young Scholars (Grant No. 51225502), the Natural Science Foundation of China (Grant Nos. 51205189 and 51575263), State Key Laboratory of Mechanics and Control of Mechanical Structures (Nanjing University of Aeronautics and Astronautics) (Grant Nos. MCMS-0513K01 and 0515Y01), the Priority Academic Program Development of Jiangsu Higher Education Institutions and Hong Kong Scholars Program.
