Abstract
Dispersive propagation and overlapping wave modes are two main obstacles for guided Lamb wave SHM applications. In an effort to overcome such obstacles, a new signal-processing technique taking advantage order tracking based on dispersion relation, is developed. In this approach, by referencing the wave number-frequency function of specified mode, the operations of resampling and interpolating are performed on the frequency-spectral series of raw signal. The orders referenced to wave number-frequency are calculated, according to which the individual wave-packet is identified and its corresponding propagating distance is estimated. In the order domain, the overlapping modes are readily separated by Gabor expansion on the frequency-spectral series of raw signal. Numerical and FEM simulations on strongly dispersive and multimode overlapping guided waves were carried out to evaluate the performance of the proposed approach. The results demonstrated that the proposed approach is effective in dispersion analysis, mode differentiation and overlapped wave-packets separation.
1. Introduction
Guided ultrasonic wave, with stress distributed through the thickness of the material, can propagate along the thin and large components of one-dimensional structures with little loss in energy. It offers the potential to achieve the required permanent structural integrity monitoring [1, 2]. It is difficult to control the excitation and reception of selected guided wave modes. The main challenge for processing Lamb wave signals is how to identify and separate multimode overlapping wave-packets due to their different dispersion characteristics and different propagation velocities [3, 4]. A variety of pragmatic signal processing approaches have been developed and contributed to ascertainment of multimode overlapping wave-packets. These conventional techniques mostly focused on the improvement of time-frequency or time resolution and the suppression of dispersion. In the conventional methods, narrow-bandwidth and single-modal guided waves with the selected central frequency were generally used as the excitation and ignored the dispersion effect.
The time-frequency representation (TRF) were adopted to separate the damage-reflected and boundary-reflected wave-packets and identify their individual wave mode, such as short-time Fourier transform (STFT) [5], wavelet transform [6, 7], S transform [8] etc. However, because of the continuously evolving shape (increased duration and reduced amplitude) and modes overlapping in both the frequency and time domains, many of TFR techniques, limited by their time-frequency resolution, either lose effectiveness or lack sufficient accuracy. In order to produce a much more distinct time-frequency resolution, the spectrogram reassignments [9, 10] were introduced to enhance readability of TF representations for multimode dispersive Lamb wave signals. But the reassignment methods lack the noise robustness and their resolutions may be degraded with the increase of wave-packet number.
To improve the time resolution of general Lamb wave signals, a number of deconvolution techniques were applied including Wiener pulse shaping filter, two-sided Wiener filter, weighted least squares filter, Mendel’s minimum variance deconvolution algorithm, Oldenburg’s frequency domain deconvolution algorithm and L1-norm deconvolution [11, 12]. Since the deconvolution methods were very sensitive to noises, they generally could be inapplicable if strong noise were present in the sensor signal. Furthermore, even with high time resolution, the method of pinpointing wave-packet arrival time maybe loses its effectiveness. That is because Lamb waves are inherently dispersive, i.e., different frequency components propagate at different speeds in a wave-packet, which cause wave-packets to spread out in space and time when they propagate through a structure so as to make the concept of arrival time ill-defined in time domain. To obtain well-defined onset-time of echoes, Chirplets based dispersion curve were employed to extract the onset-time of that single mode from multimode dispersive wave signal [13, 14]. However, in the case of coherent interferences (false reflection) in the waveform, the Chirplet method may produce misleading results. To eliminate interference of false reflections, Ajay et al. [15] adopted an algorithm based on correlation analysis and matching pursuit method to estimate onset-time of echoes. But this method still has a deficiency in that the wave propagation model and baseline signal must be known.
In an effort to overcome the difficulty of wave-packet identification caused by strong dispersion, researchers developed some signal-processing techniques to compensate for the dispersive nature of Lamb waves in long-range inspections. The time reversal technique and its improved methods [16-19] are used to achieve temporal recompression of Lamb waves under broadband signal excitation. Warped frequency transform [20] upwarps the dispersive signal, and then wraps TF points of the STFT of the signal to obtain a dispersion-matched warpogram. The frequency domain polynomial Chirplet transform [21] adopts a rotation operator and as shift operator to do dispersion compensation.
Although the methods above are useful to identify the overlapping wave-packets by taking dispersion nature into account, they don’t provide the algorithms to extract the individual mode wave-packet for consequent damage evaluation. Whatever is taken to improve the resolution of diagnostic waves and whatever is taken to suppress dispersion effect, to separate completely overlapping multimode wave-packets is always restricted to a certain extent. For this reason, a new approach is developed to process strong dispersive and overlapping multimode wave-packets. In this proposed method, by taking the wave number-frequency function of different mode as referencing phase, the corresponding mode wave can be identified and reconstructed with Gabor expansion. This article is organized as follows. In Section 2, the mathematical model of Lamb wave propagation is presented. Section 3 explains the basic theorem of order tracking technique in Lamb wave analysis. The detailed algorithm for order tracking technique is shown in Section 4. The proposed method’s applications in processing multimode overlapping signal and analysing dispersion signal are described in Section 5 and Section 6, separately. Section 7 outlines the possibilities to apply the presented method to the SHM application and describes briefly ongoing studies and the path for future studies.
2. Mathematical model for Lamb wave propagation
Because of the dispersion phenomenon in Lamb wave propagation, when Lamb waves travel across the structural features like boundaries, stringers, etc., reflections from these features produce phase shifts with respect to the original excitation signal. To take into account the dispersion effect of elastic waves, the dispersion physics of single mode wave propagation in 1D dispersive media can be modelled by Fourier analysis. When the incident wave is to be generated by a transducer and propagates along a waveguide over the distance , the arrival time of each frequency component will delay , where is the phase velocity. After propagating over distance, the Fourier transform of (noted as ) will be shifted in the phase by . The Fourier transform of received wave-packet which can be phase-shifted wave, is given by:
where denotes a wave number-frequency function or dispersion relation function. The coefficient is nearly independent to after the wave propagates along or is reflected by either damages or boundaries. In practical applications, there inevitably exists a multi-mode wave in the received signal, since the current methods such as double side excitation only can be used to strengthen one mode as well as weaken the other mode, but to eliminate completely one mode is impossible. Therefore, the resulting sensor signal in frequency domain can be written as a superposition of multiple mode wave-packets from multiple propagation paths, i.e.:
where is the total number of propagating wave paths. and are the propagation distance and the transmission coefficient of th wave path, respectively. is the wave number-frequency function of mode .
Although the dispersion relation is an obstacle in Lamb wave applications, it can also serve as a useful tool to discriminate one mode from the other modes. in Eq. (2) is presented as the linear superposition of components whose phases are the multiples of the wave number-frequency function .This relation between and is very useful to identify ()-related wave-packets and to track their propagating distances . If ‘order’ is defined as normalized by , more accurate interpretation of received signal can be obtained by converting into so-called order spectrum. It is obvious that there is one-to-one relationship between the ‘order’ and the individual mode wave-packet. The order spectrum provides more conveniences for separate multimode overlapping wave-packets.
3. Principle of order analysis for Lamb wave
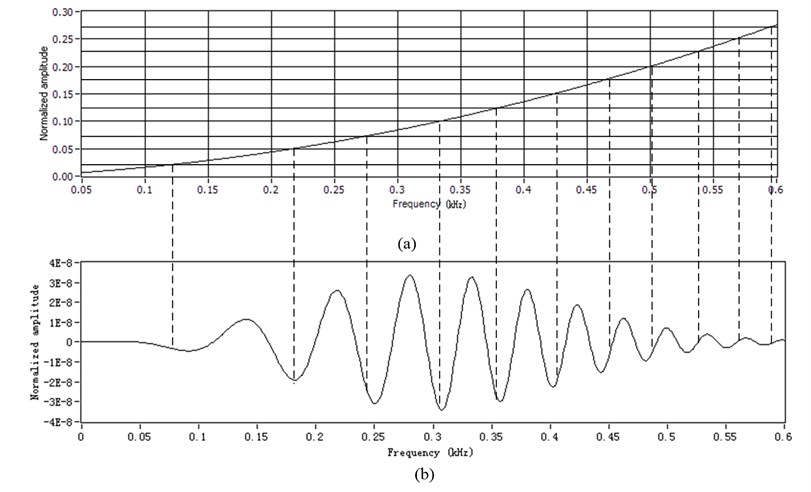
As what is mentioned above, if the order spectrum of some specific mode can be obtained, the wave-packets in the specific mode can be identified. It will improve the efficiency of propagating distance estimation, and simplify the computation process of pinpointing damage position. According to Eq. (1), the frequency domain signal can be regarded as a frequency-varying or phase-shifting waveform. The dispersion characteristic of sensor received signal depends on the dispersion curve function . If is a linear function of , is the Fourier transform of non-dispersed wave. If is a quadratic or higher order function of , represents the Fourier transform of dispersed wave. In order to describe the relationship between and , the dispersion signal sampled constant in frequency discrete signal is converted into the equiangular signal sampled constant in angle from. From the mathematical point of view, this task could be solved by resampling and interpolation theory, which is explained in the example given in Fig. 1. The excited signal is assumed to be Gaussian modulated wave-packet presented as:
where 60 kHz, 2×10⁵. Assuming that the wave number-frequency function is and that the dispersion wave after propagating along x distance presents as (1, , 2 and is Fourier transform of ). The assumed dispersion curve and the dispersive wave are shown in Fig. 1.
Because the phase shift of has strict linear relationship with , which provides the feasibility of calculating resamplings for Taking as the reference phase i.e., referencing to the equal interval ordinate value in Fig. 1(a), the assumed dispersed signal in Fig. 1(b) is resampled at constant increments of the phase angle. The dispersed signal is transformed from sequence , which is at constant frequency increments in frequency domain into sequence , which is at constant angle increments ( in angle-domain. And then, the equiangular signal is interpolated. The interpolated signal is presented as the stationary wave in Fig. 2(a). The order spectrum (shown in Fig. 2(b)) is obtained by the FFT on the stationary wave. The order spectrum in Fig. 2(b) has a single frequency component at 2-order, which is independent of the wave number-frequency function . Since order analysis relates to the reference wave number-frequency function , the order is defined as the phase normalized by . As long as the order is obtained, the dispersion wave-packet is identified and its propagating distance is determined.
Fig. 1Scheme of resampling: a) the resamplings determined from the assumed dispersion curve function kf, b) the assumed dispersion wave in frequency domain Sf sampled using constant increments of angle
For multimode Lamb wave, there are multiple modes propagating simultaneously in the structure, and each is independent with distinctly different dispersion characteristic presented as different wave number-frequency function. It can clearly be seen that the order spectrum only displays the orders related to the reference , the wave modes that have different dispersion properties will be excluded. Namely, for the multimode dispersion signal, just taking the number-frequency function of specified mode as the reference phase, the specified mode wave-packet can be identified in the obtained order spectrum and its propagating distance can be estimated without its flight time. The wave-packets related to other modes would appear as uncorrelated noise. That is, the order tracking technique can be used to identify the mode of Lamb wave.
4. Algorithm of order tracking for Lamb wave
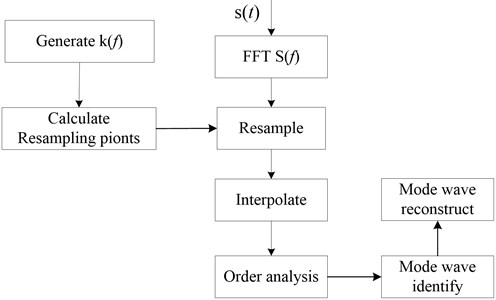
On the basis of the theorem aforementioned, the order tracking algorithm for Lamb wave analysis is proposed and can be summarized as the flowchart in Fig. 3.
Fig. 2The order analysis for the simulated signal: a) the equalized angle simulated reflection signal in frequency domain, b) order spectrum of reflection signal

a)

b)
Fig. 3Flowchart of order tracking algorithm for Lamb wave
4.1. Determination of resampling points
It has been clarified that the phase of has the linear relationship with the wave number-frequency function . In this case, the order tracking technique is converted to process by taking (Generally, is a constant not equal to 1 so as to avoid too high orders.) as the referenced phase. Although the precise can be approximated by high-order polynomials, generally cubic polynomial can describe dominant dispersion phenomena fair enough. In this case, the referenced phase presents as:
where , , , are the cubic function fitting parameters for , 1, 2,… is the index of resampling series, and ( is the max order range). According to Eq. (4), the equiangular sampling frequencies can be determined from . Because the referenced phase can be known from in advance, it is possible to calculate the corresponding frequencies for each constant angular increment, , and to solve Eq. (4) for given as well. Setting, and , then Eq. (4) becomes:
where , . The resolution for is:
where , .
If , the Eq. (5) has only one solution i.e. .
If , the Eq. (5) has three same solutions i.e. .
If , the Eq. (5) has three different solutions, i.e.
, 0, 1, 2, where , , . The effective solution in is the first solution whose value is bigger than the last sampling time. So, the resampling frequency corresponding to the given equiangular increment can be determined as.
4.2. Interpolation and determination of propagation distance
Once the resampling frequencies for equiangular increment are determined, the corresponding frequency amplitudes can be calculated by interpolating . The accuracy of the interpolation method determines the accuracy of the resampling amplitude. There are diverse interpolation methods that can be used, such as linear and cubic spline interpolations. In this paper, cubic spline interpolation is selected, which is to use a cubic curve to fit the four points (two raw frequency points before and two frequency points after the interpolation point). The formulation of the interpolation polynomial is given:
Firstly, to calculate the coefficients which are used to determine the interpolated at any given , four sets of data points (i.e. pairs of and ) are substituted into Eq. (7) to generate four independent equations. These equations are solved to get the coefficients , which are then used to determine (the signal amplitude) at any given (the resample frequency). Once the amplitude at the any frequency is estimated, the equiangular interval signal would be obtained. Finally, Fourier transform is performed on the resampled to get its order spectrum. According to the order tracking theorem in Section 2, the “order” in the order spectrum of is defined as its phase normalized by the referenced phase . The same order is defined as the multiple of , i.e. the propagating distance . By taking the wave number function of specified mode as the reference phase, the order spectrum corresponding to the specified mode is obtained. The propagating distance of individual wave-packet is one-to-one corresponding to the order in the obtained order spectrum. According to the propagating distances, the individual wave-packet from different propagating path can be identified.
4.3. Extraction of order component
It has been mentioned that the order spectrum only displays the orders related to the reference wave number function and that the wave mode having different dispersion properties would be excluded. Moreover, the wave-packets in the reference mode can be identified one by one in the order spectrum and their propagating distances can be estimated according to the one-to-one relationship between the wave-packet propagation distance and its corresponding order. In some applications, however, engineers do need some wave-packet waveform of particular order to quantify the damage degree. Although short-term Fourier transform characterizes each individual transient and non-stationary harmonic (or order) in its spectrogram distribution, it is invalid to reconstruct target order/spectral components embedded in the analyzed signal. The Gabor order tracking technique is proposed with extremely good selectivity on the extracted wave-packet. The process to recover the wave-packet of specified order can be done with the Gabor transform and its inverse-the Gabor expansion. The Gabor expansion coefficients of are evaluated through the Gabor transform. The Gabor expansion of can be expressed as:
where , , , , denote the Gabor expansion coefficient and is the shift and modulated form of the Gabor elementary function. denotes the time sampling number, denotes the frequency sampling number or frequency bins. Gabor expansion coefficients, are expressed be using the Gabor transform, i.e.:
where is the corresponding dual function of . The Gabor expansion coefficients associated with the Gabor transform are flexibly applied to reconstruct the order components of interest. The computation employs masking strategies. The order components of interest that are covered by designated masks can is singled out and reconstructed from the multi-component reflection. The Gabor spectrogram of is generated by mapping the Gabor coefficient array into a 2D image of Gabor spectrogram distribution. The Gabor spectrogram can characterize the energy-intensive components of in certain frequencies that are relevant to the referenced . A mask operation is performed on the initial Gabor coefficient array using the referenced and its related order. Then, a mask array is generated with limited binary values, preserving when 1 and removing when . In this case, we can achieve a frequency domain wave-packet whose Gabor coefficients are exactly inside area defined by the mask function . The Gabor coefficients are corrected by , and then a modified Gabor coefficient array is generated, shown as:
The frequency domain wave-packet corresponding to the order component of interest is reconstructed from the modified coefficient array :
5. Application in processing multimode overlapping wave
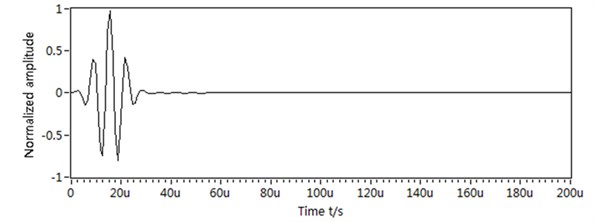
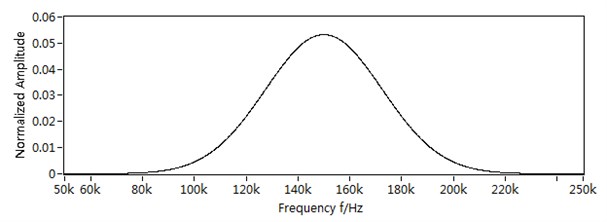
In this section, the performance of the proposed approach in processing multimode overlapping wave is investigated with a numerical simulation. The software Disperse (Non-destructive Testing Laboratory, Dept. of Mechanical Engineering, Imperial College, London, UK) [22] is used to generated the wave number-frequency function for Lamb waves in a 1-mm thick aluminium plate and these are shown in Fig. 4. The Gaussian modulated wave-packet in Eq. (3) with centre frequency 150 kHz, time width parameter 2×10⁵ is assumed to be the incident wave, which is shown in Fig. 5(a). Its frequency spectrum is shown in Fig. 5(b), where its bandwidth range extends about = [80 kHz, 220 kHz].
Fig. 4The dispersion curve of wave number-frequency

Fig. 5The incident signal: a) the incident signal in time domain, b) the incident signal in frequency domain
a)
b)
According to the dispersion curve in Fig. 3, there exist two modes of the fundamental symmetric and anti-symmetric modes (S0 and A0) in frequency band [80 kHz, 220 kHz]. The group velocity of A0 at centre frequency 150 kHz is 2.069 m/ms, and that of S0 is 2.701 m/ms. The frequency range of received wave can be changed because of its dispersion nature. So, the cubic polynomials are used to fit the dispersion curves of A0 and S0 mode in [50 kHz, 250 kHz]. The number wave functions calculated are as follows:
where is the wave number-frequency function of mode A0, and is that of mode S0. The wave number functions of both S0 and A0 modes can be estimated with theoretical calculation combined with experiment verification in practical application. Based on Eq. (12), an artificial signal is generated by Eq. (13) with the propagating distance of A0 mode wave-packet 300 mm, that of S0 mode wave-packet 400 mm. And the reflection coefficients are set as “1”. The numerical overlapped and multi-mode signal can be described by this model:
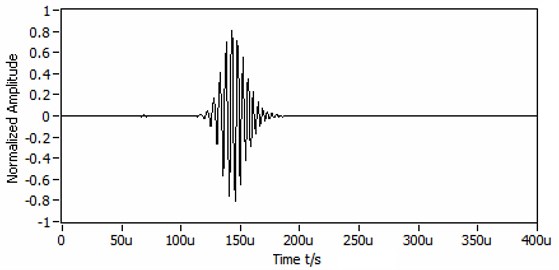
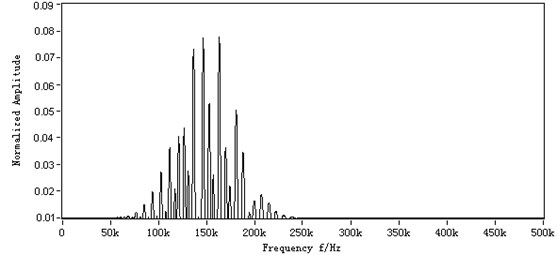
The sampling frequency and sampling period for the synthetic signal is 1 MHz and 400 us respectively. The simulation result is shown in Fig. 6(a). The two wave packets are not resolvable in the original time trace. The frequency spectrum of is shown in Fig. 6(b), where too many supernumerary frequencies make the identification of mode wave more difficult in frequency domain. Because of the dispersion and multi-mode overlapping, the shape of frequency spectrum has been changed greatly, compared with that of incident signal in Fig. 5(b). It is almost impossible to identify which one is mode A0/S0 wave-packet, because they are completely overlapping in time and frequency domain. Without prior knowledge, it’s more impossible to calculate the propagation distance of each wave packet due to multiple and interference of overlapping time arrivals.
Fig. 6The numerical simulated signal: a) the numerical simulated signal, b) the frequency spectrum of numerical simulated signal
a)
b)
The order tracking method is performed on the signal in Fig. 6(b) to identify and separate the overlapped multi-mode wave packets according to the steps in Fig. 3. In order to identify the A0 mode wave-packet, the wave number function is evaluated to be a referenced phase. The role of multiplying factor 20 is to make the order of A0 mode not too high. Considering the length of analysed signal, the maximum propagating distance of A0 mode is about 827.6 mm. The maximum order of A0 mode is about 42. Its corresponding resampling interval is 0.1496. It should be noted that at a smaller interval , the more accurate amplitude of resampled wave occurs, and a more accurate order spectrum is obtained, however, that a smaller resampling interval requires more computer resources for storing a larger quantity of raw data. After resampling and interpolation, the order power spectrum obtained is shown in Fig. 7, where there is a clear peak in the order spectrum at 15th order.
Fig. 7Order spectrum of the numerical simulated signal
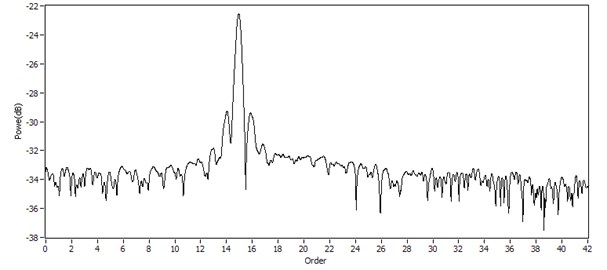
The 15th order in Fig. 7 means that the frequency domain phase of A0 mode wave is 15 times of . Thus, the propagation distance of A0 mode wave is 20×15 mm, which completely equals the A0 mode propagation distance pre-set in the simulation. In the same way, if the wave number function of S0 mode is taken as the referenced phase, its propagation distance can be estimated from its corresponding order spectrum. Therefore, the individual mode can be identified since at one time the order spectrum only displays one kind of mode wave correlated to the selected wave number function.
It is noteworthy that the stronger the dispersion is, the more it can show the superiority of the proposed approach. As we all know, most conventional methods identify the wave-packets according to their arrival times, so the more severe dispersion phenomenon always bring more negative effects for the identification. However, the proposed approach just takes advantage of the dispersion nature to calculate the propagation distance, which would result in higher accurateness in structure damage location than the conventional methods. In the real-situation, when the theoretical wave number-frequency function is more closely matched to its real value, the performance of the proposed approach becomes more superior, as the wave number-frequency function is more representative of the phase change trend derived from dispersive signal.
Another significant advantage of the proposed method is to extract specified wave packet for further quantitative damage assessment. For the damage detection in SHM, the amplitude or shape of wave-packet reflected by damage has the close relation to damage severity. Such as for the delamination of composite structure, the energy of reflected wave-packet is as a function of the normalized length of the delaminated. If the wave packet reflected by damage can be extracted completely, it is much beneficial to quantitatively evaluate damage. Fig. 8 depicts the result of the Gabor expansion-based order tracking, where computed Gabor expansion coefficients of 15th order is characterised in the Gabor spectrogram. The colour in the Gabor spectrogram indicated the magnitude of the Gabor coefficients.
Fig. 8Gabor coefficient spectrogram of the numerical simulated signal
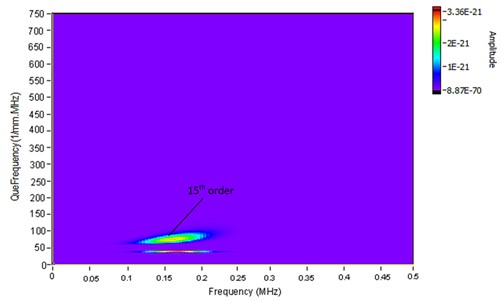
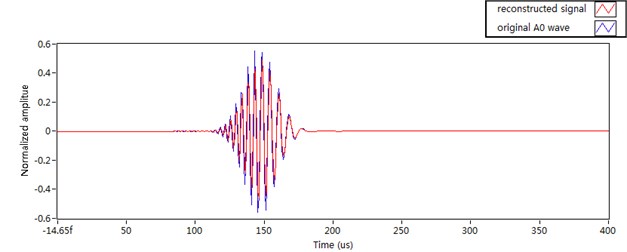
The order component in Fig. 8 represents the reflection related to the reference phase , i.e. the mode A0 wave packet. We limit to binary values (either one or zero) which behaves as a mask, preserving when 1 and removing when 0. The inverse Gabor transform is performed using only Gabor coefficients which are exactly inside area defined by the mask function . While the modified Gabor coefficients are obtained, the Gabor expansion equation is applied to reconstruct the waveforms of 15th order. The convolution result of the reconstructed order component and incident signal yields the time history of A0 mode wave-packet. Fig. 9 shows that the reconstructed signal superimposed with the original A0 mode wave packet.
The match between the reconstructed and original wave packet is very good except the amplitude attenuation and the tail of the wave packet. To quantify this similarity, a quantity called damage index (DI) is defined and calculated as:
where and denote the reconstructed A0 mode wave and the original A0 mode packet. This method compares the amplitude of two sets of data. The calculated similarity is 85.78 %, which denotes the strong similarity of the two wave-packets. It is noteworthy that longer propagation distance will improve the resolution in Gabor spectrogram and provide better mode wave-packet separation, because the difference between the dispersion characteristics of two modes gets more apparent. The reconstructed wave-packet is much closer to the original wave packet, especially if propagation distance is large enough.
Fig. 9Comparison between the reconstructed wave and the original A0 mode wave
6. Application in processing strong dispersive signal
Because the proposed method is based on the dispersion nature of Lamb wave, the incident signal would not be constrained on the narrowband frequency to avoid dispersion effects. In order to verify the proposed algorithm’s potential capabilities in processing strong dispersive signal, the FEM experiment is conducted with an aluminium beam measuring L2000×W20×TH1 mm. The Lamb wave is generated at left beam end and collected at the distance 50 mm away from the exciting position. The damage measuring L2×W8×TH1 mm is introduced at distance 800 mm away from the left end. The beam is finely meshed using eight-note 3D brick elements with eight layers of elements in the beam thickness. The dynamic simulation is conducted using ABAQUES/EXPLICIT. The propagation paths of the Lamb wave are schematically depicted in Fig. 10.
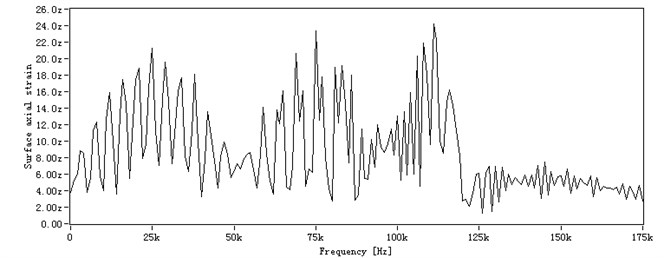
To demonstrate this advantage, in the FEM simulation a broadband frequency signal is chosen as the incident signal, which is a Gaussian pulse function in Eq. (3) with attenuation coefficient 2×10⁵ at central frequency of 60 kHz. The group velocity of S0 at centre frequency 60 kHz is 5.437 m/ms. The Lamb wave signal captured is shown in Fig. 11(a), where the serious dispersion corrupts the signal and the reflections are smeared together. It is difficult to identify how many reflected wave-packets in the time waveform, not to mention to identify which mode each wave-packet belongs to. The frequency transform spectrum of received signal is shown in Fig. 11(b), from which it is clear the frequency domain signal is frequency-varying non-stationary signal. Since the time waveform of received signal is known, its frequency spectrum covers the frequency range [0-175 kHz].
Fig. 10Schematic illustration of propagation paths of Lamb waves in the damaged beam

Fig. 11The received signal: a) the received signal in time domain, b) the received signal in frequency domain

a)
b)
Therefore, the dispersion curve in Fig. 3 between the range [0-175 kHz] is chosen as the reference phase. Two modes S0 and A0 mode should be considered in this frequency range. But the A0 mode usually presents higher attenuation during propagation because of the dominant out-of-plane movement of particles in the mode shape, which leaks partial energy to surrounding medium. Furthermore, A0 mode provides weaker reflections from the damage and boundary and insensitivity to damage in the structural thickness. Therefore, in this FEM simulation only the S0 mode needs to be considered. Performing the proposed method on the received signal, the reference phase (250 mm is used to avoid the high order, is wave number –frequency function of S0 mode in range [0-175 kHz]). The frequency domain signal is resampled and interpolated, and then its order spectrum obtained is shown in Fig. 12.
Fig. 12 provides three order peaks fairly separated and identifiable. The orders in Fig. 12 are identified as 0.206th, 0.6193th, 15.77th orders corresponding to the propagating distance 250×0.206 = 51.5 mm, 1548 mm, 3942.5 mm. Considering the geometry of the beam, the reflections sequentially are direct arrived wave-packet, the reflection from damage and that from the right end. It is obvious that the propagation distances estimated agree well with the theoretic values. Therefore, even in the case of strong dispersion the damage position can be identified precisely.
Fig. 12The order spectrum of received signal
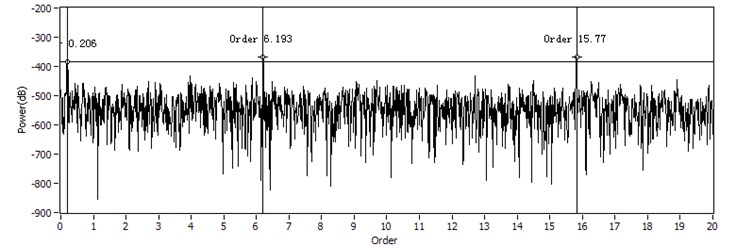
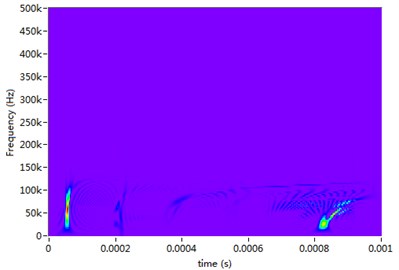
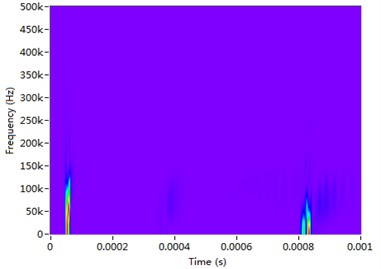
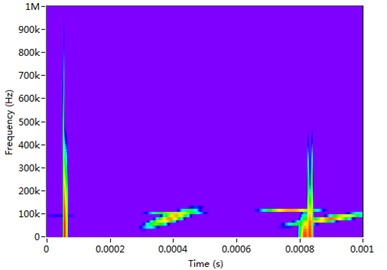
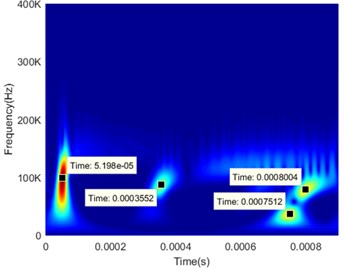
Fig. 13TRFs of received signal: a) STFT, b) WVD, c) Chirplet decomposition, d) S transform
a)
b)
c)
d)
In order to verify the effectiveness of the proposed method, Fig. 13 provides the TFRs of the received signal. From the STFT and WVD spectrogram (Fig. 13(a) and (b)), it is difficult to identify the reflected wavepackets from the boundary and the damage owing to the limited time-frequency resolution and the cross-terms. Because of the strong dispersion of guided wave, the wavepackes are overlapped together and cannot been separated from each other. In Fig. 13(c), the over decomposition of Chirplet transform causes the serious distortion of wavepackets. In the S transform of Fig. 13(d), it is easy to recognize the wavepackets, but the time centers of wavepackets deviate away from the actual propagation time. In Table 1, the estimated distances with the proposed method are tabulated and compared with those obtained with other conventional methods. It is verified that the propagating distances estimated with the proposed method agree with the theoretical values. But the estimated values with the conventional methods completely cannot present the practical propagation distances.
Table 1Comparisons of estimated distances between the proposed method and conventional ones
Method | Directed wavepacket (mm) | Damage wavepacket (mm) | Boundary wavepacket (mm) |
Theoretical distance | 50 | 1550 | 3950 |
Amplitude Enevlope | 54.5 | 1844.3 | 4281.2 |
S transform | 282.6 | 1944.9 | 4338.8 |
Chirplet decomposition | 326.2 | 2120.5 | 4512.8 |
Proposed method | 51.5 | 1548 | 3942.5 |
If mode conversion happens in the reflection, the frequency domain phase would be in an intricate shape and its shift related to dispersion curve would need to be recalculated according to the distance propagating as A0 mode and the distance propagating as S0. It is assumed that the mode S0 wave is converted into A0 mode after propagating over distance when it interacts with damage, and then it continues to propagate over distance . Consequently, the resulting wave-packet reflected by damage can be regarded as a time-varying product of shape-shifted waveform, i.e.:
where and represent the transmission and reflection coefficient respectively under the same assumption that the amplitude change of wave propagation is of insignificant. From Eq. (15), it can be seen that both S0 and A0 mode dispersion function are not suitable to be the reference phase as the linear relationship between the shift phase of and any of wave-number function dose not exist. In this case, it seems that the proposed method lost its effectiveness. One solution is to use some priori knowledge about propagating distances or . Supposing is the linear function of , which is expressed as , the referenced phase:
According to Eq. (17), it is clear that the propagation can be calculated by taking as reference phase with the proposed method.
It should be noted that the noises in the order spectrum (shown in Fig. 12) is caused by the operation of resampling and interpolation. In practical application, there are some factors that influence the effectiveness of the proposed method including the dispersion strength and the accurateness of dispersion curve, the resampling rate and interpolation algorithm, as well as the mode conversion in propagation and the frequency band of incident signal. The calculation of wave number-frequency function is a key point for the application of the proposed algorithm, because the reference phase must be derived from it. In the practical application, the wave number-frequency function obtained by the theoretical calculation can be different to that of actual structure tested. Therefore, the wave number function from theoretical calculation generally needs to be corrected by experimental measurements.
7. Conclusions
The dispersive and multimode nature of Lamb wave causes some difficulties in the interpretation of signals produced by damage structures. When a Lamb wave interacts with two closely-spaced discontinuities, the echo signal will be useless for processing. To resolve this problem, a specific signal processing scheme is proposed based on order tracking related to dispersion curve. In the proposed scheme, the unavoidable dispersion characteristic of Lamb waves was employed, but not evaded. The numerical and FEM simulation results demonstrate that the proposed method works with several merits for damage identification in SHM are summarized: (1) Dispersion presents no real obstacle to the high resolution of damage pinpointing in structures. The technique can provide better propagating distance of incident wave, without time of arrival and mode velocity. (2) Constraints on the choice of frequency range, where the dispersion effects are small, are relaxed. Using different frequency ranges may enhance the damage of various types. (3) The reflection wave packet from damage can be extracted for further analysis of damage degree.
One the other hand, it needs to be noted that the proposed scheme is limited by some drawbacks in practical applications. For instance, the performance strongly relies on the preciseness of dispersion curve and dispersion strength. But for the narrow-band incident signal, the phenomenon in its propagation is not very strong, even its dispersion is weak enough to be neglected. And its detection accurateness is influenced by resampling frequency and interpolation. In the ongoing studies, the proposed algorithm is being validated experimentally. Future work will be carried out with the aim of overcoming its drawbacks mentioned above. The refinement of the technique will bring much beneficial for precise location of damage and quantitative describe of damage severity.
References
-
Miller C. A., Hinders M. K. Classification of flaw severity using pattern recognition for guided wave-based structural health monitoring. Ultrasonics, Vol. 54, 2014, p. 247-258.
-
Veidt M., Liew C. Non-destructive evaluation(NDE) of aerospace composites: structural health monitoring of aerospace structures using guided wave ultrasonics. Non-Destructive Evaluation (NDE) of Polymer Matrix Composites, Vol. 43, 2013, p. 449-479.
-
Liu Xiaofeng, Bo Lin, Luo Hongling Compensation method of propagating distance for guided wave. IET Science, Measurement and Technology Vol. 9, Issue 2, 15, p. 9-15.
-
Liu Xiaofeng, Veidt M., Bo Lin Order analysis for measurement of Lamb wave propagation distance. Measurement Science and Technology, Vol. 24, 2013, p. 211-226.
-
Zhang H., Wu S., Ta D., Xu K., Wang W. Coded excitation of ultrasonic guided waves in long bone fracture assessment. Ultrasonics, Vol. 54, 2014, p. 1203-1209.
-
Farhidzadeh A., Salamone S. Reference-freecorrosion damage diagnosis in steel strands using guided ultrasonic waves. Ultrasonics, Vol. 57, 2015, p. 198-208.
-
Mijarez R., Baltazar A., Rodríguez-Rodríguez J., Ramírez Niño J. Damage detection in ACSR cables based on ultrasonic guided waves. Dyna, Vol. 81, 2014, p. 226-233.
-
Assous S., Elkington P. Modified S transform for time-frequency analysis of bore hole flexural waves dispersion. Journal of the Acoustical Society of America, Vol. 131, 2012, p. 3349.
-
Latif R., Laaboubi M., Aassif E., Maze G. Dispersion analysis of acoustic circumferential waves using time-frequency representations. Vibration and Structural Acoustics Analysis, Springer, Heidelberg, 2011, p. 183-205.
-
Quaegebeur N., Masson P., Micheau P., Mrad N. Broadband generation of ultrasonic guided waves using piezo ceramics and sub-band decomposition. IEEE Transactions on Ultrasonics, Ferroelectrics and Frequency Control Vol. 59, 2012, p. 928-938.
-
Olofsson T. Deconvolution and model-based restoration of clipped ultrasonic signal. IEEE Transactions on Instrumentation and Measurement, Vol. 54, 2005, p. 1235-1240.
-
Sin Sam-Kit, Chen Chi-Hay A comparison of deconvolution techniques for the ultrasonic non-destructive evaluation of materials. IEEE Transactions on Image Processing, Vol. 1, 1992, p. 3-10.
-
Kuttig H., Niethammer M., Hurlebaus S., Jacobs L. J. Model-based analysis of dispersion curves using chirplets. Journal of the Acoustical Society of America, Vol. 119, 2006, p. 2122-2130.
-
Zhao M., Zeng L., Lin J., Wu W. Mode identification and extraction of broad band ultrasonic guided waves. Measurement Science and Technology, Vol. 25, 2014, p. 115005.
-
Raghavan Ajay, Cesnik Carlos E. S. Guided-wave signal processing using chirplet matching pursuits and mode correlation for structural health monitoring. Smart Materials and Structures Vol. 16, 2007, p. 355-366.
-
Cai J., Shi L., Qing X. P. A time-distance domain transform method for Lamb wave dispersion compensation considering signal waveform correction. Smart Materials and Structures, Vol. 22, 2013, p. 1310-5024.
-
Liu L., Yuan F. G. A linear mapping technique for dispersion removal of Lamb waves. Structural Health Monitoring, Vol. 9, 2010, p. 75-86.
-
Agrahari Jitendra Kumar, Kapuria Santosh A refined Lamb wave time-reversal method with enhanced sensitivity for damage detection in isotropic plates. Journal of Intelligent Material Systems and Structures, Vol. 27, 2016, p. 1283-1305.
-
Chan Eugene, Rose Francis L. R., Wang Chun H. A comparison and extensions of algorithms for quantitative imaging of laminar damage in plates. II. Non-monopole scattering and noise tolerance. Wave Motion, Vol. 66, 2016, p. 220-237.
-
Demarchi L., Marzani A., Caporale S., Speciale N. Ultrasonic guided-waves characterization with warped frequency transforms. IEEE Transactions on Ultrasonics, Ferroelectrics, and Frequency Control, Vol. 56, 2009, p. 2232-2240.
-
Yang Y., Peng Z., Zhang W., Meng G. Frequency-varying group delay estimation using frequency domain polynomial chirplet transform. Mechanical Systems and Signal Processing, Vol. 46, 2014, p. 146-162.
-
Pavlakovic B., Lowe M. J. S. Disperse Software Manual Version 2.0.16B. Imperial College London, UK, 2003.
About this article
This work is supported by the National Natural Science Foundation Project (No. 51475052 and No. 51675064), the China Postdoctoral Science Foundation (No. 2015M582519 and No. 2016790833) and the Fundamental Research Funds for the Central Universities (No. 106112016CDJZR115502).
