Abstract
Ultrasonic guided waves detecting technology has promising application prospects in structural health monitoring. In order to detect defects in the aluminum sheet, a kind of defect localization imaging algorithm, combining multi-parameter compensation and pixel partitioning optimization is proposed in this paper. Based on the analysis of imaging principles, the waveform signal of time domain was mapped onto the wavenumber domain through a backward propagation compensation, so dispersion parameters can be compensated. Reference signal compensation can be achieved by the baseline signal differential method from wavenumber domain, which overcame influences of environmental changes. During the imaging process, a reasonable threshold was used for pixel partitioning and optimization to improve image quality. Experimental results demonstrated that positioning error about the algorithm is small, defects imaging of sheet is clear and intuitive, this optimization and compensation of guided-wave defects imaging can be used in structural health monitoring.
1. Introduction
Engineering materials in aerospace and civil-engineering will inevitably be damaged during its long being used duo to factors such as impact of external forces, fatigue corrosion, aging, poor working conditions and so on. Therefore, structural health monitoring (SHM) is becoming an important subject of the engineering and academic researches.
Lamb waves belong to a kind of elastic waves, and elastic waves in extended solids are either longitudinal or transverse, characterized by compressional or shear vibrations respectively. Boundaries cause mode coupling and intermixing of these waves to the extent that it's often no longer useful to try to distinguish them. Plate-like structures have two boundaries and the intermixed propagating compressional and shear vibrations are Lamb waves. Lamb waves could make high-efficient scanning to thin plate and easy to accomplish large-scaled detection of plate structures. Moreover, Lamb waves detect technology has the characteristics of low attenuation, fast detection and high efficiency, which make it the most promising technology of non-destructive health testing [1, 2].
During their propagation, Lamb waves will be reflected or scattered when encountering defects, or boundaries. These also are intermixed with other mode signals and boundary reflecting signals. Therefore, the mechanism of Lamb wave propagation is very complicated, which make it difficult to identify damages and determine its location.
At present, guided wave signals are acquired by a sensor array after dynamic excitation signals are excited by drivers of this array. Signal processing methods for acquiring signals from the sensor array can be used to ascertain the position of damages in the material, and then, damage condition could be observed intuitively based on the Lamb waves imaging technique.
Many scholars have studied the imaging technique based on guided waves detection. Ling Yu et al. presented a generic phased arrays algorithm, in which direction dependent guided wave parameters and the energy skew effect are considered. Therefore, detection images of the composite plate with multiple surface defects at various directions are obtained [3]. Ambroziński et al. proposed a method based on frequency-dependent structure transfer function and employed a kind of virtual arrays implemented by means of scanning laser vibrometer for sensing the Lamb waves in multiple points corresponding to the locations of the 2D array elements [4]. Shang Chen Fu, Zhen Jian et al. have proposed a new imaging method based on warped frequency transform (WFT) to suppress dispersion influences [5]. J. Hua, J. Lin et al. used local signal correlation coefficient to replace signal amplitude as the input damage feature and the imaging performance is improved subsequently [6]. S. Fu, L. Shi et al. have studied a prewarping technology combined with step pulse excitation and this method have been used in Lamb wave imaging of plate structures with adjacent damages [7]. Based on the relationship between the frequency wavenumber of guided waves field and the energy, Z. Tian achieved notch imaging to the strip coat of composite materials [8]. Homma, N. Hu et al. adopted a hybrid reconstruction method based on denoising pursuit and orthogonal matching pursuit to reconstructing the damage image [9]. J. Hettler improved the traditional imaging algorithm by replacing the complete reference signal with the guided-wave signal which was acquired by using different excitation amplitude levels [10].
In this paper, based on principles of defect location imaging, the influences of dispersion on the imaging quality were analyzed, moreover, dispersion compensation was achieved by backward propagation compensation and reference compensation was achieved by a kind of baseline signal differential method in wavenumber domain on condition that sensors and actuators were fixed. The composite signals of different directions were acquired according to the sensor array. The imaging quality was improved by pixel segmenting and optimizing in the case of ensuring that the desired direction signals kept unchanged. Experimental results have demonstrated that the proposed imaging algorithm has high locating accuracy and good imaging quality. This algorithm is feasible in practical engineering fields.
2. Principles of guided-wave detecting and defect imaging
Several same PZT piezoelectric actuators/sensors are distributed on a piece of isotropous metal plate (the round region in Fig. 1). These PZT can be used as actuators loading excitation signals or as sensors acquiring guided-wave signals. The irregular region in Fig. 1 is structural damage or defect. Any PZT could be chosen to load a series of excitation signals, so it can activate Lamb waves on the metal plate surface [11]. These Lamb waves spread around the center of actuator and reflected waves will be generated if there have damages in the propagation process. Propagation direction, phase and amplitude of reflected waves are related to defect shape and size to a certain extent. Each sensor could receive the reflected signals containing the defect information, and then the characteristic signals of the defect could be highlighted by using some signal processing algorithms. The defect conditions could be estimated based on the relationship among reflected waves, time and speed.
Fig. 1Guided wave signal propagation
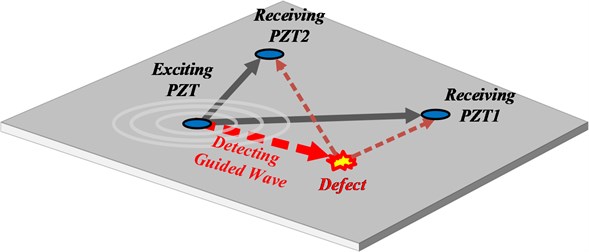
The red dotted line in Fig. 1 describes the defect reflecting wave’s propagation route. It is the process that the elastic wave produced by actuators arrives at sensors after being reflected by the damage. But many challenging problems complicate this process, because of the existence of multiple wave modes, dispersion, mode conversion, superposition of scattered waves from structural boundaries or irregularities (e.g., joints, stiffeners and openings), broadband noise and other features.
Before the imaging process, it is necessary to extract the health signals – baseline signals, in advance. Next, this baseline signals are compared with captured signals to highlight the characteristic signals of the defects. The acquisition of the baseline signals needs to carry on the multi sampling to each signal channel and then can be used as the baseline signals only after being averaged [12].
Suppose that the signals captured via an actuator-sensor path before and after the presence of damage in a structure are and . Then, the damage scattered wave is:
Suppose the sensor array is composed of N piezoelectric elements, Lamb wave group velocity is , and the central coordinate of the defect region is (, ). Then, the travel time for the diagnosis waves from the th actuator (, ) to the th sensor (, ) through the damage region is:
where: , , .
Each pixel value in coordinate points can be set according to the envelope curve and the positional relation between actuators and sensors:
where is the weight coefficient which reflects the positional relationship between the pixel point (, ) and the thactuator and the th sensor. is the window function. Eq. (3) could be rewritten into the simple integral form by the following Eq. (4):
Since signal processing of guided wave is mainly implemented through vector operation, Eq. (4) could be rewritten as:
where is Hilbert transform. is weight vector which reflects the positional relationship between the pixel point (, ) and path of the th actuator to the th receiving sensor. is the envelope correlated with the propagation distance, it can be established as Eq. (6):
In a guided wave detection system, due to the limited sensor numbers and existence of interferences, the pixel values at undamaged positions must be small to reduce interferences of imaging pixel points. reflects the position correlation degree between the pixel points and sending-receiving sensors. It reflects the pixel weight value and its resolution declines when the detection distance increases [13]. When the signals in the desired direction keep constant, the pixel value of the corresponding point should be the minimum. could be described as Eq. (7):
where is the product of the distance () from the excitation signals at the th pathway to the current point and the distance () from the current point to the receiving sensor.
Although guided wave imaging can show the damage intuitively, many factors such as the dispersion, the baseline signals, the transfer function of the guided wave transmission system and so on, will affect the final image quality. So, it is necessary to compensate for the above parameters.
3. Backward propagation compensation to guided wave dispersion
Since excitation signals always have a certain bandwidth in which a specific mode will have maximum and minimum group velocities, time domain of the wave packet signals will be lengthened and its amplitude decreases, the signal energy reduces after the guided waves travel through a certain distance, dispersion effect will be led. This will reduce detection resolution and distance, finally result into imaging detection resolution significantly [14]. If a guided wave imaging detecting system is abstracted into a propagation linear system without loss, starting from the excitation point, the time is , and the reflection wave propagation distance is , then the guided wave propagation model can be obtained by Eq. (8):
where is, Fourier transform of of the excitation signal, , is the angular wavenumber related to the angular frequency ().
During large-scaled detection, once the signals are excited by a PZT, the other PZT elements will be used to receive reflected signals containing the damage information. The time history signals are assumed to be , If there is no mode conversion in the process of guided wave propagation, then overlays the reflection signals corresponding to different distance features, suppose represents the distance from the actuator to the th sensor and is the reflection coefficient. Then, can be expressed as Eq. (9):
For the -axis in Fig. 2, dispersion has already taken place when the guided waves propagated to the position shown in the figure. If the dispersed guided waves could propagate along the opposite direction of -axis from the current position, the dispersion phenomenon will disappear when arriving at the starting point () according to the same law, but it will occur again if the guided waves continuous propagate to opposite direction of -axis. Therefore, it is possible to consider make guided waves in current position propagate to the opposite direction of -axis until time parameter , so influences of dispersion could be compensated. In fact, it can be viewed as a mapping problem of the guided wave signals from time domain to the distance domain (Fig. 2). The dispersion compensation is:
where is, Fourier transform of . Since:
where and are respectively phase velocity and group velocity. Substitute them into Eq. (10) and it can get:
Fig. 2Mutual mapping relation between time domain (t) and distance domain (x)
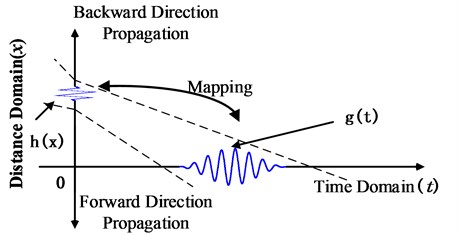
Eq. (12) reveals that dispersion compensation could be calculated through resampling for and by space interval , if Fourier transform of the guided wave signals acquired and the - relationship are known. This realizes a kind of mapping from the time domain to the wavenumber domain.
Fig. 3Waveforms of time domain and distance domain
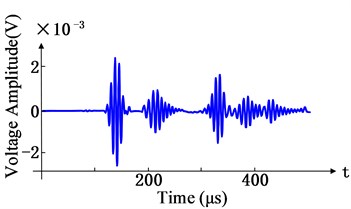
a) Time-domain dispersion waveform
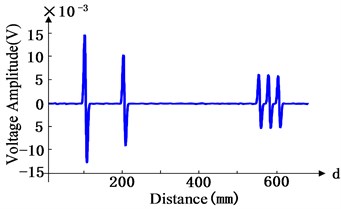
b) Distance domain waveform
In Fig. 3, five-cycle sinusoidal tone bursts modulated with a Hanning window at a central frequency of 300 kHz, is excited and it will increase its bandwidth significantly, accompanied with distinct dispersion after propagating a certain distance. There are four echoed signals in Fig. 3, which are corresponding to propagation distances of 100 mm, 205 mm, 550 mm, 570 mm and 590 mm, respectively. Due to influences of signal dispersion, the boundaries among some waveguide in the time domain are very vague in Fig. 3(a). After mapping compensation, five waveforms in the distance domain become very clear in Fig. 3(b).
4. Baseline signal differential compensation
During the imaging process, healthy baseline signals shall be obtained in advance and then compared with actual signals to highlight the damage characteristic signals. However, Baseline signals are susceptible to changes caused by various external factors, which lead to the poor positioning accuracy of the damage. So, the Baseline signals must be compensated [15]. The guided wave transmission system in frequency domain could be expressed as Eq. (13):
where is captured signal, is the transfer function incorporating all transmitter-specific PZT functions, is the transfer function of receiving system containing all receiving sensors, and is the transfer function related to propagation distance, which contains propagation loss and dispersion. can be expressed as:
where is the guided wave transmission distance, is the guided wave attenuation, is wavenumber in the frequency domain, and is the Geometric distribution losses during the guided-wave propagating. Then, Eqs. (15) and (16) could be obtained as follows:
where is the th guided-wave transmission pathway transfer function of attenuation and dispersion. represents the transfer function or wavenumber expression under undamaged condition signals. represents the transfer function or wavenumber expression of acquiring signals. represents the transfer function or wavenumber at damaged zone. The above Eqs. (15) and (16) are mapped to the wavenumber domain and Eqs. (17) and (18) could be obtained as follows:
where represents the deconvolution of transfer function except sensors. Let and . After subtracting and time-domain inverse transformation of Eqs. (17) and (18), the signal difference before and after the damaged states could be obtained directly:
where , , and are inverse Fourier transforms of , , and , respectively.
After above differential processing, effects of changes of system transfer functions on the baseline signals are eliminated basically and the damaged signals at could be displayed directly. This realizes baseline signal differential compensation and makes preparation for further processing.
5. Pixel optimization of guided-wave imaging partitioning
The synthetic sensor signals of each direction are obtained by using a PZT sensor array and the envelope signals could be extracted from those sensor signals, so the amplitude signals of different directions are obtained. The amplitude of synthetic signals in different directions are expressed in the two-dimensional plane of the distance and direction and the damage image is formed. Color changes in the image reflect amplitude variation from low to high and the highlighted portions of the image are the damage areas [16]. Due to the limitation of the number of acquisition channels in a sensor array, the original damage image is not perfect and need to be further processed to highlight the damage position. Smoothing of non-damaged positions can improve resolution and quality of the image, thus making the processed results more fit for visual features of human [17].
To ensure the signals of the desired direction keeping constant and to achieve the minimum pixel value of corresponding point, pixel weighted value is reflected. This paper adopted a kind of pixel partitioning algorithm, which divides the guided-wave image into several × sub images. Spatial frequency () of each sub image is calculated as follow:
where is row frequency and is column frequency:
SF reflects gray changes of the image. Most natural images can be divided into the smooth regions, edge regions and texture regions. If the gray scale of the image block is gentle, its is small and this image block belongs to the smooth region. If gray of the image block changes violently, it is more likely to be the defect. If the gray changes follow a certain regularity, it belongs to the texture region.
The processing of the edge areas and the texture areas often directly determines the recognition degree of the image and the quality of the image. It is necessary to set a reasonable threshold value. The threshold of the image denoising can be adjusted by the normalized , let , and be the average value (or the threshold), maximum value and minimum value of pixels, respectively. When of any point is smaller than , the normalized NSF could be determined by Eq. (21):
Otherwise, when of a point is larger than , is determined by Eq. (22):
To ensure all potential defect details are considered after the image processing, and shall be chosen reasonably in order to determine quantity of sub images. Furthermore, it is necessary to make a general judgment on properties of sub images where the pixel lies in. If the sub image is too big, it may contain regions of different details, which will make it more possible to make misjudgment on pixel type. If a sub image is too small, it is more likely to be determined as smooth pixel since image is often locally stable. Therefore, sub image size must be determined appropriately.
6. Diagonal loading compensation
For a practical detecting system, the value of the spatiotemporal cross-correlation matrix may be susceptible to a variety of factors, such as signal gain bandwidth, position error, PZTs’ paste mode, sampling frequency error and so on. Once the detection system and system model have changed, the changes of will affect the guided wave imaging quality. Therefore, it is necessary to improve the stability of the detection system. Diagonal loading compensation method could be used for improving the robustness of for the system model as follows:
Since is a symmetric matrix, it can be expressed by Eq. (23):
where is eigenvalues of , is normalized eigenvector corresponding to . Diagonal load compensation could be achieved by the Eq. (24):
where is identity matrix. is a key parameter of Diagonal load compensation which reflects the average noise strength from the received signals, its value satisfies the following Eq. (25):
In this expression, represents the average signal noise power from receive-sensors. is weight vector reflected the positional relationship between the sensors. is estimate weight vector. For the normalized vector, , In general, if the signal-to-noise ratio of the detection system is sufficiently large, then and .
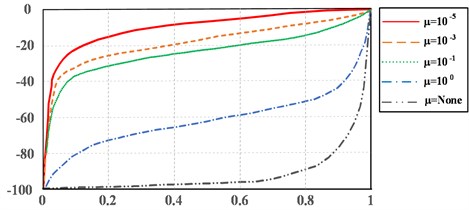
Changing the value of can overcome the negative influence for from external disturbances, improve the robustness of the system and improve the imaging quality. From Fig. 4, the relation of the pixel value and inner product of and , the change of pixel value depends on the change in . But the increase in makes the pixel value deviate from the original value to a greater extent and result into imaging distortion in a greater degree. Therefore, a suitable value must be chosen to balance the image quality and robustness. In this system, image quality could be improved significantly by making as 10-1.
Fig. 4Relation of pixel value with inner product
7. Experimental research
The experimental facility is shown in Fig. 5(a). The testing plate is a piece of 700 mm×500 mm×3 mm aluminum plate. Firstly, the function generator Tek AFG3102 produced excitation signals which would be amplified by the radio frequency power amplifier and then applied onto the transmitting PZT. The excited signals formed Lamb waves on the plate. This Lamb waves propagated along the plate surface, received by the receiving PZT sensors and then collected and recorded by the digital fluorescence oscilloscope Tek MSO4045B.
Fig. 5Experimental facilities and experimental subject
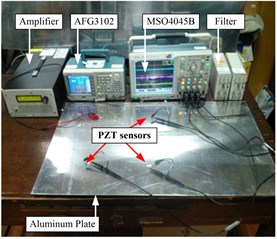
a) Experimental facilities
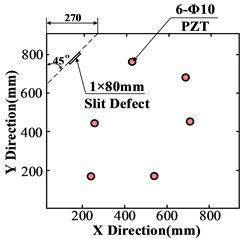
b) Layout of sensors and defect
Theoretically, in order to obtain more redundant reliable signals, a large number of sensors could be used to configure a very dense network with spacing between two sensors similar to or smaller than the scale of the anticipated damage, However, such a dense sensor network is obviously impractical for engineering applications. The alternative is a sparse network using a relatively small number of sensors, with the sensor spacing far greater than the scale of the anticipated damage, which is the usual case in practice and it means tolerating certain measurement uncertainties and sufficient sensitivity to damage-scattered waves. On the other hand, sensors in a network should be placed in an optimal way, so as to achieve the minimum number of sensors, but not at the cost of sacrificing adequate information to describe damage. However, many of the optimized locations are not easy to install the sensors due to structure itself, in order to detect the imaging effect and improve the practicality, the sensors are configured as random sparse network arrays, and there have 6 PZT sensors in the metal plate. Positions of these PZT sensors and the damage are shown in Fig. 5(b). Coordinates of PZT sensors were (250, 180), (540, 180), (270, 430), (710, 450), (430, 760) and (700, 700) mm, respectively. The damage was a 1×80 mm slot with 45 angle degrees and its position was presented in Fig. 5(b). Signals before and after the damage were extracted from different positions through scanning by using everyone piezoelectric patch as the driver and the rest as sensors. Extracting the signal before damage requires multiple samplings and the average healthy signal could be used as the reference signal for following wavenumber domain analysis.
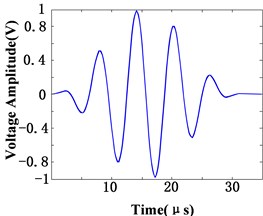
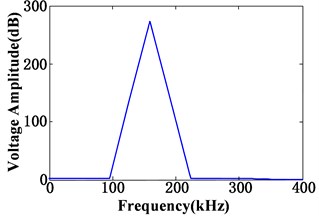
Since analysis on bandwidth Lamb wave propagation is relatively complicated, the time of arrival of wave packet has to be determined to reduce influence of guided-wave dispersion. In this experiment, the excitation applied on the PZT driver is five-cycle sine waves modulated by Hamming window. The central frequency , signal amplitude and the peak number of the signal were determined by 160 kHz, 10 Volt and 5 respectively. The time domain waveform and frequency domain waveform of the excitation signals are shown in Fig. 6.
Fig. 6Time domain and frequency domain waveform of the excitation signal
The 6 PZT sensors on the aluminum plate formed transmitting-receiving pathways. Since the signals acquired from the forward and backward direction transmitting-receiving paths between every two sensors had consistent features, repeated pathways were neglected and only 15 signal pathways had to be analyzed. This reduced the amount of data processing and increased efficiency. The second pathway signals before and after the damage as well as the difference signals are shown in Fig. 7. Guided-wave imaging is to convert these difference signals into visual images.
Fig. 7Signals before and after the damage in the 2nd pathway
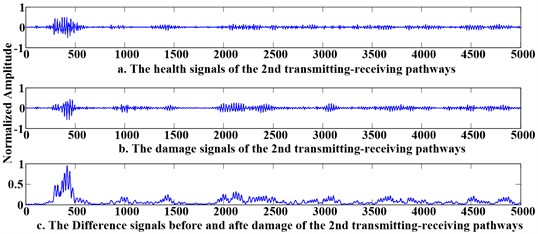
Fig. 8(a) is the structural damage image which is acquired by traditional method directly. It has poor imaging effect, including many noise points and interferences as well as suspected defect area. Fig. 8(b) is the structural damage image which is formed by using only baseline compensation. The image has been improved to a certain extent and the defect position is relatively more explicit, but the imaging effect is still unsatisfying. Fig. 8(c) is the structural damage image formed by using above mentioned multi-parameter compensation include baseline compensation, dispersion compensation and pixel partitioning (16×16). The 45° defect image has very explicit features. The image processed by pixel partitioning (10×10) as well as multi-parameter compensation is shown in Fig. 8(d), where the 45° defect image shows clear features, but pixel features at the defect weakens. The image processed by pixel partitioning (8×8) is shown in Fig. 8(e), where pixel features at the defect further weakens. Since there are limited PZT sensors in this array, the image will contain many noise points and interferences. As a result, Med (SF) in Eq. (21) may not be the optimal threshold for imaging. The imaging result that taking 1.5Med (SF) as the threshold is shown in Fig. 8(f). Although it can locate the defect accurately and reflect shape features of the defect, the visual effect of defect features weakens, which confirms to some extent that Med (SF) is effective.
Fig. 8(a) was taken as the reference to calculate peak signal to noise ratio (PSNR) and root-mean-square error (MSE) from Fig. 7(b) to Fig. 7(f). Results are listed in Table 1. It found that the proposed algorithm that combines multi-parameter compensation and pixel partitioning and optimization can improve guided-wave imaging quality effectively. It eliminates noises effectively while maintaining the edge and texture details of the image.
Fig. 8The structural damage image
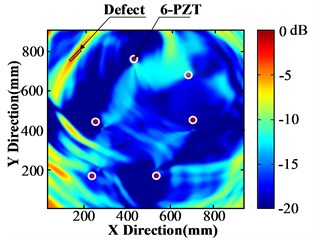
a) Direct imaging
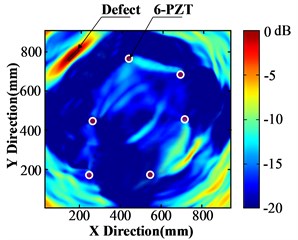
b) Imaging based only on baseline compensation
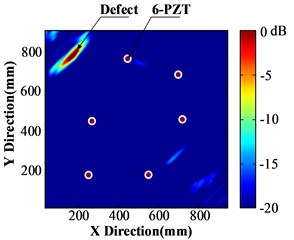
c) Imaging based on Multi-parameter compensations and pixel partitioning (16×16)
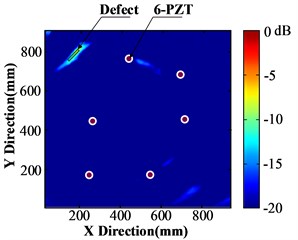
d) Imaging based on Multi-parameter compensations and pixel partitioning (10×10)
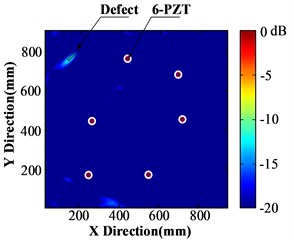
e) Imaging based on Multi-parameter compensations and pixel partitioning (8×8)
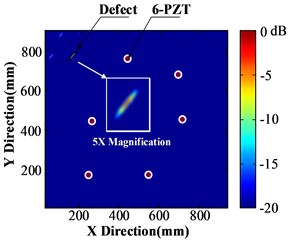
f) Imaging based on higher threshold
Table 1PSNR and MSE under different imaging conditions
Fig. 8(b) | Fig. 8(c) | Fig. 8(d) | Fig. 8(e) | Fig. 8(f) | |
PSNR | 31.3122 | 27.7644 | 27.7369 | 26.517 | 26.012 |
MSE | 48.0687 | 108.8035 | 109.4951 | 110.3831 | 110.6832 |
8. Conclusions
Based on analysis of the principle of guided-wave defect imaging, this paper puts forward a defect imaging algorithm that combines multi-parameter compensation and pixel optimization. It realizes compensation to dispersion parameters through backward propagation method and reference signal compensation through baseline signal differential method in the wavenumber domain. Moreover, a method to improve image resolution and quality based on pixel partitioning and optimization after guided-wave imaging is proposed. The proposed algorithm is applied into imaging effectively and optimizes defect imaging quality.
Experimental results demonstrate that the proposed algorithm displays the 45° defect image features clearly and achieves high positioning accuracy. However, it also reveals that threshold is correlated with highlighting defect features to a certain extent. Future researches will use the multi-objective optimization algorithm or fuzzy logic theory to choose reasonable threshold and reflect defect shape features in the image well, aiming to perfect the guided-wave defect imaging algorithm.
References
-
Zhang Z., Pan Y., Xiao Y., et al. Measurement and analysis of laser generated Rayleigh and lamb waves considering its pulse duration. Acta Mechanica Solida Sinica, Vol. 28, Issue 5, 2015, p. 441-452.
-
Hong M., Su Z., Lu Y., et al. Locating fatigue damage using temporal signal features of nonlinear lamb waves. Mechanical Systems and Signal Processing, Vol. 60, 2015, p. 182-197.
-
Yu L., Tian Z. Guided wave phased array beamforming and imaging in composite plates. Ultrasonics, Vol. 68, 2016, p. 43-53.
-
Ambroziński Ł., Stepinski T., Uhl T. Efficient tool for designing 2D phased arrays in lamb waves imaging of isotropic structures. Journal of Intelligent Material Systems and Structures, Vol. 26, Issue 17, 2014, p. 2283-2294.
-
Fu S. C., Lv Z. J., Ma D., et al. A method of dispersion compensation based on warped frequency transform. Advanced Materials Research, Vol. 718, Issue 720, 2013, p. 2062-2067.
-
Hua J., Lin J., Zeng L., et al. Minimum variance imaging based on correlation analysis of lamb wave signals. Ultrasonics, Vol. 70, 2016, p. 107-122.
-
Fu S., Shi L., Zhou Y., et al. Enhancement of Lamb wave imaging resolution by step pulse excitation and prewarping. Shock and Vibration, Vol. 2015, 2015, p. 1-8.
-
Tian Z., Yu L., Leckey C., et al. Guided wave imaging for detection and evaluation of impact-induced delamination in composites. Smart Materials and Structures, Vol. 24, Issue 17, 2015, p. 7035-7041.
-
Homma A., Hu N., Fukunaga H., et al. An approach for tomographic reconstruction of damage image based on lamb waves. Symposium on Evaluation and Diagnosis, 2012.
-
Hettler J., Tabatabateipour M., Delrue S., et al. Application of a probabilistic algorithm for ultrasonic guided wave imaging of carbon composites. Physics Procedia, Vol. 70, 2015, p. 664-667.
-
Luo C., Li P., Zhu X., et al. Research of damage imaging algorithm in plate based on signal magnitude. Communications in Computer and Information Science, Vol. 461, 2014, p. 319-328.
-
Li P., Zhu X., Luo C., et al. Minimum variance distortionless response guided-wave imaging with particle swarm optimization. Transactions of the Institute of Measurement and Control, Vol. 37, Issue 10, 2015, p. 1274-1281.
-
Koduru J. P., Momeni S., Gonzalez M., et al. Lamb wave tomography utilizing acoustic emission sources in plate like structure. Hydro-Environmental Analysis: Freshwater Environments, 2013, p. 329-332.
-
Agarwal S., Mitra M. Lamb wave based automatic damage detection using matching pursuit and machine learning. Smart Materials and Structures, Vol. 23, Issue 8, 2014, p. 085012.
-
Kijanka P., Radecki R., Packo P., et al. GPU-based local interaction simulation approach for simplified temperature effect modelling in lamb wave propagation used for damage detection. Smart Materials and Structures, Vol. 22, Issue 3, 2013, p. 035014.
-
Yang H. Y., Wang X. Y., Niu P. P., et al. Image denoising using nonsubsampled Shearlet transform and twin support vector machines. Neural Networks, Vol. 57, Issue 9, 2014, p. 152-165.
-
Wang X. Y., Yang H. Y., Zhang Y., et al. Image denoising using SVM classification in nonsubsampled contourlet transform domain. Information Sciences, Vol. 246, Issue 14, 2013, p. 155-176.
About this article
This research is supported by the National Nature Science Foundation of China (No. 51575328) and (No.61603211), and Zhejiang Province National Nature Science Foundation (Y1110557).
Peijiang Li, he is responsible for the writing of this paper and has studies the theory of multi parameter compensation and pixel optimization. Xiaojin Zhu, he is the supervisor of this research group and has revised this paper critically for important intellectual content. Ting You, she helped to analyze theory of guided wave dispersion. Hesheng Zhang, he helped to design experimental facility. Zhiyuan Gao, he helped to acquire the lamb wave signals.
