Abstract
A plexiglass cantilever curved box girder model is built to investigate shear lag effect distribution law in curved box girder. Firstly the finite element model is established based on ANSYS. Secondly the testing is performed on earthquake shaking table test under different earthquake excitations. Finally, the comparative analysis between the theoretical and experimental results is performed. From the above results, it is shown that an evident shear lag effect occur at the junction between web and flange of the cantilever curved box girder model under simulated earthquake excitations, and under the same condition, different kinds of earthquake excitations have limited influence on shear lag effect in curved box girder.
1. Introduction
As a consequence of the distinctive spatial mechanical behavior, box-section girders are widely used in bridge engineering [1, 2]. When the box girder is under symmetric bending load, the shear deformation in the flange will lead to an uneven distribution of normal stress in the flange along the transverse direction, which is referred to as shear lag effect [3]. In recent years, many experts and scholars have conducted extensive and in-depth research on the box girder about shear lag effect and a lot of achievements are acquired [4, 5]. Yet those studies are mainly focused on the curve box girder under static load [6, 7]. There are relatively less studies on shear lag effect under dynamic load, let alone the earthquake excitation. Hence it is necessary to study shear lag effect of curved box girder under earthquake excitation.
2. The calculation of shear lag coefficient
To quantify shear lag effect in real projects, the shear lag coefficient is introduced as below:
where is the actual stress value and the calculation stress value based on elementary beam theory [8].
could be obtained by finite element analysis software or experiments. For , when structure type and mechanical behavior are simple, such as straight box girder, could be substituted by average normal stress value. When they are complex, the theory-based calculation is complex too. For this reason, considering the complex structural styles and mechanical behaviors when shear lag effect is analyzed, a simpler method should be introduced to calculate so as to acquire the shear lag coefficient. In engineering practice, the maximum disparity between the results produced based on the finite element analysis method which is evaluated with the mean value and the elementary beam theory method is relatively small, namely, about 3 %. Therefore, it is feasible to use average value method to calculate instead of the simplified calculation method based on elementary beam theory.
3. Finite element modeling
3.1. Model description
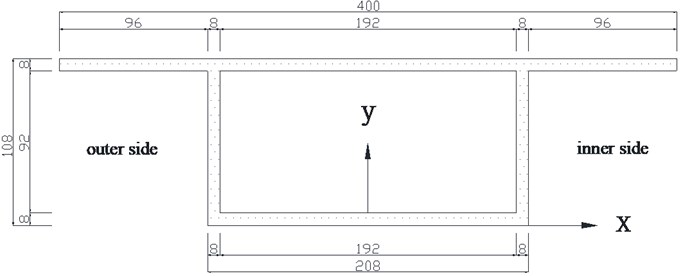
The section dimension is based on Ph.D. dissertation of Lu Hailin [9]. In order to simplify the modeling process, appropriate adjustments are made: the span of the model is 1.047 m, which is calculated by the arc length in the middle of bridge deck. Radius of curvature is 2 m and the angle of center is 30°. The model is made of 8 mm thick plexiglass by cohering them together. Width of upper and lower plate is 400 mm and 208 mm respectively. The height of web plate is 92 mm. The dimensions of box girder are shown as Fig. 1.
Fig. 1Dimension of box girder section, unit: (mm)
3.2. Model constraints
Cantilever bearing is selected as the boundary conditions in the testing. Considering the complexity of seismic excitation as well as avoiding the impact resulting from deformation of bearing on the measurement data, the bearing is made of steel with high rigidity. The model and the bearing are joined together in surface contact form. To make sure a full contact between the model and the bearing, the four corners of the contact are fully bolted.
3.3. Finite element modeling
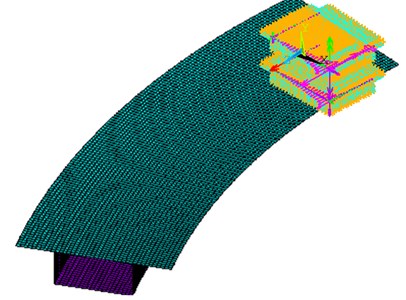
Under the earthquake excitation, the loading condition of curved box girder is complicated, in the paper, the finite element model is setup based on ANSYS (shown as Fig. 2) according to the actual testing model girder and operating conditions. In the modeling the SHELL63 element is adopted to model the upper plate, lower plate and web plate.
Fig. 2Finite element model of curved box girder
4. Test model design
4.1. Arrangement of measuring points
According to the stressing features of cantilever structure, the selected analysis section is shown as Fig. 3, where section I and section II are at 1 cm and 2 from the fixed end respectively. On the basis of measuring-point arrangement rules and taking into account of the fact that the strain gauges come in certain dimensions, the actual arrangements of measuring points are as following:
1) 11 measuring points are laid out on the two sections (upper plate) separately, with 5 measuring points between two webs and 3 measuring points on each flange plate.
Fig. 3Arrangement of measuring points on the upper and lower plate
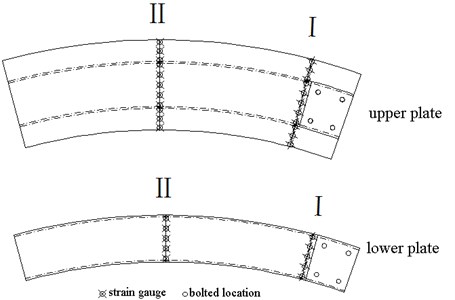
2) 5 measuring points are installed at the lower plate of the section.
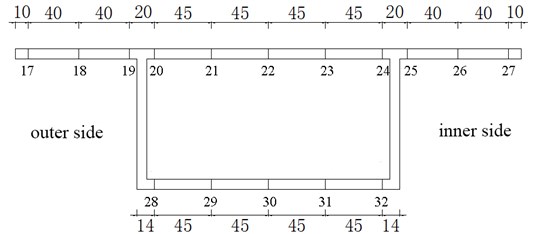
That is to say, there are 16 measuring points being arranged at each section, the total is 32 points at two sections. The locations of those points are shown as Fig. 4 and Fig. 5.
Fig. 4Location of measuring points at section I, unit: (mm)
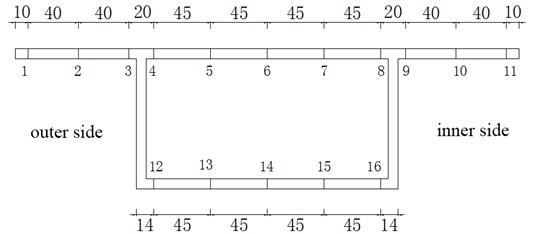
Fig. 5Location of measuring points at section II, unit: (mm)
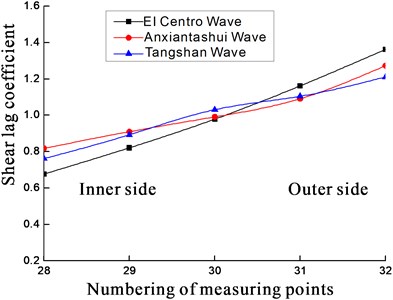
As seen in Fig. 6-Fig. 9:
1) Shear lag coefficient of point 4, 8 (or 9), 12, 16 at section II reach their peak. Those points are close to the junction of web and flange. Other points present relatively small shear lag coefficient and the farther the point is from the junction, the smaller the coefficient will get. That is, the closer the point is from the junction, the larger the coefficient will be. Shear lag coefficient of point 20, 22, 24, 25, 28, 32 at section II reach their peak too. The shear lag coefficient is obvious at the junction, so is the central axis of the upper plate at the two sections.
2) The variation trend of shear lag coefficients is basically consistent at the section I and II under three earthquake waves. What differs is the amplitude of variation. The coefficient at every point under different earthquake waves will not be much of discrepancy. Different kinds of earthquake excitations have limited influence on shear lag effect in curved box girder.
Fig. 6Variation law of shear lag coefficient on section I of upper plate
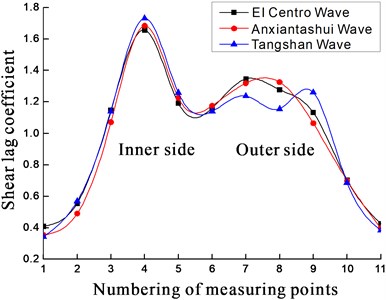
Fig. 7Variation law of shear lag coefficient on section II of upper plate
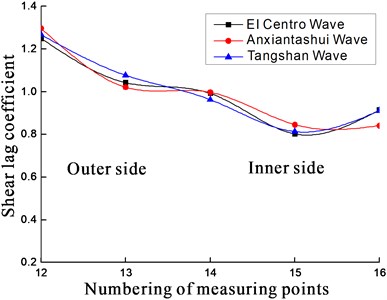
Fig. 8Variation law of shear lag coefficient on section II of upper plate
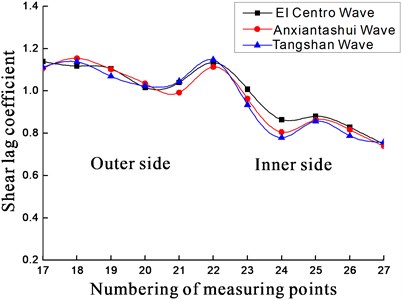
Fig. 9Variation law of shear lag coefficient on section II of upper plate
4.2. Comparative analysis
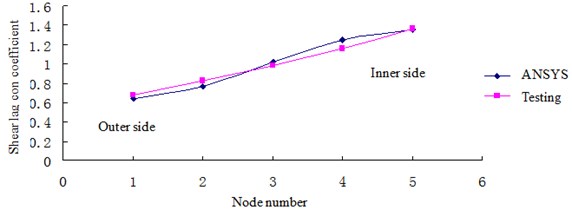
The shear lag coefficients calculated from ANSYS finite modeling and testing at section I and section II are shown as Fig. 10, Fig. 11, Fig. 12 and Fig. 13. It can be seen that
1) The law of the shear lag coefficients at section I and section II is same between finite element modeling and testing, which shows that the testing results are reliable and finite element modeling is accurate.
2) The shear lag coefficients of outer points, No. 1 and No. 2 (Section I) are different, the reason may be the different boundary between finite element modeling and testing.
Fig. 10Shear lag coefficient on section I of upper plate
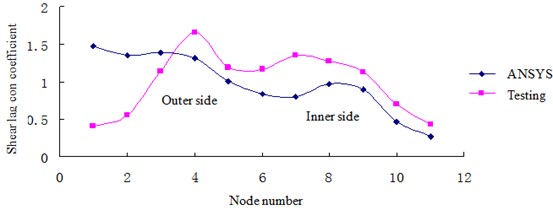
Fig. 11Shear lag coefficient on section II of upper plate
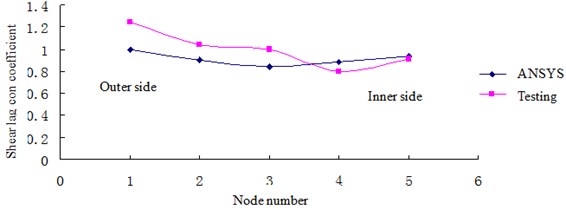
Fig. 12Shear lag coefficient on section I of lower plate
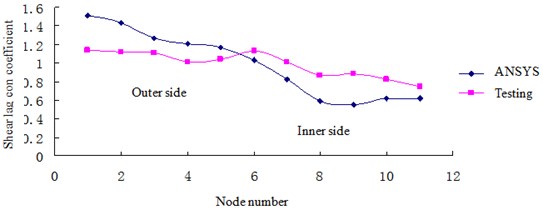
Fig. 13Shear lag coefficient on section II of lower plate
5. Conclusions
In this earthquake shaking table test, three conclusions could be drew as follows:
1) Shear lag coefficient appears obvious at the junction of web and flange under earthquake excitations.
2) Under the same condition, different kinds of earthquake excitations have limited influence on shear lag effect in curved box girder.
3) The shear lag effect based on the finite element modeling and testing are almost the same, which testify the accuracy of finite element modeling, it is of great theoretical and engineering significance.
References
-
Lan Zhenbo, Li Minna Handling of bearing disengagement from a curved steel box girder with heavy longitudinal slope and sharp radius. Bridge Construction, Vol. 44, Issue 6, 2014, p. 117-121.
-
Çalik-Karaköse lkü H., Orakdöen Engin, Saygun Ahmet I., Askes Harm A curved shell finite element for the geometrically non-linear analysis of box-girder beams curved in plan. Structural Engineering and Mechanics, Vol. 52, Issue 2, 2014, p. 221-238.
-
Lin Pengzhen, Fang Weibin, Yang Zijiang, Sun Lixiang, Ji Wei Shear lag effect analysis of box girder bridge under prestressing effect. China Journal of Highway and Transport, Vol. 28, Issue 5, 2015, p. 101-107.
-
Zhou Y. Analysis of the shear lag effect of cantilever box girder. Engineering Review, Vol. 34, Issue 3, 2014, p. 197-207.
-
Lin Penghen, Sun Lixiang, Yang Zijiang, Ji Wei Research on shear lag effect of twin-cell box girders. Journal of Railway Engineering Society, Vol. 31, Issue 1, 2014, p. 59-63+112.
-
Zhang Yuanhai, Lin Lixia shear lag analysis of thin-walled box girders based on a new generalized displacement. Engineering Structures, Vol. 61, Issue 4, 2014, p. 73-83.
-
Luo Q. Z., Li Q. S. Shear lag of thin-walled curved box girder bridges. Journal of Engineering Mechanics, Vol. 126, Issue 10, 2000, p. 1111-1114.
-
Lu Hai Lin, Chen Li Peng, Zhu Song Bo, Wan Chong Yong, Qian Jia Qi Analysis of effect factors about shear lag in curved box girder under seismic loads. Advanced Materials Research, Vols. 926 930, 2014, p. 505-510.
-
Lu Hailin Theoretical Analysis and Experimental Study on Shear-lag Effect of Prestress Concrete Curved Box Beam. Tianjin University, Tianjin, 2007.
About this article

This study was supported by the Natural Science Foundation of China (No. 51378404) and the Graduate Student Education Innovation Fund of Wuhan Institute of Technology (No. CX2013115) and the Natural Science Foundation of Hubei Province (No. 2014CFB773).
