Abstract
Gearbox is the core component of various machines and vehicles, so it is necessary to monitor the performance degradation of gearbox for improving the reliability of mechanical equipment and vehicle. The use of the health condition monitoring on core components such as gearbox can reduce the economic losses due to its failure In this paper, some parameters are extracted from data of run-to-failure test, for example, kurtosis, RMS and energy. The performance degradation of the gearbox is analyzed and predicted by the monitoring the parameters. In this paper, some forecasting methods such as ARMA model, moving average line and feed forward neural network are compared by calculate absolute error.
1. Introduction
It is necessary to monitor the performance degradation of gearbox for improving the reliability of mechanical equipment and vehicle. Because the gearbox is the core component of all kinds of machines and vehicles, and the failure of the gearbox will cause the whole mechanical system to be paralyzed, and large economic loss will be caused.
The use of the health condition monitoring on core components such as gearbox can reduce the economic losses due to its failure. There are some parameters will have a certain trend of the change with the degradation of the gearbox, for example, kurtosis, RMS and energy. So the degradation of the gearbox can be monitored by monitoring the changing trend of these parameters, the result of parameter prediction will affect the judgments of the degradation process of the gearbox.
So it is important to choose the appropriate prediction method. Gooijer et al. [1] presented a comprehensive overview of time-series prediction. Cox [2] build direct MS models to predict the parameters. Marcellino et al. [3] made a comparison of direct and iterated multistep AR methods for forecasting macroeconomic time series. Gang Niu et al. [4] investigates and discusses an iterative multi-step-ahead prediction system, which contains Dempster-Shafer regression (DSR) model.
In this paper, some forecasting methods such as ARMA model, moving average line and feed forward neural network are compared. The vibration data of the gearbox is used to compare the validity of these forecasting methods.
2. Selection of parameters
In this paper, the parameters that can reflect the degradation of the gearbox are used to validate the above prediction method. The vibration signal data of the gearbox wear degradation process is obtained through the run-to-failure test of the planetary gearbox. The kurtosis, energy and RMS are extracted as characteristic parameters by analyzing the data by MATLAB. They are the important indexes for judging the mechanical system status. Although three indexes all can be used to analyze the degradation process of mechanical system, the parameters that can best reflect the gearbox degradation process should be chosen and carried out to predict.
The kurtosis reflect impulse feature of the vibration signal, and it is very sensitive to impulse feature of the signal, the impulsive vibration is existence in the condition of mechanical movement if its value is too large. The formula as following:
The RMS is important index for judging the mechanical system status. The formula as following:
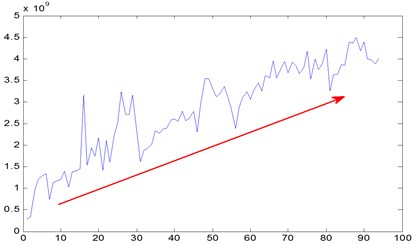
The energy is the square sum of the amplitude of the discrete vibration signal. The formula as following:
The Figs. 1-3 represents the three parameters.
The trend of RMS and energy are steeper than the trend of kurtosis by contrast the above three figures, As the experiment proceeded, RMS and energy maintained a gradually increasing trend, and the variation trend of kurtosis is not obvious, RMS and energy can reflect degradation trend of the planetary gearbox, but because the value of energy is too large, so select the RMS as prediction parameter.
Fig. 1Time series of kurtosis
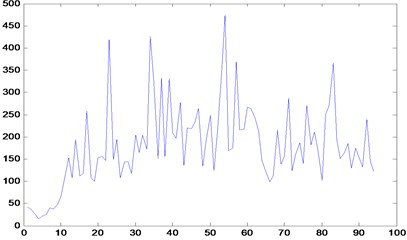
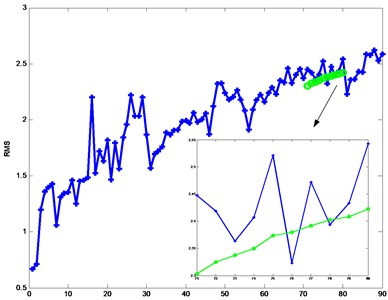
Fig. 2Time series of RMS
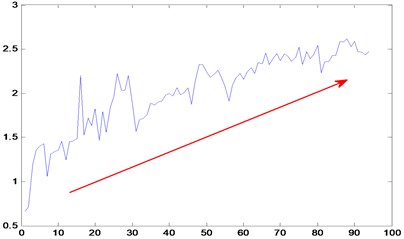
Fig. 3Time series of energy
3. Prediction and analysis of gearbox performance degradation
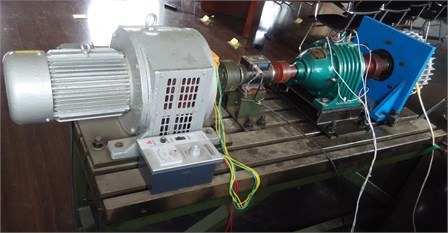
The data is obtained through the run-to-failure test platform of planetary gearbox, the platform consist of a power device, a load device, a planetary gearbox, shaft coupling and a data acquisition unit. The power plant is supplied by the electromagnetic speed motor of 4 Kw, the load device is provided by the magnetic powder brake, and the data acquisition device is composed of vibration sensor and data acquisition system. As shown in Fig. 4.
Fig. 4Test platform
The RMS parameters sequence was obtained by the signal processing of the raw vibration signal which acquired by the data acquisition system. The degradation of planetary gearbox is described by the changing trend of RMS. In this paper, ARMA model and moving average line model are used to forecast the time series of RMS.
3.1. Prediction of ARMA model
The full name of the ARMA Model is Auto-Regressive Moving Average, it is the important model of the time series, and the ARMA(, ) model is as follows:
The is white noise sequence in the formula. The ARMA model consists of auto regression model (AR model) and sliding average model (MA model), when 0 ARMA model translate into the AR model, when 0 ARMA model translate into the MA model, compared to the two models, the ARMA model has higher precision, but the parameter estimation is more complex. In the early stage of data forecasting, the most suited model of the above three models should be chosen. Commonly used method is the autocorrelation and partial correlation analysis, if autocorrelation function tails, partial correlation function is truncated, then select AR model; if the autocorrelation function is truncated, partial correlation function tails, then select the MA model; if the autocorrelation function and partial correlation function are all tail, then select the ARMA model. [5] There are two methods to determine order for ARMA model, one is AIC or BIC, another is trying order one by one from low order to higher order, until the result is not rejected.
It is important to determine which model for prediction before forecasting, so according to the above mentioned criteria for analysis and judgment, the autocorrelation analysis and partial correlation analysis of the original data is carried out firstly. There are toolboxes for autocorrelation analysis and partial correlation analysis in the MATLAB, and use it to carry out autocorrelation and partial correlation analysis for original data, and draw the autocorrelation chart and partial correlation chart. As shown in Fig. 5.
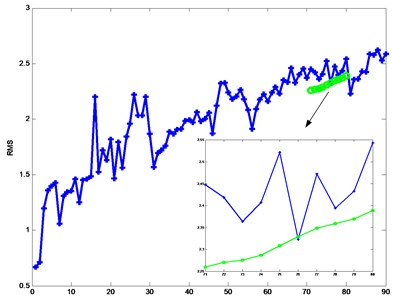
The autocorrelation function and partial correlation function are all tail on autocorrelation diagram and partial correlation diagram, and there is no truncated phenomenon. Therefore, the ARMA(1, 1) model is selected to forecast in this paper, the first 70 data of the sequence was used to predict the data by MATLAB and prediction curve as shown in Fig. 6.
Fig. 5Autocorrelation and partial correlation
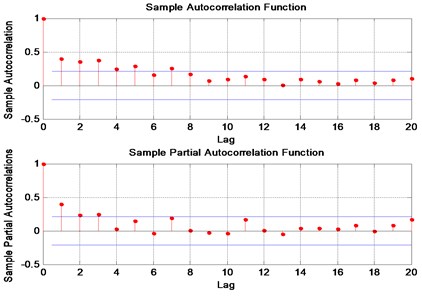
Fig. 6Line of ARMA model prediction
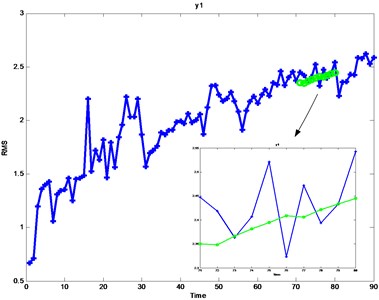
Fig. 7Prediction of moving average line
a) 5 h moving average line
b) 10 h moving average line
c) 15 h moving average line
d) 20 h moving average line
3.2. Moving average line model
Moving average line model is usually used to forecast the stock price trend, different crossing period can be chosen, the model use the period of data to calculate the mean value as a predictive value, the moving average line are composed of every point of the computation. The model formula is as follows:
Moving average line is derived data sequence from the original data by averaging, so it does not appear obvious trend deviations and maintains the original data trend. And the moving average line plays a certain repair mixing effect, the repair mixing effect is better as the longer time. And because it is the average of several data during the spanning period, it is not affected by the individual outstanding data, and the forecast results have some stability. But it also has some hysteresis.
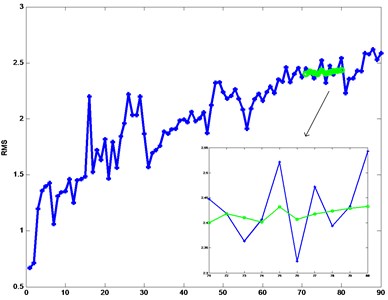
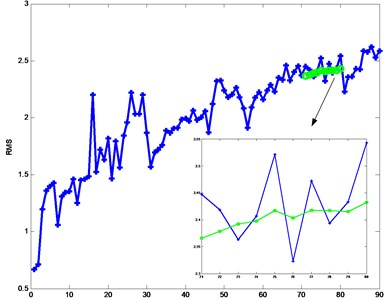
As the different step moving average line will have different forecasting results, so this paper uses 5 h, 10 h, 15 h and 20 h four kinds of step size to forecast the raw data. The predicted results was obtained by MATLAB and shown in Fig. 7(a)-(d) respectively corresponding step 5 h-20 h, the red curve diagram is forecasting curve, and the blue curve is the original data line, compared the four figure, the prediction curve is more stable with longer step, and won’t be affected by recent mutation factors influence.
In addition, the moving average line is widely used in engineering because it is simple and practical and the forecasting effect is good. And there are also some improved prediction methods for moving average, such as: two moving average line, weighted moving average line. The weighted moving average line give each point a different weight, the larger weight of the point as the longer distance to the forecast points. Thus, the moving average line model is more realistic than traditional moving average line.
3.3. BP neural networks
BP neural network is a typical feed forward neural network, and it consists of input layer, hidden layer and output layer. The information is transmitted into the input layer, through the hidden layer of processing, and will be outputted through the output layer. In this paper a BP neural network is established as shown Fig. 8, which contains ten neurons as input layer and fourteen neurons as hidden layer, the output layer of the BP neural network also consists of ten neurons.
Fig. 8BP neural network
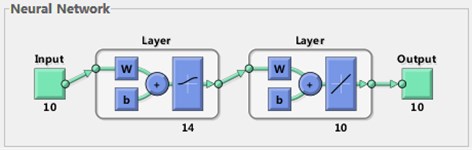
Fig. 9The prediction result of neural network
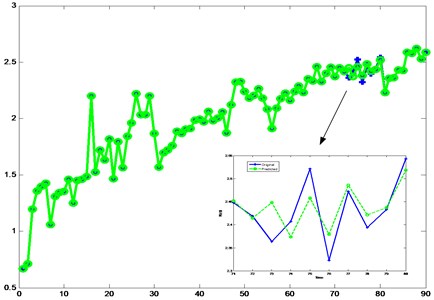
In this paper, the top 50 data are the training sample for the neural network, and the ten data which between 61-70 are the input sample, and the test sample is 71-80 data. First the neural network is trained by the training sample, then using 61-70 ten data predict 71-80 data, finally the result of prediction is tested by the test sample. The prediction result is shown as Fig. 9.
4. Comparison of methods
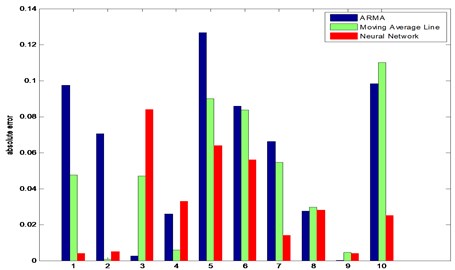
The absolute error of 71-80 data is calculated to contrast the veracity of the three prediction methods using in the foregoing paragraphs. The result of comparison is shown as Fig. 10.
As shown the Fig. 10, the red bar represent the absolute error of the neural network, the blue bar represent the absolute error of the ARMA model, the green bar represent the absolute error of the moving average line. The absolute error of the neural network is least, though the third is the biggest.
Fig. 10The comparison of three methods
5. Conclusions
In this paper, the vibration signal data of the gearbox wear degradation process is obtained through the run-to-failure test of the planetary gearbox. The kurtosis, energy and RMS are extracted as characteristic parameters by analyzing the data. And RMS is selected as prediction parameter to reflect the degradation process of the planetary gearbox. And the parameters are predicted by using three methods. The advantages and disadvantages of the method are compared by calculating the absolute error. Finally, the prediction result of neural network is best.
References
-
Gooijer J. G. D., Hyndman R. J. 25 years of time series forecasting. International Journal of Forecasting, Vol. 22, 2006, p. 443-473.
-
Cox D. R. Prediction by exponentially weighted moving averages and related methods. Journal of the Royal Statistical Society, Vol. 23, 1961, p. 414-422.
-
Marcellino M., Stock J., Watson M. W. A comparison of direct and iterated multistep AR methods for forecasting macroeconomic time series. Journal of Econometrics, Vol. 135, 2006, p. 499-526.
-
Gang Niu, Bo Suk Yang Dempster-Shafer regression for multi-step-ahead time-series prediction towards data-driven machinery prognosis. Mechanical Systems and Signal Processing, Vol. 23, 2009, p. 740-751.
-
George E. P. Box, Gwilym M. Jenkins, Gregory C. Reinsel Time Series Analysis: Forecasting and Control.
About this article

