Abstract
The paper presents a concept of research and evaluation of innovative interfaces dedicated to electric cars. The presented study focuses on multifunctional steering wheel used in a car designed for both able-bodied people (of different ages) and disabled people (with paralysis of lower limbs). The design of the steering wheel provides all the functions of driving (including implementation) only with the help of upper limbs. This also applies to the accelerator and brake functions, using special rings. The steering system, whose integral part is the steering wheel, was designed in such a way as to be able to modify selected parameters. In the case presented in the paper it is the relationship between maximum steering angle and the total turning of the wheels (the so-called steering ratio). The study was performed on a dynamic simulator, which carried out two tests using: classic steering system (classic steering wheel with gear ratio 450°/35° and foot pedals for acceleration and braking) and multifunctional steering wheel with two variant ratios:120°/35° and 180°/35°. The results of measurements were further analyzed.
1. Introduction
The subject of the analysis was the already mentioned eco-car characterized, among other things, by: electric drive, “steer by wire” system (which is of particular importance in designing adaptive human-vehicle interface). The car was designed as part of the “Eco-Mobility” project implemented under the Innovative Economy Operational Programme co-financed from European Regional Development Fund. The prototype of the car and some of its functions were demonstrated on the website: http://www.eco-mobilnosc.pw.edu.pl/ [1, 3]. The concept of the aforementioned studies is based on carrying out an experiment on dynamic 3D vehicle simulators. These simulators are equipped with new interfaces (in this case, a new steering wheel) and a classic steering system. The procedure of the study covered: developing 2 tests, making measurements of dynamic waveforms of selected parameters during implementation of the tests, defining their metrics and characteristics allowing for inference and evaluation of used interfaces.
The aim of most of the tests carried out in the preprototyping cars phase is analysis of the cars’ driving characteristics. A typical example of such test aimed at evaluation of the vehicle is the “moose test”. Studies on the car’s driving characteristics are fundamentally different from studies on HMI evaluation. Unfortunately, studies on the functionality of new HMI were performed quite rarely [4, 5] and so, there are no proven and recognized procedures for this type of tests. The following article tries to fill this area of knowledge. Fig. 1 shows: a) Eco car, b) Eco – steering wheel (the subject of simulator research), c) research in the simulator.
2. Research methodology
The basic aims of the study were:
a) Validation of maneuvering and assigning a metric to each test, which would allow for evaluation of the maneuvers;
b) Sub-optimization of parameters (e.g. steering ratio) using the aforementioned metrics.
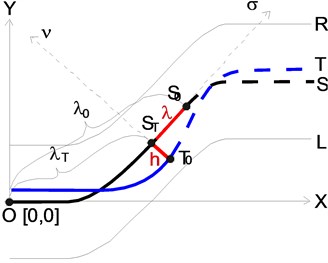
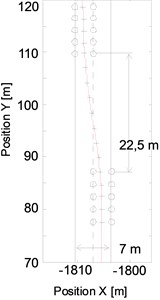
In the first point there are two significant problems. Firstly, which signals should measured and how, with the course of time, to determine these metrics. These problems are essentially focused on one key issue - determining the reference trajectory. The reference trajectory is defined here as a path ensuring safe drive and proper execution of the maneuvers. This path can be determined either by calculation on simulation models or by simulated drive performed by a professional driver. The task of the driver involved in the experiment is keeping up the vehicle with the reference line of trajectory with set speed (changing in time). The location of reference trajectory was presented to the drivers in the form of markers placed in the road (Fig. 2(a)). In order to evaluate the course of the experiment, the following assumptions were made: the maneuver should be considered valid if a vehicle did not go outside of its lane and did not cause collision. Next, the subject of measurements were the deviations from reference trajectory and speed. The method of assessing the drive with the distance is shown in Fig. 2(b). Distances marked: – distance in tangential direction, – distance in direction normal to the reference trajectory. Path lines were marked as follows: – line of the right edge of the lane, – realized trajectory of the test driver, – line of reference trajectory driver, – line of the left edge of the lane. Points and represent the center of gravity for selected time , where – is reference location, and – location carried out when attempting to drive. The evaluation of the passage consists of designating two metrics for distance with respect to the reference trajectory: – in normal direction and in tangential direction . The use of reference trajectory distinguishes the presented research methodology from driveability studies using e.g. “moose test”.
Fig. 1The object of research
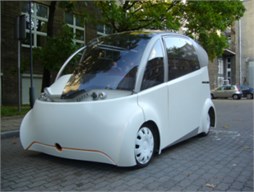
a) Eco-car
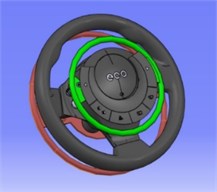
b) Eco-car’s steering wheel
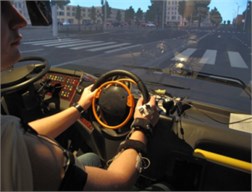
c) Research station in dynamic simulator
Fig. 2Reference trajectory: a) presentation in the simulator, b) the method of assessing the path with distances in tangential and normal direction
a)
b)
In this paper, the aforementioned metrics were determined as: mean deviation of the absolute value, rms deviation of the actual trajectory from reference trajectory or reference speed. Putting the hypothesis that the steering ratio affects the oscillation of the track around the reference trajectory, an important issue could be the problem of evaluating the alternate component distance between the reference and experimental path. To evaluate this phenomenon (also called “yawing”) we may use metrics including harmonic amplitudes of the alternating component (generated by the decomposition into Fourier series using, for instance, FFT). Sub-optimization and evaluation of the steering wheel’s functionality based on application of statistical methods is a complex task. The solution of this problem adopted in the paper is both heuristic and preliminary. Therefore, a correct assessment of the steering wheel’s functionality will require further work. The preliminary thesis is as follows: the best solution is the one that causes no incorrectness (leaving the lane or collision), minimizes the value of the abovementioned metrics and whose frequency response does not disclose higher frequencies compared with alternatives.
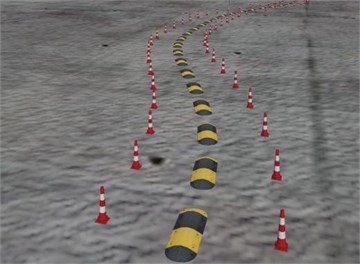
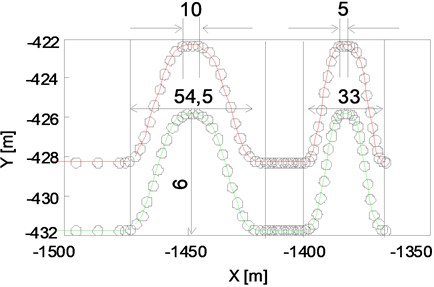
Research in dynamic simulator included 2 tests of a different nature (Fig. 3):
– test 1 – a “route” type path including tests of stability control when driving with stable speed, including such “set fragments” as: straight section (1), curve (2), double lane change maneuver (3), second straight section (4) and avoiding a collision with a pedestrian (5);
– test 2 – a “slalom” or “serpentine” type path requiring simultaneous changes in speed and direction of movement of repeating “tightening” curves of the road.
Tests were performed with an innovative steering wheel with two types of steering ratio: 180°/35° (180) and 120°/35° (120) as well as a classic steering wheel (NOR).
The research group in the experiment were men aged 20-23, holding a driving license. The number of them was 38. All drivers were able-bodied and in possession of a driving license.
Fig. 3Fragments of the path: a) avoidance maneuver on “route” type path, b) curves on the “slalom” type of path.
a)
b)
3. Results of simulator rides and preliminary statistical evaluation
Fig. 4 shows graphs of function (symbol markings and Fig. 2(b)) of the simulator rides made on 2015-04-01 by driver code BM04 using three steering wheels (NOR – normal steering wheel, “180” – Eco steering wheel with steering ratio 180°/35°, “120” – Eco steering wheel with steering ratio 120°/35°) in the “route” type test - straight section.
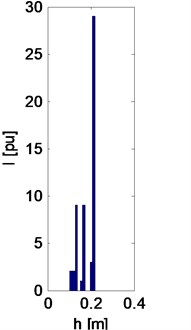
Fig. 5 shows histograms of average waveforms of function (absolute distance deviation of universal driver for “route” type path – straight section. The universal driver is understood as one assigned characteristics (in this case, average values) of rides obtained in all tests (one of the elements of set of characteristics of the universal driver will be the characteristics of the waveforms shown in Fig. 4). The results of parametric Kolmogorov-Smirnov tests indicate that distribution of probabilities for these histograms are not “normal”. Below are the average values of function of the “universal” driver for different steering wheels:
• NOR: 0.1435 m,
•“180”: 0.165 m,
• “120”: 0.1866 m.
Fig. 4Graphs of function hλT (symbol markings h and λ Fig. 2(b) of the simulator rides made on 2015-04-01 by driver code BM04 using three steering wheels (NOR – normal steering wheel, “180” – Eco steering wheel with steering ratio 180°/35°, “120” – Eco steering wheel with steering ratio 120°/35°) in the “route” type test – straight section
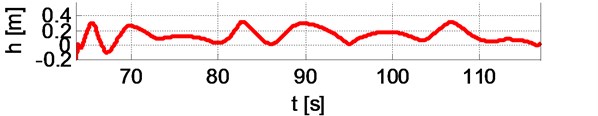
a) BM04 NOR
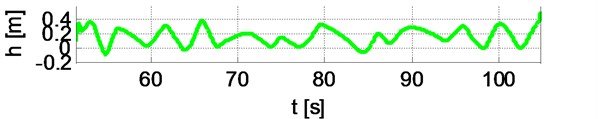
b) BM04 180
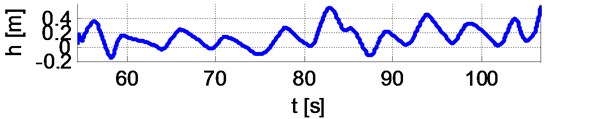
c) BM04 120
It can be seen that the mean values of function of the “universal” driver increase with the increase of steering gear ratio (the highest value obtained for “120” steering wheel).
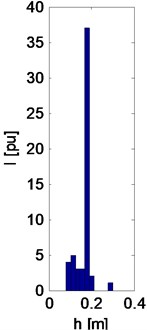
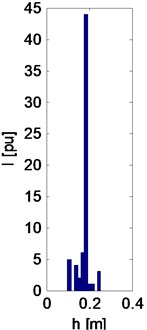
Similar analysis results for a different parameter: rms waveform of distance are shown in Fig. 6. For this parameter, the following average values (characterizing the universal driver) were obtained for different steering wheels:
• NOR: 0.17777 m,
• “180”: 0.21159 m,
• “120”: 0.22354 m.
As in the previous case, the effective values of function of universal driver increase along with the increase of the steering gear ratio (the highest value obtained for “120” steering wheel).
Fig. 5Histograms of mean value of function hλT of universal driver’s rides with different types of steering wheels: “NOR”, “180” and “120”
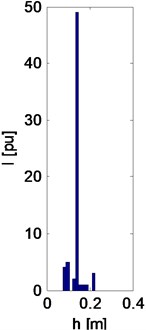
a) NOR
b) 180
c) 120
Fig. 6Histograms of effective value of function hλT of universal driver’s rides with different types of steering wheels: “NOR”, “180” and “120”
a) NOR
b) 180
c) 120
4. Conclusion
We presented an original research methodology for functionality of an innovative interface based on the analysis of results of simulator rides of individual drivers. The essence of this assessment the possibility of determining the waveforms of two variable distances (defined in Fig. 2(b)): the normal and tangential . Created distance waveforms (treated as signals) may be characterized based on different characteristics, including: average value, average absolute value, standard deviation, effective value or harmonic amplitudes of the variable component. The properties of these features can be examined statistically.
The paper shows preliminary results of studies of properties of probability distributions of normal distance parameter of the universal driver based on the analysis of two selected characteristics: the average absolute value and effective value (universal driver is understood to be a driver assigned the characteristics of rides obtained in all performed tests). The analysis results show that probability distributions for empirical histograms are not normal. Assessing the functionality of the steering wheel based solely on the average values of distance function obtained by the universal driver, it can be concluded that the increase of steering ratio results in the increase in deviation of average and effective value of distance function. This result may mean that a normal steering wheel (with pedals) is the best, and the so-called eco-steering wheel – respectively worse, where “180” steering wheel with 180°/35° ratio is better than “120” steering wheel with 120°/35° ratio. However, due to the preliminary nature of the statistical analyses of the tests, the obtained results are exploratory.
References
-
Choromański W. Ecomobility. Innovative and Ecological Means of Transport. WkiŁ (Transport and Communication Publishers), Vol. 1, 2015, (in Polish).
-
Choromanski W., Kozłowski M., Grabarek I. Driver – ECO car system: design and computer simulation of dynamics. Journal of Vibroenginering, Vol. 17, Issue 1, 2015, p. 411-420.
-
Choromański W., Grabarek I., Kozłowski M., Ufnalski B., Barwicki M. A new concept of ECO-car with electric drive. Selected Proceedings of 13th The World Conference on Transport Research (WCTR), Rio de Janeiro, Brasil, 2013 p. 15.
-
Messaoudène K. Ait Oufroukh N., Mammar S. Innovative brake handwheel concept for paraplegic drivers. IEEE Transactions on Vehicular Technology, Vol. 59, Issue 7, 2010, p. 3272-3285.
-
Peters B., Östlund J. Joystick Controlled Driving for Drivers with Disabilities. Swedish National Transport Research Institute, VTI Report 506A, 2005.
About this article

