Abstract
In response to the strength performance requirements of the new energy Off road Vehicle steering system, this article analyzes and studies the strength performance and failure modes of the new energy Off road Vehicle steering rod based on a certain new energy Off road Vehicle model through simulation, bench experiments, and vehicle strength testing teams. Based on various vehicle misuse conditions, the force law of the steering rod under different vehicle driving conditions was analyzed, and a load spectrum for the steering rod strength bench test was developed to meet the actual vehicle usage conditions. The results indicate that the steering rod strength failure is mainly manifested as bending failure of the compression rod under alternating tension and compression conditions. Finally, based on the stability principle of the compression rod, the requirements for the strength performance index of the steering rod are proposed. The research results can provide certain technical support for the strength assessment of the vehicle steering rod.
1. Introduction
The steering system is an important component in vehicles. The strength and durability of the steering system plays a vital role in the driving safety as well as maneuvering stability of the vehicle [1-4]. Due to the complexity of road conditions in the driving process and the possibility of multiple abuse conditions, the design of the strength and durability of the steering system should consider not only the steering system strength performance under normal driving conditions, but also the vehicle steering system strength performance under abuse conditions. Thus, the study of the strength properties of vehicle steering tie rods plays a significant role in vehicle driving safety.
Zhang Wujie [5] carried out a study on the steering tie rod load in the proving ground. Yang Zhen and Geng Haijun [6] conducted a theoretical analysis on the instability deformation of commercial vehicle steering tie rods. He Jiazhi et al. [7-9] analyzed the steering cross tie rod fracture problem through metallographic and chemical composition analysis, and determined the main factors leading to the steering cross tie rod fracture through the design of orthogonal tests. Chen Yong et al. [10-11] performed the analysis of the steering tie rod ball head pull-off force and the steering tie rod compression bending force through CAE simulation, and optimized the steering tie rod based on the simulation results. Han Gabon et al. [12] investigated the effect of tire air pressure on the force characteristics of steering tie rods by experiment.
This paper collects the steering tie rod force situation for a new energy off-road vehicle under the user abusive working condition test, using simulation and bench test to analyze the steering tie rod failure force state, and effectively improves the tie rod failure force state.
2. Structure and force analysis for steering system
2.1. Steering system structure
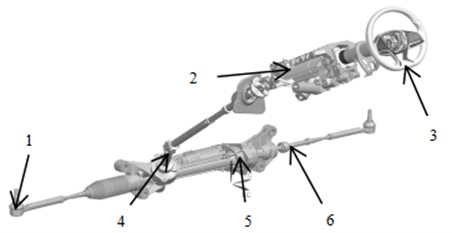
A structural diagram of the automobile steering system is shown in Fig. 1. It is mainly composed of two parts: electric power steering system and mechanical steering system. The electric power steering system contains steering angle sensor, steering torque sensor, position sensor, power steering control module and power assist motor assembly. The mechanical steering actuator part includes steering wheel, steering column, universal joint, steering rack and pinion, and steering tie rod.
Fig. 1Steering Gear Structure Composition: 1 – steering outer link and ball pin assembly; 2 – steering column and universal joint; 3 –steering whee; 4 – steering input shaft; 5 –housing; 6 –steering inner link
2.2. Force analysis for steering tie rods
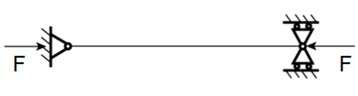
As shown in simplified model of vehicle steering structure in Fig. 2, the steering tie rod is subjected to tension and pressure in the vehicle steering system. Therefore, during the strength analysis of the steering cross tie bar, it can be converted into a two-force bar structure as shown in Fig. 3.
Fig. 2Simplified model of vehicle steering structure: 1 –left steering rod; 2 – right steering rod; 3 –steering trapezoidal arm; 4 – steering gear
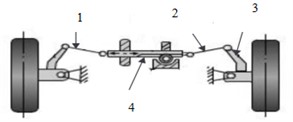
Fig. 3Steering cross tie bar compression simplified mode
2.3. Steering tie rod failure analysis
Based on section 1.2, the steering cross-tie bar is only subject to two kinds of forces, tension and pressure. The failure of the bar under pressure will generally be in the form of strength damage and instability damage.
The former, strength damage, is mainly caused by insufficient material resistance, while the latter, instability damage, is the result of bar geometry deformation during force application.
According to the magnitude of the slenderness ratio, press bars can be categorized into three types: long thin, medium long, and short thick. The bar flexibility factor is:
where is the length coefficient, the length of the rod, is the inertial radius of the cross-sectional area, is the material elastic modulus, is the material proportionality limit, is the material yield limit, a and b are coefficients related to the material properties.
The steering tie rod analyzed in this paper is made of 40Cr. The center distance between the two ends of the installation point is 360 mm, the elastic modulus E of the material is 206 GPa, and the proportionality limit is between 450 MPa and 785 MPa. In this paper, two specifications of steering tie rods with diameters at the minimum of 13.8 mm and 14.0 mm were selected for the study, and the minimum scale limit of 450 MPa was used for the calculations. Therefore, the minimum flexibility coefficient of the steering cross tie rods is:
According to the calculation, the steering cross tie rod classified as slender rod. The theoretical calculated critical instability pressure of 13.8 mm diameter tie rod is:
According to the calculation, the steering cross tie rod classified as slender rod. Based on the stability principle of Euler compression bars, the theoretical calculated critical instability pressure of 13.8 mm diameter tie rod is:
The theoretically calculated critical instability pressure for a 14 mm diameter tie rod is:
3. Steering tie rod load test
Bad road conditions and strength test conditions (user abused conditions) were collected for the load characteristics of steering tie rods are collected in this paper. Before the steering tie rod is loaded and tested, in order to accurately test the stress state of the steering tie rod during the test, the strain gauges of the steering tie rod need to be patched and calibrated. The patch location is shown in Fig. 4, this article calibrates the load of the steering linkage through 5 test data, Data as shown in the table, the uncertainty of the calibration data for the left and right steering links is 0.22 % and 0.4 %, respectively, indicating that the data is valid.
Fig. 4Steering cross tie calibration
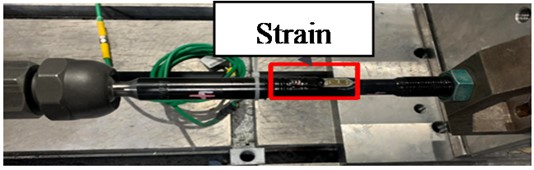
Table 1Steering rod calibration data
Test No. | Calibration coefficient | ||||||
1 | 2 | 3 | 4 | 5 | Uncertainty | Relative | |
L | 82.285 | 81.967 | 82.126 | 82.194 | 81.273 | 0.18 | 0.22% |
N | 80.835 | 81.536 | 80.937 | 80.871 | 81.628 | 0.346 | 0.4 % |
3.1. Proving ground bad road conditions
The bad road conditions of the test site were mainly collected from Belgium road, railroad intersection, short-wave road, vibration road, 26-inch pits and other bad road conditions that have a greater impact on the steering tie rod force. In order to accurately obtain the force extremes of the vehicle’s steering tie rods under bad road conditions, each condition was collected five times. As shown in Fig. 5, the time domain curve of the steering rod under a certain bad road condition was tested at the Yancheng Test Site in China.
Table 2 present the steering tie rod force test data for Belgian Road, respectively. Based on data in the table, it can be seen that the left and right steering tie rods in the five kinds of bad road conditions are basically the same size. 26-inch pit conditions vehicle steering tie rods are subjected to the greatest force, the maximum tension is 14816 N, and the maximum pressure is 12947 N. The minimum force is applied to the steering tie rod for the railroad junction condition, with a maximum tension of 5861 N and a maximum pressure of 6238 N. The results of the Belgian, shortwave, and vibratory road steering tie rod forces are between the railroad junction condition and the 26-inch pit condition.
The data also indicates that the maximum pressure value of the steering tie rod is greater than the value of the steering tie rod pull force for the three conditions of railroad intersection, short wave road and vibration road. The steering tie rods are subjected to greater pressure, and the maximum pressure on the steering tie rods of the short wave road is 37.86 % greater than the maximum tension. The maximum pressure of the vibration road steering tie rod is 42.43 % greater than the maximum tension.
Table 2Steering tie rod extreme values for Belgian road conditions
Test No. | L/N | R/N | ||||
Max | Min | Mean | Max | Min | Mean | |
1 | 8452 | –7776 | 263 | 8169 | –7847 | 282 |
2 | 8861 | –8016 | 197 | 8674 | –7651 | 263 |
3 | 8534 | –7564 | 258 | 9010 | –7369 | 148 |
4 | 8761 | –7961 | 173 | 8364 | –8204 | 219 |
5 | 8694 | –7631 | 217 | 8461 | –7843 | 177 |
Extremum | 8861 | –8016 | 263 | 9010 | 8202 | 282 |
Average Value | 8660 | –7790 | 221.6 | 8536 | –7783 | 217.8 |
Fig. 5Time domain curve of steering tie rod test for a bad road condition
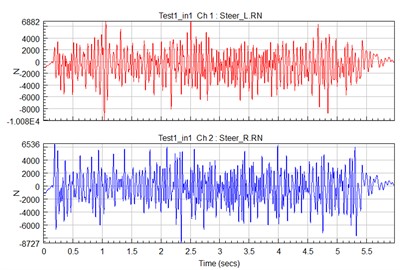
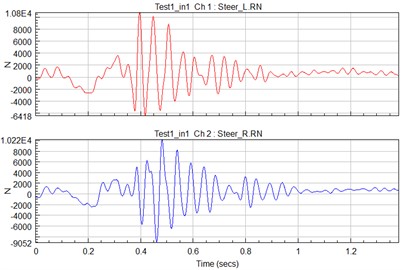
Fig. 6Time domain curve of steering tie rod test for abuse condition 1
3.2. Abusive work conditions
The strength test conditions are mainly collected from five types of vehicle impact abuse conditions that significantly affect the steering tie rod force. Each condition was collected five times. As shown in Fig. 6, the time-domain curve of the steering tie rod test for abusive condition 1 is shown.
The steering tie rod force test data under working conditions are shown in Table 3. It can be seen from the test data that the pressure and tension loads on the steering tie rods are maximum at abused condition 5 under both bad road conditions and abused conditions. The maximum pressure load was 32043 N and the maximum tension load was 26482 N.
Table 3Steering tie rod extreme values for abuse condition 1
Test No. | L/N | R/N | ||||
Max | Min | Mean | Max | Min | Mean | |
1 | 10824 | –6418 | 358 | 10223 | –9052 | 412 |
2 | 12435 | –7314 | 374 | 11067 | –8315 | 408 |
3 | 11067 | –6943 | 381 | 12649 | –6947 | 351 |
4 | 10264 | –6672 | 315 | 12137 | –7368 | 383 |
5 | 11483 | –7873 | 406 | 10167 | –7649 | 326 |
Extremum | 12435 | –7873 | 406 | 12649 | –9052 | 412 |
Average Value | 11215 | –7044 | 366.8 | 11249 | –7866 | 376 |
4. Simulation and bench strength test analysis
4.1. Simulation analysis for steering tie rod bending failure
This paper presents the bending strength simulation of the steering tie rod for two parameters with minimum diameters of 13.8 mm and 14 mm.
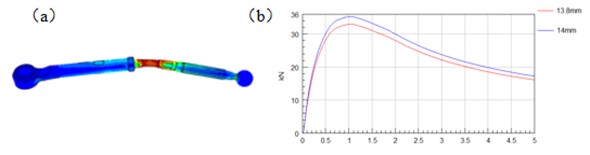
In the simulation, both ends of the steering tie rods are set up as hinged connections. Pressure is applied to the steering tie rods along the center line of the hinges. The bending deformation of the steering tie rods in the pressure state stage as shown in Fig. 7(a).
Fig. 7(b) shows the simulated bending force and displacement curves of the steering tie rods. The bending force of the steering tie rods with diameters of 13.8 mm and 14 mm are 32.9 kN and 35.8 kN respectively. The simulation results are basically consistent with the theoretical calculation results in section 1.3.
Fig. 7Steering tie rod bending force of: a) stress distribution and b) displacement curve
4.2. Steering tie rod bending failure test analysis
Five sets of compression bending failure tests were conducted on steering tie rods with diameters of 13.8 mm and 14 mm, respectively. The loading mode of the steering tie rods during the test is shown in Fig. 8(a). Fig. 8(b) shows the failure state of the steering tie rods after the test.
Table 4 shows steering tie rod bending test results. By statistically analyzing Table 4 data, 13.8 mm diameter and 14 mm diameter steering tie rod life probability distribution can be obtained. Table 5 show the life probability of the 13.8mm diameter steering tie rod. The data points out that the median pressure endured by the 13.8 mm diameter steering tie rod is 32.95 kN, which is relatively consistent with the theoretically calculated values and simulation results. However, the B10 life of the part at the lower 95 % confidence limit is 28.9 kN, which does not satisfy the strength requirement of a maximum load of 32.043 kN for abusive service pressures.
Fig. 8Steering tie rod buckling strength bench tests of: a) during the experiment and b) after the experiment
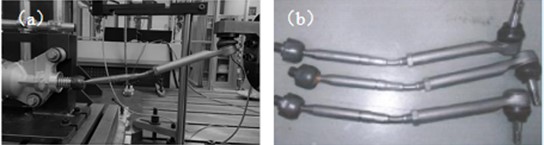
Table 6 shows the life probability of the 14 mm diameter steering tie rod. The data indicates that the median pressure on the 14 mm diameter steering tie rod is 37.65 kN, which is in agreement with the theoretically calculated values and the simulation results. The B10 life of the component at the lower 95 % confidence limit is 33.37 kN, which meets the strength requirement of the maximum load of 32.043 kN for abusive working condition pressure. The test results suggest that the B10 life of the parts is different from the results obtained from the simulation calculations. Therefore, it is necessary to consider the effect of production process differences on part quality during part design.
Table 4Steering tie rod buckling test results
Test No. | 13.8 mm/kN | 14 mm/kN |
1 | 32.41 | 36.70 |
2 | 33.50 | 35.42 |
3 | 32.15 | 37.12 |
4 | 31.31 | 38.64 |
5 | 34.60 | 39.37 |
Average value | 32.79 | 37.45 |
Table 5Probability distribution of 13.8 mm diameter steering tie rods
Percentage | Percentile | Standard error | Lower limit | Upper limite |
1 | 28.5954 | 1.70415 | 25.443 | 32.1384 |
5 | 30.201 | 1.26564 | 27.8195 | 32.7863 |
10 | 30.9384 | 1.0638 | 28.9221 | 33.0953 |
50 | 32.9548 | 0.585018 | 31.8279 | 34.1216 |
90 | 34.3078 | 0.533533 | 33.2779 | 35.3696 |
95 | 34.6117 | 0.574636 | 33.5036 | 35.7565 |
99 | 35.1141 | 0.674918 | 33.8159 | 36.4622 |
Table 6Probability distribution of diameter 14 mm steering tie rods
Percentage | Percentile | Standard error | Lower limit | Upper limit |
1 | 32.6737 | 2.00557 | 29.5359 | 36.1448 |
5 | 34.5088 | 1.48299 | 32.1537 | 37.0364 |
10 | 35.3518 | 1.24202 | 33.3667 | 37.4549 |
50 | 37.6565 | 0.668917 | 36.5721 | 38.773 |
90 | 39.2031 | 0.615409 | 38.2038 | 40.2285 |
95 | 39.5504 | 0.66768 | 38.4673 | 40.6641 |
99 | 40.124.7 | 0.791967 | 38.843 | 41.4488 |
5. Conclusions
This paper analyzes the steering tie rod compression bending load strength of a new energy off-road vehicle by theoretical calculation, simulation and test. The steering tie rod force load characteristics under bad road conditions and abusive conditions in the real vehicle test are analyzed as well. The analysis results are as follows:
1) The strength of steering tie rod compression bending load was analyzed by theoretical calculation, simulation and test, and the theoretical calculated value, simulation value and median test load were obtained to be in good agreement.
2) The real-vehicle road spectrum acquisition obtains the steering tie rod in the abusive conditions of the steering tie rod pressure maximum load of 32043 N, the tension maximum load of 26482 N. The pressure maximum extreme value is 1.21 times of the tension maximum extreme value, and the failure of the steering tie rod is mainly manifested as the pressure bending failure.
References
-
D. W. Ding, X. D. Xu, G. F. Jiang, and Y. L. Zhang, “Fracture failure analysis of an automobile steering tie rod,” Failure Analysis and Prevention, No. 4, pp. 28–32, 2008.
-
Y. R. Li, X. L. Yang, and X. S. Ding, “Failure analysis of a vehicle steering tie – rod,” in Proceedings of the Annual Meeting of the Chinese Society of Automotive Engineers, Vol. 4, pp. 47–50, 2015.
-
G. Jiang, Y. Zhang, X. Xu, and D. Ding, “Stability and failure analysis of steering tie-rod,” in International Conference on Experimental Mechnics 2008 and Seventh Asian Conference on Experimental Mechanics, Vol. 7375, pp. 775–781, Nov. 2008, https://doi.org/10.1117/12.839249
-
L. L. Lu, J. J. Feng, W. C. Huang, and X. F. Peng, “Failure analysis of automobile steering tie rod,” Failure Analysis and Prevention, Vol. 6, No. 4, pp. 253–256, 2011.
-
W. J. Zhang, “Research on vehicle track rod’s load measurement in SAIC Volkswagen proving ground,” Shanghai Auto, No. 5, pp. 57–62, 2019.
-
Z. Yang and H. J. Geng, “Analysis of instablity bending deformation of a commercial vehicle steering straight rod,” Auto Sci-Tech, No. 1, pp. 86–90, 2020.
-
J. Z. He, W. C. Huang, L. H. Yang, and Y. Zhang, “Fracture failure analysis of automobiles the ring tie-rod (in Chinese),” (in Chinese), in National Academic Conference on Failure Analysis, pp. 61–64, 2015.
-
K. F. Huang, “2014 Changan ford yihu electric power steering failure,” (in Chinese), Auto Maintenance, No. 2, pp. 57–58, 2017.
-
Z. B. Ji, B. Z. Jian, and J. J. Sun, “Fracture analysis and optimization design of steering tie rod 42CrMo,” Forging and Stamping Technology, Vol. 40, No. 12, pp. 136–140, 2015, https://doi.org/10.13330/j.issn.1000-3940.2015.12.026
-
Y. Chen, “Simulation analysis on ultimate strength of steering tie rod,” Automobile Parts, No. 3, pp. 31–35, 2016, https://doi.org/10.19466/j.cnki.1674-1986.2016.03.012
-
Z. W. Xu, “Discussion on the optimal design of the inner tie rod structure of the steering gear (in Chinese),” (in Chinese), Internal Combustion Engine and Parts, No. 14, pp. 4–5, 2019, https://doi.org/10.19475/j.cnki.issn1674-957x.2019.14.003
-
J. P. Han, R. J. Zhang, Y. X. Zhang, and D. R. Tan, “Experimental study on tire pressure’s influence on steering tie rod,” Journal of Chongqing Jiaotong University (Natural Science), Vol. 34, No. 1, pp. 149–151, 2019.
About this article

The authors have not disclosed any funding.
The datasets generated during and/or analyzed during the current study are available from the corresponding author on reasonable request.
The authors declare that they have no conflict of interest.
