Abstract
Service performance evaluation is of great significance to the safety, durability, and reliability of bridge engineering. Over the last decade, structural health monitoring (SHM) systems have been widely used for condition monitoring of cable-stayed bridges, massive monitoring data are measured and stored by the sensing subsystems, which provides the basis for service performance evaluation of bridge engineering. Meanwhile, the load test is a common method to assess the construction and service performance of bridges. Combined the SHM systems and a load test of a thousand-meter level cable-stayed bridge after ten years of service, this paper investigates the operating conditions of main structures, including bridge towers, main girders, and steel cables. 52 trucks were used to conduct a quasi-static load on three key sections of bridges. Meanwhile, the GPS displacement of towers and main girders, stress of the main girders and acceleration responses of cables were measured synchronously by the SHM systems. Based on the health monitoring data, the dynamic responses, structural deformation, and cable tension of the bridge were investigated and evaluated by comparing with the finite element (FE) model load test at construction stage. The results show that the service performance of the bridge is basically within the designed conditions.
1. Introduction
Cable-stayed bridges have been widely utilized in many long-span bridges as the main structural form due to their significant advantages, e.g., low costs, superior spanning capabilities and attractive appearance [1]. With the development of design theory and advanced high strength materials, the modern constructive techniques of cable-stayed bridges have made great breakthroughs since 1950s. The span of cable-stayed bridges increases gradually from hundreds-meter level to thousands-meter level, e.g., Strömsundd Bridge (1952, 183 m), Knie Bridge (1969, 320 m), Normandy Bridge (1995, 856 m) and Sutong Bridge (2004, 1088 m) [2]. However, the structural flexibility of cable-stayed bridges increases synchronously as the span. The bridges are more sensitive to the environment and traffic loads. Meanwhile, many long-span cable-stayed bridges have been built in mainland China since the 1990s. These bridges have been in service for about 10-20 years. With the growth of the service time, the structural materials inevitably suffer from damage, including fatigue failure of expansion joint [3], cracks on concrete towers and piers [4], crack propagation in steel structures [5] and corrosion of cable wires [6]. The deterioration of material and structural performance brings potential risks to systemic safety and may cause serious accidents, especially under extreme weather or earthquakes [7]. Therefore, service performance evaluation is of great significance to the safety, durability, and reliability of bridge engineering [8]-[10].
To address this problem, structural health monitoring (SHM) systems have been used for condition monitoring and service performance evaluation of cable-stayed bridges [11]-[14]. The advanced sensing techniques and equipment can real-time measure the operating data of physical field, environmental field, and chemical field, including the wind speed, temperature, dynamic responses, corrosion and stress, etc. Moreover, the SHM systems can comprehensively assess the measured data based on the structural health evaluation subsystems. The monitoring data of dynamic responses, structural deformation and bearing capacity are utilized for construction control, operation condition monitoring, performance evaluation and accident analysis [15]-[17]. For example, the dynamic responses of main girders are investigated to show the influence of typhoons [18], [19] or traffic-induced vibration [20] based on the health monitoring systems. A finite element (FE) model updating method is proposed to show the stress distribution and concentration of the bridge tower based on field monitoring results [21]. The tension of cables can be identified based on the measured monitoring acceleration responses [22]-[24].
Currently, the above cases focus on investigating the operating conditions of a sub-structure. For long-span cable-stayed bridges, each sub-structure should cooperate to ensure that the bridge is in a dynamic balance state. The overall performance of bridges needs a comprehensive evaluation combined with various monitoring data under the most unfavorable operation conditions [25]. For this purpose, load tests are usually carried out to investigate the bridge behavior under some unfavorable operation conditions [26]-[27]. In particular, a static load test was investigated on the Kao-Ping-Hsi cable-stayed Bridge. The structural deflections and flexural strains of the prestressed concrete girder and the variations of the cable tensions were measured and used to assess the bridge with the design specifications [28]. A static and dynamic field load testing was carried out on the Nissibi cable-stayed Bridge to measure the modal parameters of the deck, pylons and cables [29].
The above loads are usually conducted before the bridge opens. The operating conditions after long-term service are more important to ensure the safety of bridges. In this study, the overall performance of the long-span cable-stayed bridge is evaluated by using the health monitoring data measured in the load test after ten years of service. The displacement, stress and cable tension of the experimental bridge are investigated based on the SHM systems. Afterward, the operating conditions of main structures, including bridge towers, main girders and cables, are evaluated compared with the historical data and FE model results.
The rest section of the paper is organized as follows. Section 2 briefly introduces the basic information and the structural health monitoring systems of the experimental bridge, the Sutong Bridge. Section 3 shows the implementation procedure of a load test and investigates the monitoring data of displacement, stress and cable tension. Section 4 discusses the operating conditions of the bridge by comparing the health monitoring data with the historical data and numerical results. Section 5 concludes and remarks on this study.
2. Brief introduction of experimental bridge
2.1. Sutong cable-stayed Bridge
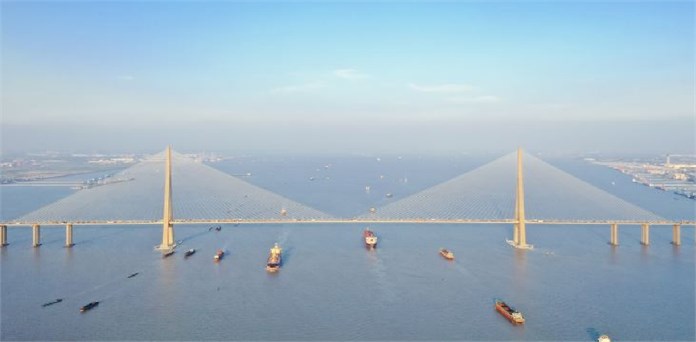
The Sutong Bridge, a double tower cable-stayed bridge spanning the Yangtze River, was constructed, and completed in 2003 and 2008. The main bridge consists of seven sections with lengths of 100 m+100 m+300 m+1088 m+300 m+100 m+100 m, as shown in Fig. 1. The Sutong Bridge is an important part of the Shenyang-Haikou expressway, connecting two cities, Suzhou and Nantong, in Jiangsu province [30]. The Sutong Bridge is an important milestone in the bridge construction history of China. It broke four world records at that time, the longest main span made by orthotropic steel box girder with the length of 1088 m, the tallest bridge tower made by concrete and steel anchor box with the height of 300.04 m, the longest cable made by high strength steel wires with the length of 577 m and the deepest bridge foundations with the maximum buried depth of 40 m [31].
Fig. 1Sutong cable-stayed Bridge
2.2. SHM systems of Sutong Bridge
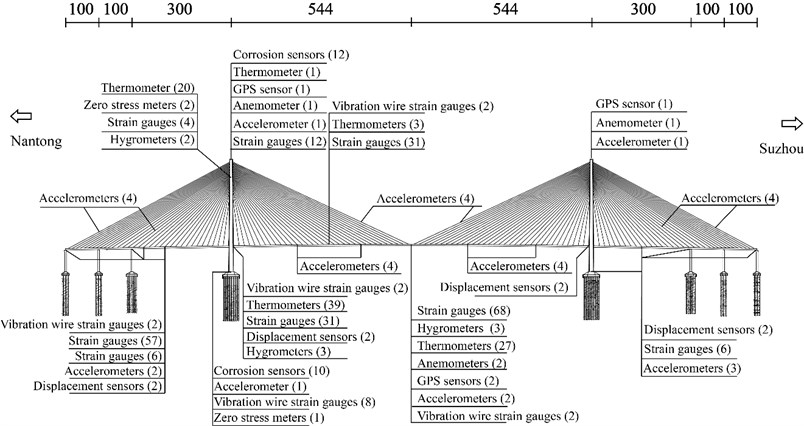
The SHM systems have been designed and installed on the Sutong Bridge for condition monitoring and performance evaluation, as shown in Fig. 2. The systems consist of four main subsystems, sensing subsystems, data acquisition and transmission subsystems, data management and control subsystems, and structural health evaluation subsystems [32]. Based on the sensing subsystems, the experimental parameters, structural dynamic responses and deformation can be real-time measured, including temperature, wind characteristics, GPS displacement, acceleration, strain, corrosion, cable tension, etc. The health monitoring data can provide support for further evaluation of the operational performance of the bridge.
Fig. 2Structural health monitoring systems of Sutong Bridge
3. Benchmark quasi-static load test
A load test was carried out on the bridge to assess the operating conditions of bridges under three designed loading cases.
3.1. Experimental set-up
The Sutong Bridge has been in service for more than ten years since it was built in 2008. For diagnosis and performance evaluation purposes, a load test was conducted on the bridge in enclosed conditions from 0:00 to 5:00 am on Feb. 27, 2018. Several trucks full of sand and stones were utilized as the loaded vehicle, as shown in Fig. 3. The weight of each truck is 30 tons with an error ±1 ton. The loads were applied to the maximum deflection and bending moment section in the main span and south border span. Then, the dynamic responses and structural deformation were measured to show the operating conditions of the bridge.
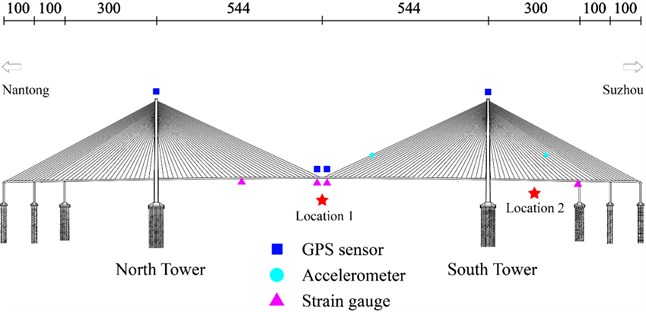
The sensing subsystems of SHM systems were used to collect the dynamic response and structural deformation data. The GPS displacement of towers and the main girder, stress of steel structures and the acceleration of cables were measured in the field experiment. The installation positions of GPS sensors, strain gauge and accelerometers are shown in Fig. 4, respectively. The sampling frequencies of the data acquisition system are 1 Hz, 10 Hz and 20 Hz for three types of sensors, respectively.
Fig. 3Experimental trucks full of sand and stones

Fig. 4Sensor arrangement and loading cases
According to the Chinese industry-standard, Load Test Methods for Highway Bridges JTG/T J21-01-2015, the loading value in the experiment is determined by the loading efficiency , which is defined as:
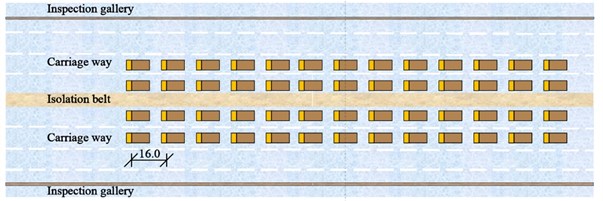
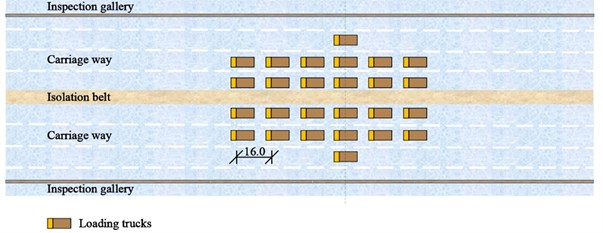
where is the maximum value of stress or displacement of loading section under static loads. is the most unfavorable effect value of stress or displacement of loading section. is the impact coefficient that can be determined by the industry-standard. Three loading cases were designed to measure the operating conditions of the bridge, as shown in Table 1. Firstly, 24 trucks moved from the North Tower to the mid-section of the main span (Location 1) from 2:10 to 2:15, as remarked with the pentagram in Fig. 4; Secondly, another 28 trucks had added to the queue of loading vehicles. All 54 trucks stopped at the same location at the mid-section of the main span from 2:35 to 2:50. Finally, 26 trucks moved forward from the main span to the mid-section of the border span (Location 2) from 3:15 to 3:30. The other trucks still stopped in the mid-section of the main span. The layout of trucks in three loading cases is shown in Fig. 5(a) to (c), respectively. The distance of each truck is 16 meters.
Table 1Loading cases in the field experiment.
No. | Loading time | Loading location | Number of trucks | Loading efficiency |
Case 1 | 2:10 to 2:15 | Mid-section of main span (Location 1) | 24 | 0.88 |
Case 2 | 2:35 to 2:50 | Mid- section of main span (Location 1) | 52 | 0.86 |
Case 3 | 3:15 to 3:30 | Mid-section of border span (Location 2) | 26 | 0.85 |
Fig. 5Layout of trucks in three loading cases: a) case 1, b) case 2 and c) case 3
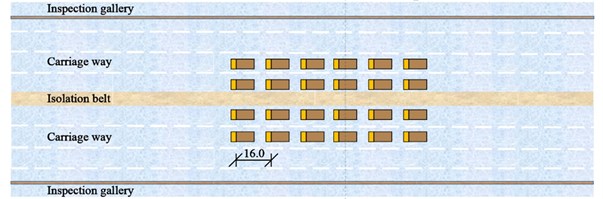
a)
b)
c)
3.2. Data measurement and evaluation
3.2.1. GPS displacement of towers and girders
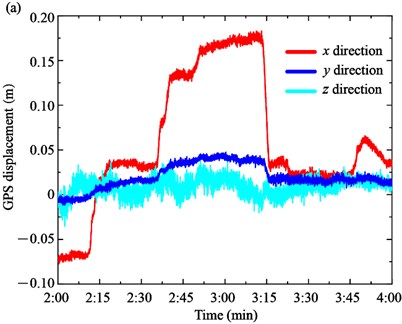
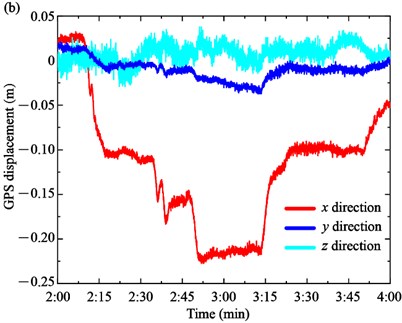
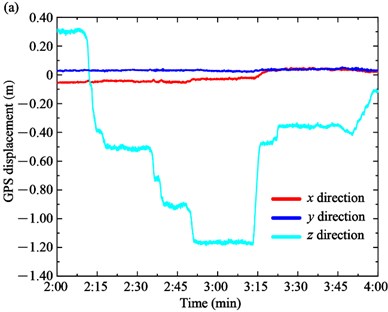
Generally, the GPS displacement is affected by the temperature, traffic loads or wind loads. During the load test, the change of 10 min average wind speed and the temperature was relatively small. Therefore, the GPS displacement was mainly influenced by the loading trucks. Based on the GPS sensors installed on the top of the towers and the mid-section of the main span, the GPS displacements of the towers and main girders were measured, as shown in Fig. 6. The GPS displacements of longitudinal direction , transversal direction and vertical direction are remarked by the red, blue and cyan colors, respectively. The positive value of , , and represents the north, east and up direction, respectively.
The GPS displacements of the South Tower and North Tower are shown in Fig. 6(a) and (b), respectively. On the one hand, the displacement form of towers and girder are different in the load tests. In particular, the longitudinal displacement of the towers is the main displacement form, while the transversal displacement and vertical displacement are very small and close to 0. For the South Tower, the longitudinal displacement increases from –0.075 m to 0.041 m at Case 1 and 0.041 m to 0.181 m at Case 2, respectively. In Case 3, the longitudinal displacement decreases to about 0.025 m. The GPS displacement of the North Tower presents the opposite trend compared with the South Tower due to the bridge towers deflecting towards the mid-span side under the traffic loads. The longitudinal displacement decreases from 0.027 m to –0.108 m in Case 1 and –0.108 m to –0.219 m in Case 2, while it increases from –0.219 m to –0.097 m in Case 3.
Fig. 6GPS displacement of the towers and the main girder: a) South tower, b) North tower
On the other hand, the displacements of the main girder on upstream and downstream sides are shown in Fig. 7(a) and (b), respectively. The vertical displacement is the main displacement form of the girder. The displacement of the upstream and downstream sides is similar because the loading trucks are symmetrically distributed along the longitudinal direction of the main girder. For example, the vertical displacement of the upstream side decreases from 0.303 m to –0.511 m in Case 1 and from –0.511 m to –1.195 m in Case 2. In Case 3, the vertical displacement increases to –0.397 m when the trucks move from the main span to the border span. Meanwhile, the longitudinal displacement and transversal displacement of the main girder are very small and close to 0. For the downstream side, the vertical displacement of the upstream side decreases from 0.302 m to –0.521 m in Case 1 and from –0.521 m to –1.195 m in Case 2. In Case 3, the vertical displacement increases to –0.401 m.
Fig. 7GPS displacement of the main girder: a) upstream side, b) downstream side

3.2.2. Stress of steel girders
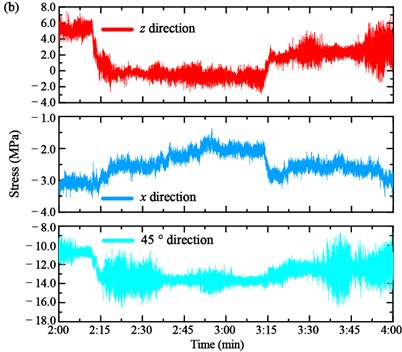
The strain was measured by the strain gauge installed on each section of the main girders. Four strain gauges are utilized to measure the strain and then calculate the stress by the constitutive relation, as shown in Fig. 4. The vertical stress , transversal stress and 45° direction stress of the anchorage zone of the Cables SA18 and NJ18 are shown in Fig. 8(a) and (b), respectively.
For the stress of the anchorage zone of the Cable SA18, it is easy to distinguish the loading process of three Case 3. The variation of the vertical stress and transversal stress are similar. In particular, the vertical stress of the anchorage zone of the Cable SA18 decreases from –4.394 MPa to –4.744 MPa in Case 1 and continues to reduce to –5.250 MPa in Case 2. Then, it increases to –4.391 MPa in Case 3. Similarly, the transversal stress decreases from –13.832 MPa to –14.115 MPa in Case 1, then decreases to –14.512 MPa in Case 2 and increases to about –13.601 MPa in Case 3. The 45° direction stress shows an adverse trend. It increases from –7.251 MPa to –6.995 MPa in Case 1, –6.995 MPa to –6.473 MPa in Case 2 and decreases to –7.758 MPa in Case 3. Moreover, the stress of the anchorage zone of the Cable NJ18 is shown in Fig. 8(b). When the loaded trucks pass through the bottom of the cable, the stress fluctuates greatly, but the amplitude change is small, especially for the vertical stress z and 45° direction stress. The transversal stress is the main deformation form of the bearing girder. It decreases from 2.285 MPa to 2.159 MPa in Case 1, 2.159 MPa to 1.932 MPa in Case 2 and increases to 2.237 MPa in Case 3. It should be noted that the stress instantaneous increases when the loading trucks pass through the measured region.
Fig. 8Stress of the anchorage zone of cables: a) cable SA18 and b) cable NJ18
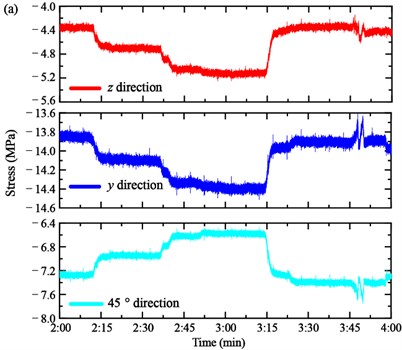
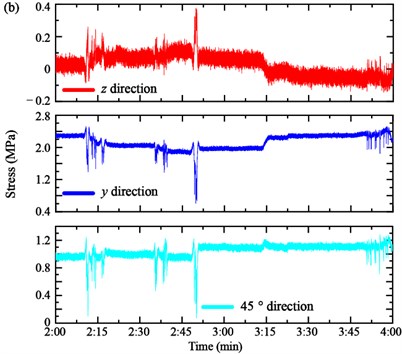
In Case 1 and Case 2, the loading trucks stopped in the mid-section of the main span. The tower tilted to the middle section. Thus, the stress of the anchorage zone in the border span is more obvious than the anchorage zone in the main span. In Case 3, the trucks moved to the border span. Therefore, the stress of the Cable SA18 decreases to the initial value. Meanwhile, it can be seen from the figures that the stress of the anchorage zone of the Cable SA18 presents a more significant change than Cable NJ18 in the first two loading cases.
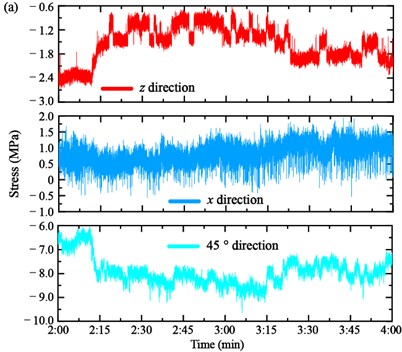
Moreover, the vertical stress , longitudinal stress and 45° direction stress of the joint point and diaphragm of the mid-span girder are shown in Fig. 9(a) and (b), respectively. The vertical stress changed when the trucks moved to the mid-section of the main span in Case 1, kept constant in Case 2, and restored the initial state in Case 3. The change of the longitudinal stress was not obvious in the joint point of the Cable NJ34 and mid-span but presented a notable change in the diaphragm of the mid-span. The 45° direction stress variation shows an adverse and same as the direction in the two measured regions, respectively.
Fig. 9Stress of the mid-span girder: a) joint point of the Cable NJ34 and mid-span girder and b) diaphragm of the mid-span girder
3.2.3. Cable tensions
Different from GPS displacement and stress, the cable tension is a mechanical parameter that needs to be tested indirectly. The cable tension of the bridges was measured by the vibration-based method. In particular, two accelerometers installed on the cables were used to measure the acceleration responses. Afterward, the tension is identified by the vibration frequency. In practical application, the string theory is generally used to calculate cable tension from the measured frequency:
where , , , are mass per unit length, cable length, the frequency of the -th order and cable tension, respectively. represents the positive integer. Once the frequency is identified from the dynamic responses, the tension can be calculated by Eq. (2). However, to keep the high-frequency resolution, a long sampling time is needed to extract the frequency with high resolution. The traditional frequency-based method is difficult to identify the time-varying tension of cables.
To address this problem, the algorithm of Synchro-squeezing Wave-Packet Transform (SWPT) is used in this study to identify the time-varying tension from the acceleration responses [33]. Firstly, the 1D wave packet transform is defined by:
where is the wave packet parameter. is the 1D WPT of acceleration responses. The variables and are the scale and translation parameters of the wave packet transform, respectively. Then, the synchro-squeezing operator is utilized for the acceleration responses to extract the time-varying instantaneous frequency:
where represents the real part of the function and is the impulse response function. The parameter can be calculated by:
The time-varying instantaneous can be extracted from the SWPT coefficient spectrum . An integral operator reconstructs the time-frequency information to represent the instantaneous frequency of signals. Afterward, the time-varying tension can be calculated by the identified instantaneous frequency.
The flow of the algorithm is shown as follows.
Step 1: Measure the acceleration response of cables,
Step 2: Calculate the SWPT coefficient spectrum from the acceleration responses,
Step 3: Extract the time-varying instantaneous frequency from the SWPT coefficient spectrum,
Step 4: Calculate the time-varying instantaneous cable tension based on the instantaneous frequency by Eq. (2).
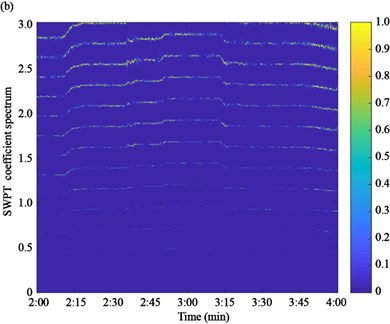
Based on the proposed algorithm, the acceleration responses of the two experimental cables are firstly measured by the accelerometers, as shown in Fig. 10. Then, the acceleration response is used to calculate the SWPT coefficient spectrum by Eq. (5), as shown in Fig. 11. The instantaneous frequencies can be estimated based on the time-frequency spectrum.
Fig. 10Acceleration responses of cables: a) Cable SA18, b) Cable SJ34
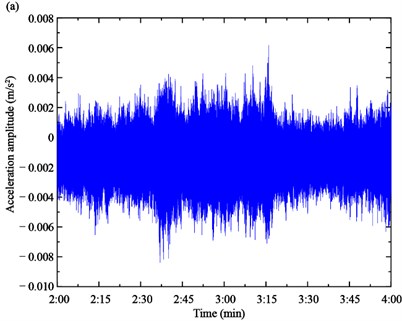
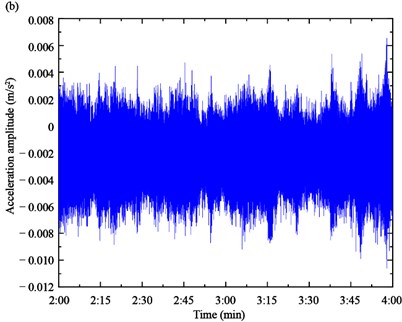
Fig. 11SWPT coefficient spectrum of acceleration responses: a) cable SA18, b) cable SJ34

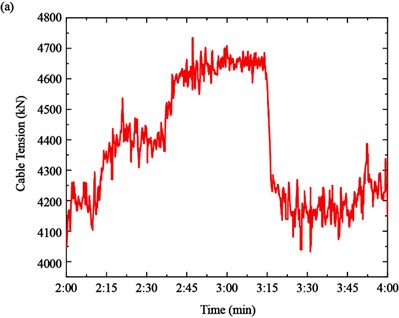
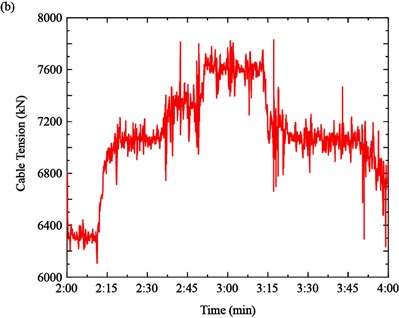
Finally, the cable tension is identified based on the time-varying instantaneous frequency by the function of Eq. (2), as shown in Fig. 12. It can be seen from Fig. 12(a) that the tension of Cable SA18 increased from the 4200 kN to 4400 kN in Case 1, 4400 kN to 4650 kN in Case 2 and decreased from 4650 kN to 4150 kN in Case 3, respectively. The tension of the Cable SJ34 increased from the 6350 kN to 7100 kN in Case 1, 7100 kN to 7600 kN in Case 2 and decreased from 7600 kN to7100 kN in Case 3, respectively.
Fig. 12Time-varying cable tension: a) cable SA18, b) cable SJ34
4. Service performance evaluation
4.1. Tower structures
From the health monitoring data, the GPS displacements of the South Tower and North Tower are shown in Fig. 6 (a) and (b), respectively. For the purpose of service performance evaluation, the displacement results of the load test at the construction stage and the FE model are used to assess the operating conditions of tower structures, as shown in Table 2. The load test at the construction stage was conducted ten years ago when the bridge was built [34]. The loading trucks are the same as the load test of the first two cases. Meanwhile, the FE model was also established in the construction stage to calculate the deformation of main structures.
The displacements of towers at the operation stage are close to the load test results at the construction stage and the FE model. The error may be caused by the position and weight of the loaded trucks. Therefore, the operating condition of the tower structures is relatively normal under the quasi-static loads.
Table 2GPS displacement of tower structures
Location | No. | Load test at the construction stage (m) | Load test at the operation stage (m) | FE model (m) |
South Tower | Case 1 | 0.106 | 0.041 | 0.108 |
Case 2 | 0.191 | 0.181 | 0.218 | |
North Tower | Case 1 | –0.087 | –0.108 | –0.108 |
Case 2 | –0.211 | –0.219 | –0.218 |
4.2. Main girders
The displacements of main girders are firstly compared with the load test at the construction stage and the FE model, as shown in Table 3. The displacement of the upstream and downstream sides is similar because the loading trucks are symmetrically distributed along the longitudinal symmetry axis of the bridge. The displacement of load test at the operation stage is close to the load test at the construction stage and the FE model with a small error.
Table 3GPS displacement of main girders
Location | No. | Load test at the construction stage (m) | Load test at the operation stage (m) | FE model (m) |
Upstream side | Case 1 | –0.668 | –0.511 | –0.735 |
Case 2 | –1.368 | –1.195 | –1.476 | |
Downstream side | Case 1 | –0.698 | –0.521 | –0.735 |
Case 2 | –1.385 | –1.195 | –1.476 |
Table 4Stress of main girders
Location | Direction | Maximum stress of the load test (MPa) | Minimum stress of the load test (MPa) | Maximum stress of 2014 (MPa) | Minimum stress of 2014 (MPa) |
Anchorage zone of the Cable SA 18 | -direction | –4.14 | –5.25 | 7.59 | –16.13 |
-direction | –13.60 | –14.51 | 13.80 | –12.98 | |
45-direction | –6.47 | –7.76 | 9.75 | –18.41 | |
Anchorage zone of the Cable NJ 18 | -direction | 0.38 | –0.17 | 25.57 | –16.15 |
-direction | 2.44 | 0.59 | –2.81 | –5.28 | |
45-direction | 1.28 | 0.08 | 8.55 | –12.02 | |
Joint point of the NJ34 and mid-span girder | -direction | –0.59 | –2.69 | 2.39 | –10.80 |
-direction | 1.94 | –0.56 | 17.16 | –5.87 | |
45-direction | –6.05 | –9.64 | 0.88 | –2.04 | |
Diaphragm of the mid-span girder | -direction | 7.25 | –2.93 | 18.79 | –12.12 |
-direction | –1.49 | –3.52 | 23.16 | –26.09 | |
45-direction | –8.45 | –16.39 | 16.83 | –16.42 |
To assess the stress of the main girder, the maximum and minimum stress measured in 2014 are taken as a basic reference, as shown in Table 4. The stress is basically within the region between the maximum and minimum of 2014 with a few exceptions, including the y-direction of the SA 18 and the anchorage zone of the Cable NJ 18 and the 45° direction of the joint point of the NJ34 and mid-span girder. The error is very small and within ±5 MPa. Therefore, the stress of the main girder is within the controllable range, and its deformation does not change significantly compared with the monitoring data. The operating conditions of the main girder are relatively healthy.
4.3. Cable structures
To assess the operating conditions of cables, two important indexes, the initial tension and 40 % ultimate bearing capacity, are introduced to show the initial conditions and tension, respectively. The initial tension is measured when the bridge was firstly built in 2008, reflecting the tension after the construction stage. The 40 % ultimate bearing capacity is the design limit value in the operating stage to ensure that the safety factor is less than 2.5. The initial tension and 40 % ultimate bearing capacity of the Cable SA18 and SJ34 are 4179 kN, 5732 kN, 6288 kN, and 8046 kN, respectively.
Fig. 13Service performance evaluation of cables: a) cable SA18, b) cable SJ34
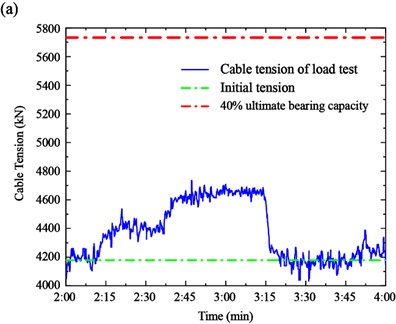
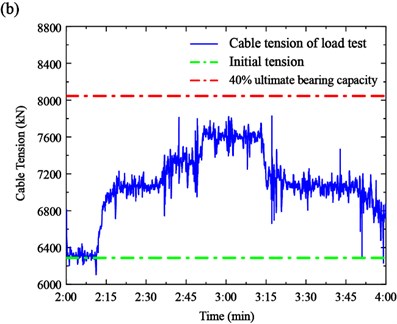
The cable tension and two indexes of the measured cables are shown in Fig. 13. It can be seen from the figures that the tensions of the measured cables are within the normal conditions of the design stage. In particular, there is a large safety tolerance of Cable SA18. However, the tension of Cable SJ34 is close to the 40 % ultimate bearing capacity in Case 2. Therefore, the tensions of the long cables are more sensitive to the loads in the mid-section span.
5. Conclusions
In this paper, a load test was conducted to assess the service performance of a thousand-meter level cable-stayed bridge based on health monitoring data. The GPS displacement, stress and cable tension of the bridges are investigated to show the dynamic responses, structural deformation and cable tension. The health monitoring data is also compared with the load test results ten years ago and the FE model. Based on the discussions of the experimental results, the conclusions can be drawn as follows:
1) The displacements of towers at the operation stage are close to the FE model and construction stage results. The longitudinal displacement x of the towers is the main displacement form, while the transversal displacement y and vertical displacement z are very small and close to 0. The operating condition of the tower structures is relatively normal and the displacement is controlled in the normal area.
2) The vertical displacement is the main displacement form of the girder. Moreover, the displacement of load test at the operation stage is close to the load test at the construction stage and FE model with a small error. The stress is basically within the region of the maximum and minimum of 2014 with a few exceptions. The error is very small and within ±5 MPa.
3) The SWPT algorithm can be used to calculate the time-varying tension. The tension is basically between the initial tension measured in the construction stage and 40 % ultimate bearing capacity of the design value. The tension of the long cables is close to the maximum allowable value.
For future research, the service performance evaluation of bridges should also consider the special working conditions, e.g., typhoons and over-loading conditions to comprehensively show the operating conditions of bridges.
References
-
W. X. Ren, X. L. Peng, and Y. Q. Lin, “Experimental and analytical studies on dynamic characteristics of a large span cable-stayed bridge,” Engineering Structures, Vol. 27, No. 4, pp. 535–548, Mar. 2005, https://doi.org/10.1016/j.engstruct.2004.11.013
-
H. Svensson, Cable-Stayed Bridges: 40 Years of Experience Worldwide. Berlin, Germany: John Wiley & Sons, 2013.
-
C. C. Fu and N. Zhang, “Investigation of bridge expansion joint failure using field strain measurement,” Journal of Performance of Constructed Facilities, Vol. 25, No. 4, pp. 309–316, Aug. 2011, https://doi.org/10.1061/(asce)cf.1943-5509.0000171
-
J. Marson and M. Bruneau, “Cyclic testing of concrete-filled circular steel bridge piers having encased fixed-based detail,” Journal of Bridge Engineering, Vol. 9, No. 1, pp. 14–23, Jan. 2004, https://doi.org/10.1061/(asce)1084-0702(2004)9:1(14)
-
F. Alemdar, D. Nagati, A. Matamoros, C. Bennett, and S. Rolfe, “Repairing distortion-induced fatigue cracks in steel bridge girders using angles-with-plate retrofit technique. I: Physical simulations,” Journal of Structural Engineering, Vol. 140, No. 5, p. 04014003, May 2014, https://doi.org/10.1061/(asce)st.1943-541x.0000876
-
J. Xu and W. Chen, “Behavior of wires in parallel wire stayed cable under general corrosion effects,” Journal of Constructional Steel Research, Vol. 85, pp. 40–47, Jun. 2013, https://doi.org/10.1016/j.jcsr.2013.02.010
-
Y. Ding, A. Li, D. Du, and T. Liu, “Multi-scale damage analysis for a steel box girder of a long-span cable-stayed bridge,” Structure and Infrastructure Engineering, Vol. 6, No. 6, pp. 725–739, Dec. 2010, https://doi.org/10.1080/15732470802187680
-
A. B. Mehrabi, “In-service evaluation of cable-stayed bridges, overview of available methods and findings,” Journal of Bridge Engineering, Vol. 11, No. 6, pp. 716–724, Nov. 2006, https://doi.org/10.1061/(asce)1084-0702(2006)11:6(716)
-
L. Sun, Z. Shang, Y. Xia, S. Bhowmick, and S. Nagarajaiah, “Review of bridge structural health monitoring aided by big data and artificial intelligence: From condition assessment to damage detection,” Journal of Structural Engineering, Vol. 146, No. 5, p. 04020073, May 2020, https://doi.org/10.1061/(asce)st.1943-541x.0002535
-
J. M. Ko, Y. Q. Ni, H. F. Zhou, J. Y. Wang, and X. T. Zhou, “Investigation concerning structural health monitoring of an instrumented cable-stayed bridge,” Structure and Infrastructure Engineering, Vol. 5, No. 6, pp. 497–513, Dec. 2009, https://doi.org/10.1080/15732470701627893
-
H. Li and J. Ou, “The state of the art in structural health monitoring of cable-stayed bridges,” Journal of Civil Structural Health Monitoring, Vol. 6, No. 1, pp. 43–67, Feb. 2016, https://doi.org/10.1007/s13349-015-0115-x
-
S. Jang et al., “Structural health monitoring of a cable-stayed bridge using smart sensor technology: deployment and evaluation,” Smart Structures and Systems, Vol. 6, No. 5_6, pp. 439–459, 2010, https://doi.org/10.12989/sss.2010.6.5_6.439
-
M. Vagnoli, R. Remenyte-Prescott, and J. Andrews, “Railway bridge structural health monitoring and fault detection: State-of-the-art methods and future challenges,” Structural Health Monitoring, Vol. 17, No. 4, pp. 971–1007, Jul. 2018, https://doi.org/10.1177/1475921717721137
-
D. Dan, T. Yang, and J. Gong, “Intelligent platform for model updating in a structural health monitoring system,” Mathematical Problems in Engineering, Vol. 2014, pp. 1–11, 2014, https://doi.org/10.1155/2014/628619
-
Y. L. Xu and Y. Xia, Structural Health Monitoring of Long-Span Suspension Bridges. Boca Raton: CRC Press, 2011.
-
H. Naderpour, A. Ezzodin, A. Kheyroddin, and G. Ghodrati Amiri, “Signal processing based damage detection of concrete bridge piers subjected to consequent excitations,” Journal of Vibroengineering, Vol. 19, No. 3, pp. 2080–2089, May 2017, https://doi.org/10.21595/jve.2015.16474
-
M. M. Alamdari, N. L. Dang Khoa, Y. Wang, B. Samali, and X. Zhu, “A multi-way data analysis approach for structural health monitoring of a cable-stayed bridge,” Structural Health Monitoring, Vol. 18, No. 1, pp. 35–48, Jan. 2019, https://doi.org/10.1177/1475921718790727
-
H. Wang, J. X. Mao, and Z. D. Xu, “Investigation of dynamic properties of a long-span cable-stayed bridge during typhoon events based on structural health monitoring,” Journal of Wind Engineering and Industrial Aerodynamics, Vol. 201, p. 104172, Jun. 2020, https://doi.org/10.1016/j.jweia.2020.104172
-
H. Wang, T. Tao, Y. Gao, and F. Xu, “Measurement of wind effects on a kilometer-level cable-stayed bridge during Typhoon Haikui,” Journal of Structural Engineering, Vol. 144, No. 9, p. 04018142, Sep. 2018, https://doi.org/10.1061/(asce)st.1943-541x.0002138
-
C. Y. Kim, D. S. Jung, N. S. Kim, S. D. Kwon, and M. Q. Feng, “Effect of vehicle weight on natural frequencies of bridges measured from traffic-induced vibration,” Earthquake Engineering and Engineering Vibration, Vol. 2, No. 1, pp. 109–115, Jun. 2003, https://doi.org/10.1007/bf02857543
-
Q. G. Fei, Y. L. Xu, C. L. Ng, K. Y. Wong, W. Y. Chan, and K. L. Man, “Structural health monitoring oriented finite element model of Tsing Ma bridge tower,” International Journal of Structural Stability and Dynamics, Vol. 7, No. 4, pp. 647–668, Dec. 2007, https://doi.org/10.1142/s0219455407002502
-
J. T. Kim, T. C. Huynh, and S. Y. Lee, “Wireless structural health monitoring of stay cables under two consecutive typhoons,” Structural Monitoring and Maintenance, Vol. 1, No. 1, pp. 47–67, 2014, https://doi.org/10.12989/smm.2014.1.1.047
-
X. Zhang, J. Peng, M. Cao, D. Damjanović, and W. Ostachowicz, “Identification of instantaneous tension of bridge cables from dynamic responses: STRICT algorithm and applications,” Mechanical Systems and Signal Processing, Vol. 142, p. 106729, Aug. 2020, https://doi.org/10.1016/j.ymssp.2020.106729
-
M. Cao, S. Hu, X. Zhang, S. Zhang, D. Sumarac, and J. Peng, “Investigation of Time-Varying Cable Tension of Bridges Using Time-Frequency Reassignment Techniques Based on Structural Health Monitoring Data,” Applied Sciences, Vol. 12, No. 8, p. 4008, Apr. 2022, https://doi.org/10.3390/app12084008
-
H. T. Al-Khateeb, H. W. Shenton, M. J. Chajes, and C. Aloupis, “Structural health monitoring of a cable-stayed bridge using regularly conducted diagnostic load tests,” Frontiers in Built Environment, Vol. 5, Mar. 2019, https://doi.org/10.3389/fbuil.2019.00041
-
W. X. Ren, Y. Q. Lin, and X. L. Peng, “Field load tests and numerical analysis of Qingzhou cable-stayed bridge,” Journal of Bridge Engineering, Vol. 12, No. 2, pp. 261–270, Mar. 2007, https://doi.org/10.1061/(asce)1084-0702(2007)12:2(261)
-
X. Wang, L. Wang, H. Wang, Y. Ning, K. Huang, and W. Wang, “Performance evaluation of a long-span cable-stayed bridge using non-destructive field loading tests,” Applied Sciences, Vol. 12, No. 5, p. 2367, Feb. 2022, https://doi.org/10.3390/app12052367
-
I. K. Fang, C. R. Chen, and I. S. Chang, “Field Static Load Test on Kao-Ping-Hsi Cable-Stayed Bridge,” Journal of Bridge Engineering, Vol. 9, No. 6, pp. 531–540, Nov. 2004, https://doi.org/10.1061/(asce)1084-0702(2004)9:6(531)
-
A. Bayraktar, T. Türker, J. Tadla, A. Kurşun, and A. Erdiş, “Static and dynamic field load testing of the long span Nissibi cable-stayed bridge,” Soil Dynamics and Earthquake Engineering, Vol. 94, pp. 136–157, Mar. 2017, https://doi.org/10.1016/j.soildyn.2017.01.019
-
J. Miao, M. Pei, X. Zhang, and R. Xiao, “Global analysis of the SuTong cable-stayed bridge,” Journal of Highway and Transportation Research and Development (English Edition), Vol. 1, No. 1, pp. 51–55, Dec. 2006, https://doi.org/10.1061/jhtrcq.0000143
-
Q. You, P. He, X. Dong, X. Zhang, and S. Wu, “Sutong Bridge – the longest cable-stayed bridge in the world,” Structural Engineering International, Vol. 18, No. 4, pp. 390–395, Nov. 2008, https://doi.org/10.2749/101686608786455298
-
H. Wang, T. Tao, A. Li, and Y. Zhang, “Structural health monitoring system for Sutong cable-stayed bridge,” Smart Structures and Systems, Vol. 18, No. 2, pp. 317–334, 2016, https://doi.org/10.12989/sss.2016.18.2.317
-
X. Zhang, Y. Lu, M. Cao, S. Li, D. Sumarac, and Z. Y. Wang, “Instantaneous identification of tension in bridge cables using synchrosqueezing wave-packet transform of acceleration responses,” Structure and Infrastructure Engineering, Jun. 2022, https://doi.org/10.1080/15732479.2022.2082492
-
Y. B. Li and Q. W. Zhang, “Global mechanical behavior of Sutong Bridge under static loads,” in SPIE Smart Structures and Materials + Nondestructive Evaluation and Health Monitoring, Vol. 7649, pp. 397–406, Mar. 2010, https://doi.org/10.1117/12.847122
About this article

The authors are grateful for the support from the Anhui international joint research center of data diagnosis and smart maintenance on bridge structures (No. 2021AHGHYB04), the Nanjing International Joint Research and Development Program (No. 202112003), and the Nantong Science and Technology Opening Cooperation Project (No. BW2021001).
