Abstract
As the key component to control the driving direction of the vehicle, the steering device always bears large vibration and load. In order to improve structural performance and reduce costs, a multi-objective optimization method based on the results of prestressed modal analysis was proposed, which can achieve significant lightweight and cost-effectiveness improvement. Based on the principle and working characteristics of the steering device, the minimum value of mass, minimum value of maximum stress, maximum value of equivalent stiffness were set as optimization objectives. Through finite element analysis, the prestressed modal module was constructed, and the strength and modal characteristics of the steering device were obtained. In order to verify the accuracy of prestressed modal analysis, the vibration testing experimental platform was built in a non free state. The excitation and response signals can be obtained through sensors and data acquisition devices and used as input and output data. According to the comparative analysis of simulated vibration modes, it can be concluded that the coupling analysis of strength and mode is more in line with actual boundary conditions and has high reliability. The DOE (Design of Experience) method was adopted to construct discrete corresponding values between design variables and optimization objectives based on the results of prestressed modal analysis. In order to better evaluate the cost-effectiveness of lightweight, a comparative analysis was conducted on the results of primary and secondary lightweight. The results show that the prestressed modal analysis method can achieve good dynamic analysis accuracy. Without reducing strength and equivalent stiffness, the mass of the steering device can be reduced by 14 %, achieving high economic benefits.
Highlights
- A multi-objective optimization method based on the results of prestressed modal analysis was proposed, which can achieve significant lightweight and cost-effectiveness improvement.
- Through finite element analysis, the prestressed modal module was constructed, and the strength and modal characteristics of the steering device were obtained.
- The DOE (Design of Experience) method was adopted to construct discrete corresponding values between design variables and optimization objectives based on the results of prestressed modal analysis.
1. Introduction
At present, the design of the vehicle steering device is still based on traditional methods, and the problems such as too high Factor of safety [1] and excessive mass [2] have not been solved, which is not conducive to energy conservation and consumption reduction, leading to material waste. The steering device bears significant loads and vibrations during operation, so its performance needs to be evaluated through strength analysis and modal analysis. Representative research achievements in steering device structure are as follows. Snezana [3] used finite element method to analyze the railway steering device, and compared each working condition and result to determine the load condition and maximum stress position, then improved the bidirectional steering structure. Joo [4] used new structures and materials for the design of the steering device, analyzed the changes in stress, fully considered the strength, vibration characteristics, and fatigue characteristics, and then compared and analyzed the dynamic stiffness of the steering joint based on the design according to material changes. Nitalikar [5] conducted stress analysis on the core components of the steering column, and the research results can reveal the reasons, locations, and degrees of stress on the components in the sub assembly. Zarastvand [6] used the shear deformation shallow shell theory to model the structure as a finite shell, and then carried out wave propagation through a hyperbolic body reinforced by stiffeners. Talebitooti [7] proposed an analytical model based on multi-objective optimization, using the sum of the sound transmission loss and lateral displacement of the structure with weight as two cost functions for optimization in the diffusion field. Talebitooti [8] used non dominated sorting genetic algorithm and first-order shear deformation theory to optimize the sound transmission loss of porous material lined composite cylindrical shells under the action of plane sound waves.
It can be seen that the structural analysis of the steering device mainly focuses on a single strength analysis [9] or modal analysis, without considering the coupling relationship [10] between the two. Considering the influence of prestressing on modal analysis, coupled analysis methods have been applied in the paper, which can significantly improve calculation accuracy and reliability. Based on the results of prestressed modal analysis, a lightweight design method has been proposed. Besides, based on the DOE (Design of Experience) optimization method [11, 12], finite element analysis technology and advanced optimization algorithms have been applied to the structural optimization of steering devices, which can express a more accurate approximation function relationship between optimization objectives and design variables in a local range with less computational complexity. Through the research of this topic, a solution set that meets the requirements of lightweight optimization can be obtained without reducing the structural strength and equivalent stiffness, and resonance can be effectively avoided. This provides an important basis for the optimization design of the structure and has good economic and social benefits. From a technical perspective, with the development of computer and CAE technology, the functions of finite element simulation and numerical calculation software are becoming more and more complete and powerful, able to accurately and efficiently obtain parameter samples of design variables, and efficiently calculate design variables that meet constraint conditions. From an economic perspective, lightweight design can effectively reduce the research and production costs of steering equipment, shorten the research and development cycle, and enhance the market competitiveness and core technical capabilities of products.
2. Simulation and analysis of prestressed mode
2.1. Establishment of finite element model
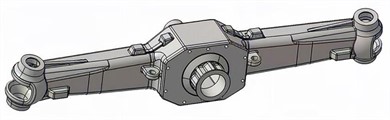
The finite element method, as a numerical simulation method for approximate solutions, can be used to solve boundary value problems of partial differential equations, and the accuracy of its results depends on the reliability of the finite element model. The structure of the steering device is very complex, with many curved surface and hole structure. On the basis of not affecting the actual function, it is necessary to simplify the Geometric modeling. On the one hand, it can ensure computational efficiency. On the other hand, it can improve the quality of meshing and the accuracy of solving. In order to achieve feedback calculation in multi-objective optimization processes, parameterized modeling methods are proposed and applied in this paper. Therefore, Creo 6.0 is used to construct and parameterize the model, with key dimensions that affect quality as input variables. To achieve compatibility with ANSYS parameters, design variables need to be named starting with the letter DS. In parametric modeling, the plasticity of the model needs to be taken into account, so the order of modeling is crucial. Basic features refer to the relevant feature creation operations in the feature modeling function module and free form surface modeling function module provided by the system. Before conducting parameterized modeling, the first step is to analyze the shape of the model. If the model cannot be decomposed into basic geometric elements or is combined through Boolean operations, such a model cannot be parameterized through basic features. When using basic features for parametric modeling, only basic geometric elements such as Rectangular cuboid, cylinder, cone and sphere can be used as main features. Other features cannot be used as main features, but can only generate dependency or reference relationships with them. As shown in Fig. 1, the structures such as oil injection holes, lubrication channels, positioning bolts, and chamfers have been removed from FEA model, which can ensure the reliability of the stress and modal characteristic analysis.
Fig. 1Simplified steering device model
2.2. Preprocessing of the model
If the model is directly imported into ANSYS in intermediate format (iges, etc.), it will result in the loss of parameter information and the inability to update the structural dimensions in real-time. For steering device, it is more convenient to use internal modeling interface of ANSYS to share model data with Creo 6.0, compared with modeling directly in Design Modeler. Mesh partitioning is one of the key factors affecting the efficiency and accuracy of finite element analysis. Due to the large number of complex surface structures in FEA model, if the hexahedron mesh is forced, it is easy to have excessive mesh distortion, resulting in a sharp decline in calculation accuracy. Therefore, an adaptive tetrahedral mesh generation method has been applied to improve the mesh quality by adjusting the mesh size. The resolution level is set to 7, and slow mode is used for transitions between different planes. Then, medium mode is used for the center of the span angle, and the grid is encrypted for stress concentration positions such as hole structure. Through grid optimization, the final number of elements and nodes was 459587 and 1109488, respectively.
Fig. 2Mesh partitioning and optimization results

To ensure the reliability of mesh, the element quality, aspect ratio, Jacobian ratio, skewness, and orthogonal quality were used as evaluation criteria. Element quality refers to the ratio of element volume to side length, with 0 being the worst and 1 being the best, with an acceptable value greater than 0.7. Aspect ratio refers to the ratio of the longest edge to the shortest edge, with a value of 1 being optimal and an acceptable value should less than 5. Jacobian ratio refers to the degree of distortion, with an optimal value of 1 and an acceptable value greater than 0.6. Skewness refers to the difference between the actual node shape and the standard node of an equilateral shape, with values of 0 being the best and 1 being the worst. Orthogonal quality refers to the orthogonality of the grid, with a value of 1 being optimal and 0 being the worst. The validation results are shown in Table 1. It can be seen that mesh partitioning results can effectively ensure the accuracy of simulation calculations. Due to the large vibration load borne by the steering device, cast iron material with good vibration absorption performance is used, and its physical properties are shown in Table 2.
Table 1The validation results of mesh partitioning
Validation metrics | Element quality | Aspect ratio | Jacobian ratio | Skewness | Orthogonal quality |
Parameter value | 0.915 | 1.446 | 0.996 | 0.145 | 0.872 |
Table 2Physical properties of materials
Poisson’s ratio | Density / kg·m-3 | Yield limit / MPa | Elastic modulus / GPa |
0.26 | 7150 | 315 | 178 |
The steering device bears significant vibration loads, so structural dynamics analysis is essential, and the key type of analysis is structural modal analysis. Modal analysis is mainly used to calculate the vibration frequency and shape of structures, therefore, it can also be called frequency analysis or vibration mode analysis. Dynamic analysis can be divided into time-domain analysis and frequency-domain analysis, which are the basic analysis types of dynamic frequency-domain analysis. The analysis process of prestressed mode is established, as shown in Fig. 3, which can obtain the modal and stress distribution characteristics under ultimate load. When the vehicle is turning, three situations will occur due to the centrifugal force generated by its own mass. If the centrifugal force value is small, it will balance the lateral force between the ground and the wheels on both sides. If the centrifugal force causes the lateral force to be consistent with the maximum lateral adhesion force of the tire on the driving road, there will be a trend of lateral sliding during the driving process. If the lateral force exceeds the critical lateral adhesion, there may be lateral sliding or even overturning during driving. Considering the dynamic load factor, triple gravity full load and maximum torque are applied to the steering device. The vertical load under the action of gravity is set to the swing position, and the internal force of the gear is defined by the axial force and radial force, respectively. In terms of constraints, the translation in all directions of the main pin holes at both ends and the rotation in the release direction are restricted, as shown in Fig. 4. Through mechanical calculations, it can be obtained that the maximum impact force loaded on both sides of the steering device is 33728 N.
Fig. 3The analysis process of prestressed mode
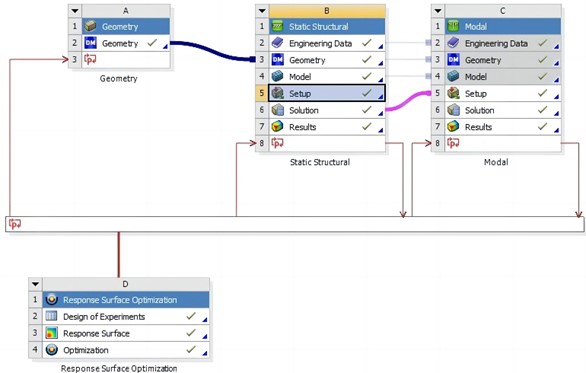
Fig. 4The analysis process of prestressed mode
2.3. Result analysis of prestressed mode
The analysis results of the prestressed mode can be viewed in the processing module, including stress, deformation, and modal characteristics. The analysis result of static structure is shown in Fig. 5. It can be seen that under the condition of ultimate load, the maximum stress of steering device is 211.4 MPa, which is mainly distributed at the ends of both sides. The steering device adopts CRH380B material with a yield strength of 560 MPa. It can be seen that the Factor of safety under the maximum stress condition is 2.65, most areas have high Factor of safety. The maximum deformation is 0.55 mm, mainly located at the center baffle position. According to the strength analysis results, the maximum equivalent stress of the steering device is less than the yield strength of 310 MPa, and the static strength meets the usage requirements. In terms of stiffness verification, based on the wheelbase of the vehicle, the deformation per meter of wheelbase can be calculated to be 0.36 mm, which is far less than the standard requirement of 1.5 mm deformation.
Fig. 5Strength analysis results
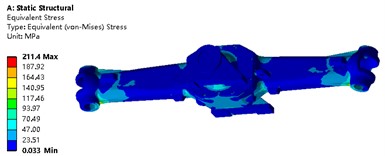
a) Stress nephogram
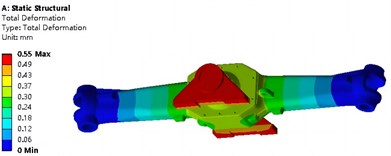
b) Deformation nephogram
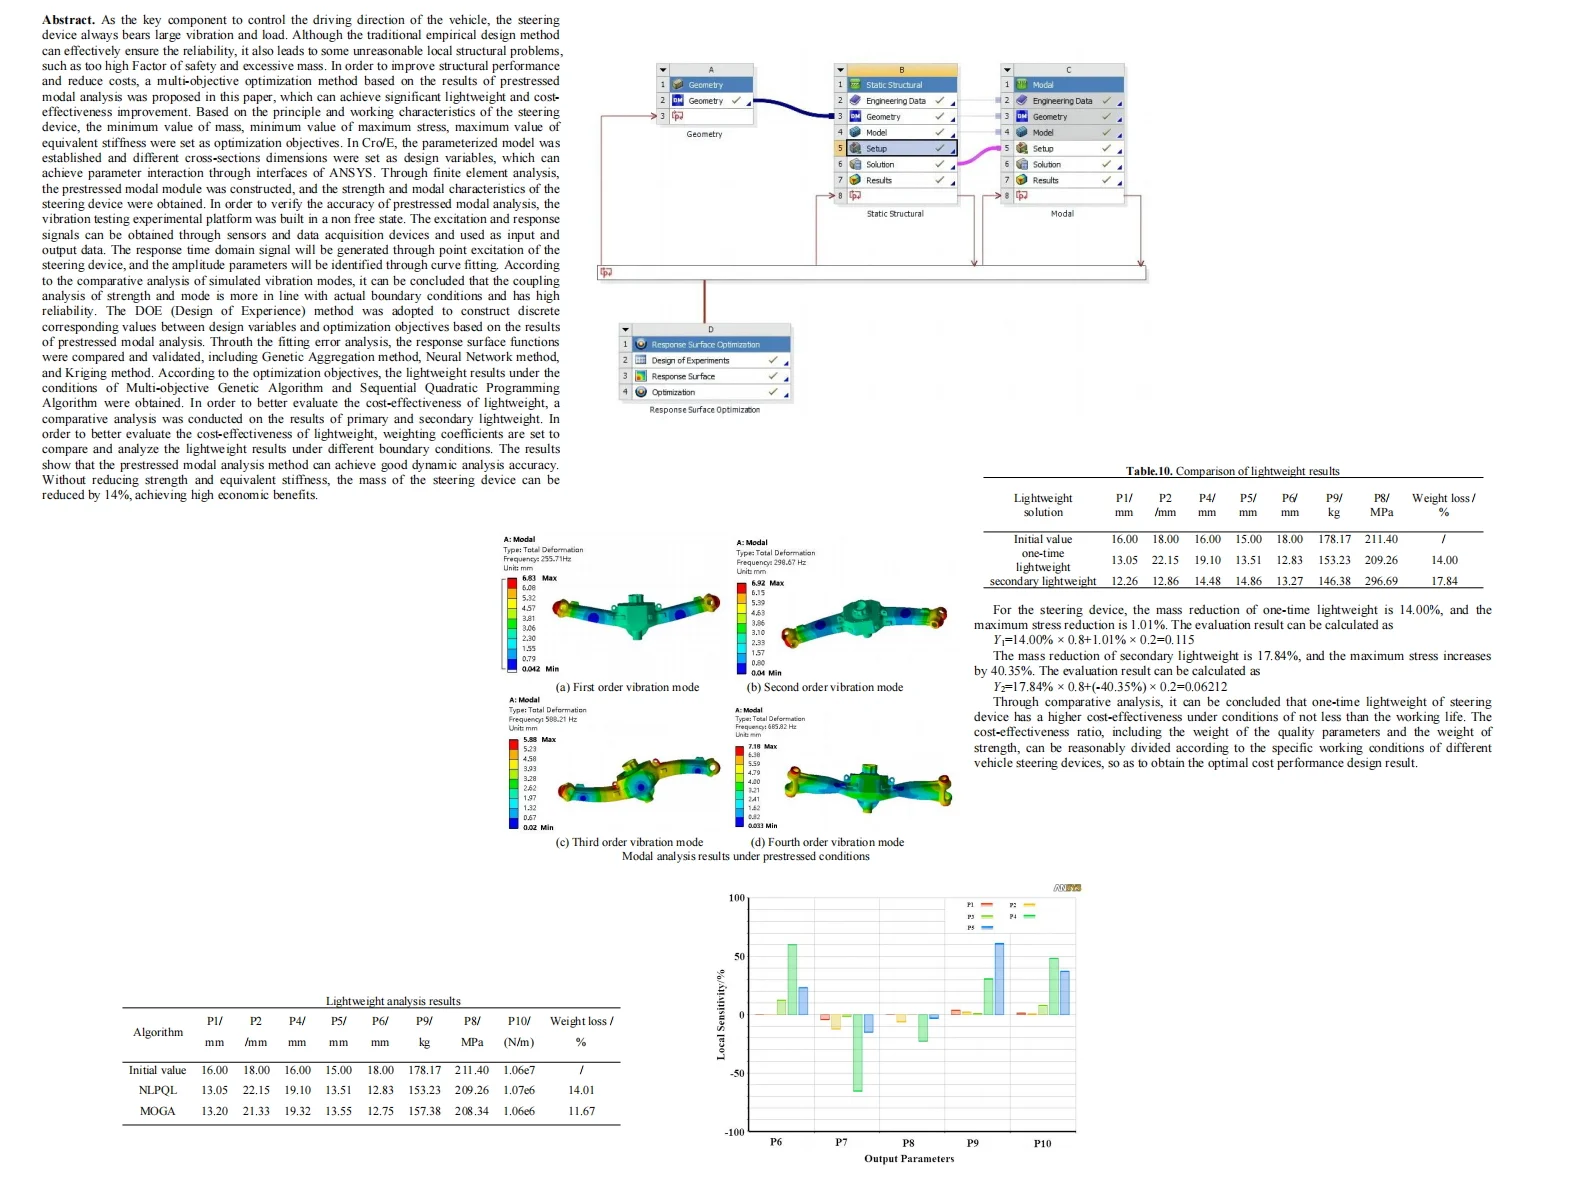
The natural frequencies and mode analysis results of the first four orders under pre-stressed conditions are shown in Table 3 and Fig. 6, respectively. It can be seen that the first natural frequency is 255.71 Hz, and the stiffness of the steering device is relatively high, making it less prone to resonance. The first mode of vibration is the overall transverse bending vibration, with the maximum resonance position located on both sides. The second mode of vibration is the overall longitudinal bending, and the relative displacement characteristics of resonance are consistent with the first mode of vibration. The third mode of vibration mainly manifests as lateral torsion. The fourth mode of vibration exhibits torsional vibration around the center on both sides.
Table 3The analysis process of prestressed mode
Modal order | 1 | 2 | 3 | 4 |
Natural frequency / Hz | 255.71 | 298.67 | 588.21 | 685.82 |
Fig. 6Modal analysis results under prestressed conditions
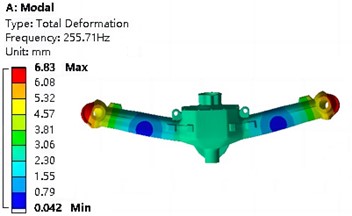
a) First order vibration mode
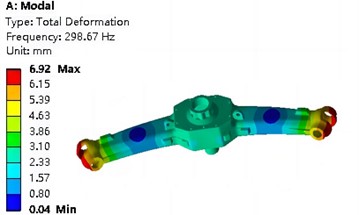
b) Second order vibration mode
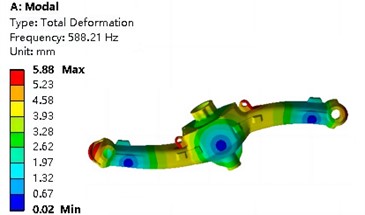
c) Third order vibration mode
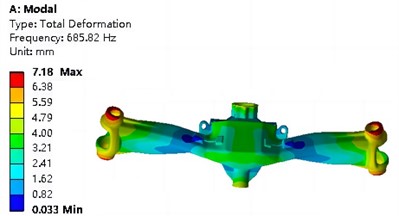
d) Fourth order vibration mode
2.4. Verification of modal experiments
To verify the reliability and accuracy of finite element analysis, the testing scheme of experimental modes was adopted and studied in the article. The excitation signal and response signal can be obtained through sensors and data acquisition devices, and used as input and output data [13]. Furthermore, the frequency response function matrix of the system will be solved. By using the method of modal parameter identification, the modal parameters of the system can be solved and obtained. For the steering device, the frequency domain modal parameter identification method has good testing results. The response time domain signal will be generated through point excitation of the steering device. Through wavelet transform processing and transformation, the frequency response function will be obtained, and finally the modal parameters will be obtained through curve fitting recognition.
According to the boundary conditions of the simulation model, the experimental conditions are set as shown in Fig. 7. The preload load is applied at the center of the steering device, and the stress sensors are arranged at five different positions, as shown in Fig. 7(a), which can effectively verify the static strength calculation results. For modal testing, single point excitation is carried out through an exciter, and data can be picked up from multiple points. As the response point for the excitation signal, combined with the size of the steering device, the selected response point position needs to be consistent with the degree of freedom of the structure, and the number of measurement points is proportional to the measured modal order [14]. Therefore, the closer the measurement points are to the test piece and the more measurement points are arranged, the smoother the modal vibration mode. Under the premise of a reasonable distribution and sufficient number of measurement points, the correctness of modal identification can be ensured, while effectively avoiding the occurrence of modal loss. Piezoelectric acceleration sensors are applied in modal testing systems, which are connected to the dynamic signal analysis system through data transmission lines, as shown in Fig. 7(b). Set and select 110 measuring points on the surface of the steering device, and adjust the Euclidean angle to achieve consistency between the local and global coordinate systems of the measuring points.
Fig. 7Experimental verification of modal simulation
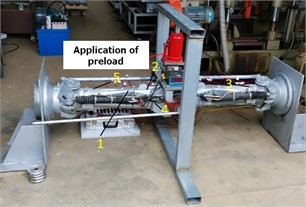
a) Installation of pre tensioning device
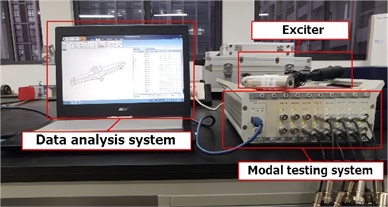
b) Data acquisition system
The stress values at different measurement points are shown in Table 4. It can be seen that the maximum deviation between the experimental values and the simulation values is less than 8 %, indicating that the simulation model has high reliability. The collected data is post-processed using the modal analysis software WaveImage Modal. According to the peak picking method, the modal parameters are identified, and the parameter files of the experimental modal can be obtained. Compare and analyze the results of the experimental mode with the results of the calculated mode to verify the correctness of the finite element model, as shown in Table 5. It can be seen that the modal analysis results under prestressed conditions have high accuracy, and the maximum deviation between experimental values and simulation values is 7.8 %.
Table 4The analysis process of prestressed mode
Stress measuring point | 1 | 2 | 3 | 4 | 5 |
Test value of stress / MPa | 21.25 | 74.26 | 122.36 | 166.78 | 118.35 |
Simulation value of stress / MPa | 19.86 | 79.93 | 116.68 | 179.64 | 124.21 |
Deviation from simulated values | 6.5 % | 7.6 % | 4.6 % | 7.7 % | 5.0 % |
Table 5The analysis process of prestressed mode
Modal order | 1 | 2 | 3 | 4 |
Test value of Natural frequency / Hz | 243.38 | 275.68 | 569.37 | 667.98 |
Deviation from simulated values | 4.8 % | 7.8 % | 3.2 % | 2.6 % |
Vibration mode of the measuring point | 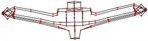 | 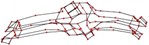 | 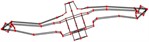 | 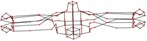 |
3. Lightweight optimization of steering device
3.1. The proposal of multi-objective optimization methods
The traditional design method of steering device has some shortcomings, such as high Factor of safety, unreasonable local design, and waste of materials and energy. To effectively address these issues, a lightweight design method is proposed in this article. Based on the DOE (Design of Experience) optimization method, finite element analysis technology and advanced optimization algorithms are applied to the lightweight design of steering devices. Therefore, a more accurate approximation function relationship between optimization objectives and design variables can be expressed locally with less computational complexity. To ensure that the mechanical performance does not decrease after lightweight, the optimization objectives are set as mass, maximum stress, and first order natural frequency. Through research, a solution set that meets the requirements of lightweight optimization can be obtained without reducing the strength and stiffness of the structure, providing an important basis for the optimization design of the structure, with good economic and social benefits. Under the condition of pre-stressed modal analysis, the main steps of multi-objective optimization include parameterization of the model, organization of sampling data, construction of approximate models, calculation of fitting errors, and solution of optimized mathematical models.
3.2. Parameterization of finite element model
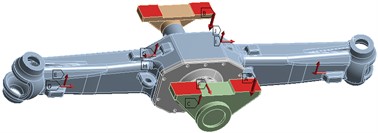
According to its load-bearing characteristics, the dimensions of different sections of the steering device are parameterized, as shown in Fig. 8, and the design range is shown in Table 6, which can ensure that there is no structural interference or reference failure under extreme size conditions. Based on the characteristics of the model structure size, it can be seen that using equivalent upper and lower limit changes will not result in structural errors.
Table 6The range of values for design variables
Design variable | |||||
Initial value / mm | 16 | 18 | 16 | 15 | 18 |
Lower limit value / mm | 12 | 12 | 12 | 12 | 12 |
Upper limit / mm | 20 | 24 | 20 | 20 | 24 |
According to the value range of design variables, it can be seen that under the allowable conditions of assembly size, most of the value ranges of design variables are in a symmetrical distribution form. According to the characteristics of the load, some dimensions are taken as asymmetric values, but the deviation between the lower and upper limits is still small. Therefore, the G-optimization scheme in the central group and design method was used to obtain sample data. In the continuous data interaction and iterative operation between ANSYS and Creo, parameter variables are shared in real-time. These discrete sample data are the key to completing the response surface function fitting. If the accuracy of the fitting function is insufficient, it is necessary to readjust the sample value range and sampling plan. The symbols for design variables and response objectives is shown in Table 7. Where P6 is first order natural frequency, P7 is the maximum deformation of steering components, P8 is the maximum stress, P9 is mass and P10 is equivalent stiffness (P10 = P6*P6*P9).
Fig. 8Model for parameter definition
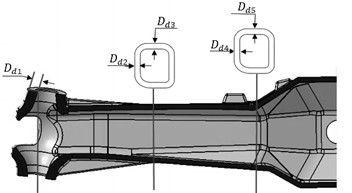
Table 7Symbols for design variables and response objectives
Design variable | ||||||||||
Symbol | P1 / mm | P2 / mm | P3 / mm | P4 / mm | P5 / mm | P6 / Hz | P7 / mm | P8 / MPa | P9 / kg | P10 / N/m |
1 | 16.00 | 18.00 | 16.00 | 15.00 | 18.00 | 243.38 | 0.55 | 211.40 | 178.17 | 1.06E+07 |
2 | 12.00 | 18.00 | 16.00 | 15.00 | 18.00 | 223.78 | 0.54 | 223.35 | 173.45 | 8.69E+06 |
3 | 20.00 | 18.00 | 16.00 | 15.00 | 18.00 | 253.69 | 0.52 | 206.37 | 182.89 | 1.18E+07 |
4 | 16.00 | 12.00 | 16.00 | 15.00 | 18.00 | 240.7 | 0.54 | 229.89 | 175.26 | 1.02E+07 |
5 | 16.00 | 24.00 | 16.00 | 15.00 | 18.00 | 262.01 | 0.53 | 204.48 | 181.08 | 1.24E+07 |
6 | 16.00 | 18.00 | 12.00 | 15.00 | 18.00 | 244.55 | 0.53 | 209.98 | 176.76 | 1.06E+07 |
7 | 16.00 | 18.00 | 20.00 | 15.00 | 18.00 | 236.51 | 0.53 | 219.64 | 179.57 | 1.00E+07 |
8 | 16.00 | 18.00 | 16.00 | 13.50 | 18.00 | 168.64 | 0.56 | 278.34 | 142.26 | 4.05E+06 |
9 | 16.00 | 18.00 | 16.00 | 16.50 | 18.00 | 208.4 | 0.51 | 196.38 | 214.07 | 9.30E+06 |
10 | 16.00 | 18.00 | 16.00 | 15.00 | 12.00 | 186.05 | 0.54 | 298.97 | 156.41 | 5.41E+06 |
11 | 16.00 | 18.00 | 16.00 | 15.00 | 24.00 | 277.9 | 0.53 | 126.35 | 248.49 | 1.92E+07 |
12 | 14.87 | 16.30 | 14.87 | 14.57 | 19.70 | 254.96 | 0.54 | 194.28 | 185.51 | 1.21E+07 |
13 | 17.13 | 16.30 | 14.87 | 14.57 | 16.30 | 177.97 | 0.54 | 265.12 | 147.92 | 4.69E+06 |
14 | 14.87 | 19.70 | 14.87 | 14.57 | 16.30 | 171.91 | 0.54 | 270.29 | 146.90 | 4.34E+06 |
15 | 17.13 | 19.70 | 14.87 | 14.57 | 19.70 | 250.44 | 0.54 | 208.9 | 189.83 | 1.19E+07 |
16 | 14.87 | 16.30 | 17.13 | 14.57 | 16.30 | 179.38 | 0.55 | 282.95 | 146.05 | 4.70E+06 |
17 | 17.13 | 16.30 | 17.13 | 14.57 | 19.70 | 252.67 | 0.54 | 178.56 | 188.98 | 1.21E+07 |
18 | 14.87 | 19.70 | 17.13 | 14.57 | 19.70 | 248.28 | 0.54 | 176.45 | 187.95 | 1.16E+07 |
19 | 17.13 | 19.70 | 17.13 | 14.57 | 16.30 | 180.79 | 0.54 | 296.45 | 150.36 | 4.91E+06 |
20 | 14.87 | 16.30 | 14.87 | 15.43 | 16.30 | 188.23 | 0.53 | 280.92 | 165.6 | 5.87E+06 |
21 | 17.13 | 16.30 | 14.87 | 15.43 | 19.70 | 265.31 | 0.53 | 153.70 | 208.53 | 1.47E+07 |
22 | 14.87 | 19.70 | 14.87 | 15.43 | 19.70 | 256.39 | 0.52 | 162.86 | 207.50 | 1.36E+07 |
23 | 17.13 | 19.70 | 14.87 | 15.43 | 16.30 | 192.36 | 0.53 | 233.47 | 169.92 | 6.29E+06 |
24 | 14.87 | 16.30 | 17.13 | 15.43 | 19.70 | 204.98 | 0.53 | 174.29 | 206.65 | 8.68E+06 |
25 | 17.13 | 16.30 | 17.13 | 15.43 | 16.30 | 265.07 | 0.53 | 244.57 | 169.07 | 1.19E+07 |
26 | 14.87 | 19.70 | 17.13 | 15.43 | 16.30 | 236.44 | 0.53 | 225.43 | 168.04 | 9.39E+06 |
27 | 17.13 | 19.70 | 17.13 | 15.43 | 19.70 | 272.32 | 0.52 | 172.48 | 210.97 | 1.56E+07 |
3.3. Fitting of response surface functions
For the parameterized models of steering components, the response surface functions are constructed using Genetic Aggregation (GA)method [15], Neural Network (NN) method [16], and Kriging (K) method [17]. Since P10 is determined by P9 and P6, the fitting effects of P6, P8, and P9 will be verified. Compare the fitting accuracy of various response surface functions, and take the fitting determination coefficient , root mean square difference RMS, relative maximum absolute error RMAE and relative Mean absolute error RAAE as the evaluation basis. The error determination results are shown in Table 8. It can be seen that both the Kriging model and the GA model can achieve good fitting accuracy. In contrast, the Kriging model was selected as the response surface function fitting for the ultimate strength analysis of the parameterized model.
Table 8Error judgment and comparison results
Target parameters | response surface form | (The optimal value is 1) | RMS (The optimal value is 0) | RMAE (The optimal value is 0) | RAAE (The optimal value is 0) |
P6 | GA | 1 | 0.005 | 0.616 | 0.15 |
NN | 1 | 0.03 | 5.02 | 1.21 | |
K | 1 | 3.86e-3 | 0 | 0 | |
P8 | GA | 1 | 1.71e-3 | 1.25 | 3.11 |
NN | 1 | 9.2e-5 | 2.05 | 0.77 | |
K | 1 | 5.33e-4 | 0 | 0 | |
P9 | GA | 1 | 0.008 | 0.54 | 0.54 |
NN | 1 | 0.001 | 0.011 | 0 | |
K | 1 | 1.26e-6 | 0 | 0 |
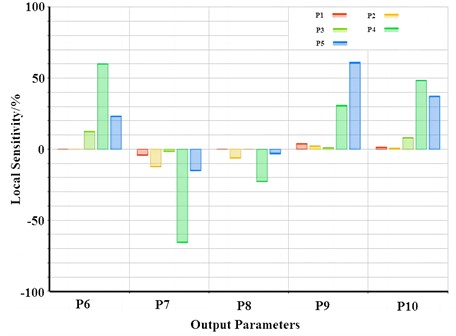
Under the response surface function conditions of the Kriging model, the response surface characteristics of its design variables on optimization objectives can be obtained, respectively. It can be seen that there are significant differences in the response characteristics of different design variables to optimization objectives, and the fitting of the maximum stress function has significant nonlinear characteristics. The sensitivity analysis results of design variables to the optimization objectives are shown in Fig. 9. It can be seen that the sensitivity of each design variable to the optimization objectives is relatively balanced, and the influence of parameters P4 and P5 on each objective parameter is more significant.
Fig. 9Sensitivity of design variables to optimization objectives
3.4. Analysis of optimization results
To ensure that the lightweight design of the steering equipment still maintains good strength and stiffness, the target parameters P8 and P10 are converted into boundary conditions, namely P8 ≤ 211.40 MPa, P10 ≥ 1.06 e7 N/m, as shown in optimizing mathematical equations as followed:
The optimization objective is the minimum value of the quality parameter P9. After completing the fitting and validation of the response surface function, it is necessary to choose a reasonable optimization algorithm to solve the extreme values of the function. According to the load bearing characteristics of parts and the requirements of lightweight design, the parameter variables and target extreme values obtained from the comparative analysis of Multi-Objective Genetic Algorithm (MOGA) and Sequential Quadratic Programming (NLPQL) are shown in Table 9. It can be seen that under the NLPQL algorithm conditions, the mass of the steering equipment can be reduced by 14 %, while maintaining maximum stress without increasing and equivalent stiffness without decreasing, resulting in significant optimization effects. The comparison of vibration modes before and after optimization is shown in Fig. 10. It can be seen that although the optimized model has lower weight, its vibration response is relatively more balanced, and its natural frequency has also been improved to a certain extent.
Table 9Lightweight analysis results
Algorithm | P1 / mm | P2 / mm | P4 / mm | P5 / mm | P6 / mm | P9 / kg | P8 / MPa | P10 / (N/m) | Weight loss / % |
Initial value | 16.00 | 18.00 | 16.00 | 15.00 | 18.00 | 178.17 | 211.40 | 1.06e7 | / |
NLPQL | 13.05 | 22.15 | 19.10 | 13.51 | 12.83 | 153.23 | 209.26 | 1.07e6 | 14.01 |
MOGA | 13.20 | 21.33 | 19.32 | 13.55 | 12.75 | 157.38 | 208.34 | 1.06e6 | 11.67 |
Fig. 10Comparison of vibration modes before and after optimization
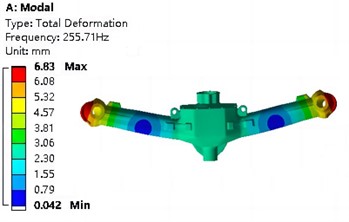
a) First mode shape before optimization
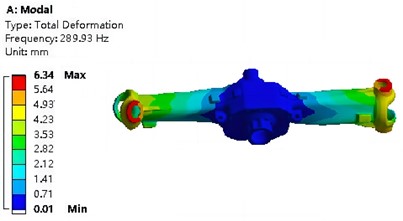
b) First mode shape after optimization
4. Evaluation of lightweight design results
4.1. Rationalization of factor of safety
According to the pre-stressed modal analysis results of the steering device, high factor of safety is adopted in the structural design. Both structural stiffness and maximum stress are far below the allowable limit, resulting in relatively large margins in structural design. In lightweight research, the main boundary condition is to ensure that the performance is not lower than the initial state, while minimizing the mass of the parts while ensuring that all performance is not reduced. This scheme is referred to as one-time lightweigh. Although it has high reliability and can reduce production costs, its lightweighting effect is relatively limited due to boundary conditions. According to the production and mechanical property test standards of the enterprise, the Factor of safety under the static load condition can be controlled above 1.5 to avoid damage from the limit load and rated fatigue load. If the Factor of safety is too high, resources will be wasted.
For this reason, a rationalization scheme of Factor of safety is proposed in this paper, that is, to reduce the structural stiffness of parts within a certain range, increase the peak stress in the optimization model, and further reduce the weight of key components on the premise of fully ensuring the reliability and safety of equipment. This scheme is called secondary lightweight. The way to reduce boundary conditions requires a more reasonable evaluation of the lightweight design results to avoid insufficient equipment cost-effectiveness. Due to the fact that the optimization objectives are different dimensional parameters, performance evaluation cannot be directly performed from the results. Therefore, a weighted normalization evaluation method is used to standardize the data of the optimization objectives, and can be used as an important indicator for measuring cost-effectiveness. According to the requirements of the steering equipment manufacturing enterprise, after weighing the relationship between quality, performance and effective design life conditions, the weight of the quality parameters is set to 0.8, and the weight of strength is also set to 0.2. The evaluation formula for lightweight effect is:
where is the quantization value of the lightweight effect, the larger the value, the higher the cost-effectiveness. is mass change fraction, is maximum stress change rate.
4.2. Analysis of lightweight effect
In the secondary lightweight calculation, the Factor of safety is set to 1.5, that is, the boundary condition is set to P8 ≤ 373.33 MPa, P10 ≥ 1.06e7 N/m. By optimizing the extreme value search and iterative operation of the mathematical model, the lightweight comparison results of the parts can be obtained as shown in Table 10. It can be seen that the secondary lightweight can reduce the mass by 17.84 %, the corresponding maximum stress is 296.69 MPa, and the Factor of safety is 1.9, which meets the design requirements.
Table 10Comparison of lightweight results
Lightweight solution | P1 / mm | P2 / mm | P4 / mm | P5 / mm | P6 / mm | P9 / kg | P8 / MPa | Weight loss / % |
Initial value | 16.00 | 18.00 | 16.00 | 15.00 | 18.00 | 178.17 | 211.40 | / |
One-time lightweight | 13.05 | 22.15 | 19.10 | 13.51 | 12.83 | 153.23 | 209.26 | 14.00 |
Secondary lightweight | 12.26 | 12.86 | 14.48 | 14.86 | 13.27 | 146.38 | 296.69 | 17.84 |
For the steering device, the mass reduction of one-time lightweight is 14.00 %, and the maximum stress reduction is 1.01 %. The evaluation result can be calculated as:
The mass reduction of secondary lightweight is 17.84 %, and the maximum stress increases by 40.35%. The evaluation result can be calculated as:
Through comparative analysis, it can be concluded that one-time lightweight of steering device has a higher cost-effectiveness under conditions of not less than the working life. The cost-effectiveness ratio, including the weight of the quality parameters and the weight of strength, can be reasonably divided according to the specific working conditions of different vehicle steering devices, so as to obtain the optimal cost performance design result.
5. Conclusions
Based on the working principle and load-bearing characteristics of the steering device, prestressed modal analysis and lightweight design were conducted separately. This study can provide scientific and reasonable basis for the optimization design of steering devices, thereby reducing research and development cycles, saving production costs, and reducing energy waste. The main conclusions are as follows:
1) The steering device bears significant torque and excitation vibration, so modal analysis needs to consider the prestressing situation, which is more consistent with the actual working conditions. Through experimental testing, it can be seen that the simulation scheme has high accuracy and reliability.
2) For the research on the construction and accuracy verification of response surface models, different methods can be compared based on the characteristics of the range of design variables, such as genetic aggregation method, standard response surface full second-order polynomial, Kriging method, or neural network method. The fitting accuracy of various response surface functions needs to be checked according to the fitting decision coefficient, root mean square difference, relative maximum absolute error and relative Mean absolute error. Through verification, the optimal response surface construction method can be selected. The optimal parameter variables and the objective extreme value can be effectively obtained.
3) Under the premise of fully ensuring the reliability and safety of the equipment, reducing the structural stiffness of the parts and increasing the stress peak in the optimization model can achieve further weight reduction of key components. It also can be seen that the way to reduce boundary conditions requires a more reasonable evaluation of the lightweight design results to avoid insufficient equipment cost-effectiveness.
References
-
L. Solazzi, N. Danzi, M. Gelfi, and L. E. Zavanella, “Failure analysis of a pair of failed chain links,” Engineering Failure Analysis, Vol. 152, No. 1, p. 107481, Oct. 2023, https://doi.org/10.1016/j.engfailanal.2023.107481
-
R. Anand and R. Padmanabhan, “Influence of friction stir welding process parameters and statistical behaviour of the novel interlock aluminum alloys joint with SiCp reinforcement,” CIRP Journal of Manufacturing Science and Technology, Vol. 45, No. 7, pp. 260–270, Oct. 2023, https://doi.org/10.1016/j.cirpj.2023.07.002
-
S. Vulovic, M. Zivkovic, A. Pavlovic, R. Vujanac, and M. Topalovic, “Strength analysis of eight-wheel bogie of bucket wheel excavator,” Metals, Vol. 13, No. 3, p. 466, Feb. 2023, https://doi.org/10.3390/met13030466
-
K. J. Kim, “Light-weight design and fatigue characteristics of automotive knuckle by using finite element analysis,” Journal of Mechanical Science and Technology, Vol. 35, No. 7, pp. 2989–2995, Jul. 2021, https://doi.org/10.1007/s12206-021-0622-0
-
B. A. Nitalikar, D. R. Kulkarni, and Z. A. Patel, “Structural and finite element analysis of steering yoke of an automobile,” International Journal of Engineering and Management Research, Vol. 10, No. 5, pp. 168–175, 2020, https://doi.org/10.1007/10.31033/ijemr.10.5.13
-
M. R. Zarastvand, M. H. Asadijafari, and R. Talebitooti, “Acoustic wave transmission characteristics of stiffened composite shell systems with double curvature,” Composite Structures, Vol. 292, No. 1, p. 115688, Jul. 2022, https://doi.org/10.1016/j.compstruct.2022.115688
-
R. Talebitooti, M. Zarastvand, and H. Darvishgohari, “Multi-objective optimization approach on diffuse sound transmission through poroelastic composite sandwich structure,” Journal of Sandwich Structures and Materials, Vol. 23, No. 4, pp. 1221–1252, May 2021, https://doi.org/10.1177/1099636219854748
-
R. Talebitooti, H. D. Gohari, and M. R. Zarastvand, “Multi objective optimization of sound transmission across laminated composite cylindrical shell lined with porous core investigating non-dominated sorting genetic algorithm,” Aerospace Science and Technology, Vol. 69, No. 1, pp. 269–280, Oct. 2017, https://doi.org/10.1016/j.ast.2017.06.008
-
P. Purwanto, N. F. Qaidahiyani, M. S. Ikbal, and D. Djamaluddin, “Shear strength analysis of rock due to the effect of surface roughness based on laboratory testing and numerical modeling,” Materials Science Forum, Vol. 1091, No. 1, pp. 81–92, Jun. 2023, https://doi.org/10.4028/p-q863a9
-
M. Mobaraki and J. Ratava, “Tuning vibration absorbers to mitigate simultaneous regenerative and mode-coupling chatter,” Noise and Vibration Worldwide, Vol. 54, No. 6, pp. 237–247, Jun. 2023, https://doi.org/10.1177/09574565231179731
-
I. Aarab, K. E. Amari, A. Yaacoubi, A. Etahiri, and A. Baçaoui, “Optimization of the flotation of low-grade phosphate ore using DOE: a comparative evaluation of fatty acid formulation to sodium oleate,” Mining, Metallurgy and Exploration, Vol. 40, No. 1, pp. 95–108, Feb. 2023, https://doi.org/10.1007/s42461-022-00706-w
-
S. Michałek et al., “The design of experiments (DOE) in optimization of an aerobic flow Pd-catalyzed oxidation of alcohol towards an important aldehyde precursor in the synthesis of phosphatidylinositide 3-kinase inhibitor (CPL302415),” RSC Advances, Vol. 12, No. 52, pp. 33605–33611, Nov. 2022, https://doi.org/10.1039/d2ra07003k
-
V. Midasala, K. C. Janapati, S. V. N. Srinivasu, M. Ramachandran, M. Mousavi, and A. H. Gandomi, “Sensor-system-based network with low-power communication using multi-hop routing protocol integrated with a data transmission model,” Electronics, Vol. 11, No. 10, p. 1541, May 2022, https://doi.org/10.3390/electronics11101541
-
J. Wang, C. Wang, T. Zhang, and B. Zhong, “Comparison of different independent component analysis algorithms for output-only modal analysis,” Shock and Vibration, Vol. 2016, No. 6, pp. 1–25, 2016, https://doi.org/10.1155/2016/6309084
-
C. E. Abunike, O. I. Okoro, and S. S. Aphale, “Intelligent optimization of switched reluctance motor using genetic aggregation response surface and multi-objective genetic algorithm for improved performance,” Energies, Vol. 15, No. 16, p. 6086, Aug. 2022, https://doi.org/10.3390/en15166086
-
S. Chae, S. Bae, and Y. Nam, “Performance improvement of air-source heat pump via optimum control based on artificial neural network,” Energy Reports, Vol. 10, No. 1, pp. 460–472, Nov. 2023, https://doi.org/10.1016/j.egyr.2023.06.051
-
P. S. Drężek, S. Kubacki, and J. Żółtak, “Kriging-based framework applied to a multi-point, multi-objective engine air-intake duct aerodynamic optimization problem,” Aerospace, Vol. 10, No. 3, p. 266, Mar. 2023, https://doi.org/10.3390/aerospace10030266
Cited by
About this article

The paper is supported by provincial scientific research projects (2023YFG1066).
The datasets generated during and/or analyzed during the current study are available from the corresponding author on reasonable request.
The authors declare that they have no conflict of interest.
