Abstract
With the extremely advanced and complex design of modern vehicles, their high power and torque, it is necessary to employ advanced diagnostic systems. Quick detection and diagnosis of all defects will protect the vehicle against more serious failures, and will prevent excessive fuel consumption and harmful emissions, as well as prevent the reduction of the efficiency and functionality of vehicles. The mechatronic vehicle diagnostic system must include the diagnostic modules for the following components: engine, powertrain, steering, brake system, suspension and electrical equipment. The study discusses the hardware and software components of the mechatronic vehicle diagnostic system, and presents the sample sensors installed in the vehicle to monitor the parameters of components included in the diagnostic system. The vehicle diagnostics system has been presented using the example of diagnostics of wheeled tractors. For this purpose, two alternative diagnostic devices have been developed: a prototype MSDC-1 device, and a production version of the MSDC-2 device. Following a minor adaptation, both devices can be used in the diagnostics of other wheeled vehicles powered by I.C. engine. In further paragraphs of the study, some of the field tests performed on the diagnostic units are discussed. The study also presents some of the test results in the form of diagrams of changes in the temperature of specific engine components. In the diagrams illustrating the results of the tests, the changes of specific operating parameters of the wheeled tractor over time during tests of the MSDC-1 and MSDC-2 units can be observed. The devices differ significantly in terms of design, but they share a purpose, namely online diagnostics of vehicle condition.
1. Introduction
With the extremely advanced and complex design of modern vehicles, their high power and torque, it is necessary to employ advanced diagnostic systems. Quick detection and diagnostics of all defects will protect the vehicle against more serious failures, and will prevent excessive fuel consumption and harmful emissions, as well as prevent the reduction of efficiency and functionality of vehicles.
Modern vehicles, particularly those operated in business, must be in high technical readiness, and must ensure high reliability. Therefore, it is necessary to employ complex systems for diagnostics of all components: engine, powertrain, brakes, steering, suspension, electrical components and body.
Diagnostics of the I.C. engine must be particularly comprehensive, as it determines the efficiency of the vehicle’s operation. I.C. engines installed in modern vehicles comply with very rigorous exhaust gas toxicity standards. Exhaust emissions from the engine are very harmful for the environment and crop production [1, 2].
Another key component of the vehicle that requires comprehensive diagnostics is the powertrain, which, depending on the vehicle category, may have different designs, but usually comprises: clutch, manual or automatic gearbox, main gearbox and differential.
Other vehicle components should also be included in the comprehensive diagnostic system, as their failure may directly affect driving safety.
2. Requirements on vehicle diagnostics
When operating vehicles, it is paramount to ensure the appropriate level of safety and minimise the operating costs [3].
It is essential to provide the correct diagnostics of the working order of the vehicle to ensure appropriate availability, reduce repair expenses, and limit downtimes. The systems currently employed in vehicles are used mainly for the monitoring and optimisation of the parameters of driving, the efficiency and efficacy of the vehicle, and are limited only to monitoring the engine work and diagnostics, consisting in referring the measured parameter values to reference values [4-6].
The capabilities of detecting and locating defects are divided into the following categories of consequences:
– functional (), which reduce the efficiency of work: drop of power, torque, drawbar pull and driving speed, and increase fuel consumption;
– emissions (), which increase emissions of toxic compounds and fuel consumption; these consequences arise from incapacity of the power system, engine combustion system and powertrain units, and also result in an increase of noise level;
– compromising traffic safety () for the vehicle, involving the following systems: brakes, suspension, steering, lights;
– compromising dynamics and affecting the following parameters: reduction of acceleration, delay of response to change of movement, non-uniformity or significant drop of power, torque of driving force, etc.
During operation of the vehicle it is necessary to monitor its working order; occurrence of defects should be signaled, and the operator should receive information on the type of incapacity and the affected component.
The defects, according to the previously proposed classification [4], have been assigned with the following examples of diagnostic symptoms:
– Symptoms of functional defects (): overheating or slip of the friction clutch, excessive wear of bearing assemblies of the gearbox, causing an increase in the temperature of the unit, cracking of the gear housing, excessive wear of bearings, causing an increase of the temperature of the unit, uncontrolled loss of pressure in front and rear wheels, leakages in the inlet system, wear of the turbo charger, damage to the cooling system, engine overheating, operation under excessive load, wear of cylinder liners, wear of piston rings, leakages in sockets and valves, engine wear, and uneven wear in specific cylinders.
– Symptoms of emissions-related defects (): loss of gear oil, cracking of the gear housing, loss of gear oil, uncontrolled loss of pressure in front and rear wheels, leakages in the inlet system, engine overheating, damage to the cooling system, loss of coolant, wear of piston rings, leakages in sockets and valves, engine wear, uneven wear of specific cylinders, engine flooding by an injector, incorrect combustion process, incorrect spraying of fuel, wear of injector cup, loss of engine oil, and burning of engine oil by the engine.
– Symptoms of defects compromising safety (): excessive play in the steering unit, damage to lightbulbs in external vehicle lighting, damage to wipers, damage to the vehicle’s horn, loss of brake fluid, insufficient braking force, insufficient pressure in the braking system, air lock in the braking system, performance drop of the master brake cylinder, wear of friction linings, uncontrolled loss of pressure in front and rear wheels, puncture of tyres, leakage of vents, and damage to the oil pump.
– Symptoms of defects compromising dynamics (): overheating or slip of friction clutch, shearing of gearbox teeth, leakages in the inlet system, damage to the turbo charger, wear of cylinder liners, leakages in sockets and valves, engine wear, uneven wear in specific cylinders, engine flooding by an injector, incorrect combustion process, incorrect spraying of fuel, and wear of injector cup.
Vehicle parameters according to the nature of changes can be divided into [7]:
– Constant: rolling resistance coefficient, weight of vehicle ready for operation, driver’s weight, performance of the powertrain, gravitational acceleration, power input contribution ratio, and diesel fuel density.
– Random: angle of inclination of the subgrade and slip ratio of driving wheels.
– Declared: rotational speed of the engine set by the driver, working speed set by the driver, weight of load in the vehicle, price of 1 l of fuel, engine turned on/off, and gearbox ratio (gear change).
– Monitored: rotational speed of the engine, drop of rotational speed of the engine, total work time, power consumed to overcome idle resistances in the vehicle, power consumed to move the vehicle, power achieved by the engine, unit fuel consumption, driving speed, fuel consumption, cost of covering 1 kilometre, hourly cost, total cost, and number of kilometres covered.
To create the diagnostic system, it has been necessary to develop a series of diagnostic relations.
Diagnostic information on the condition of the vehicle can be presented in the following form [8]:
where: – set of properties of -condition of fault; – -property of -condition of fault (defect).
Using the Cartesian product of sets and , the relation can be determined [8]:
where: – set of process variables; – machine state space.
The core of the diagnostic process in this case is mapping the space of values of process variables in the state space of the machine [8].
In vehicle diagnostics various types of relations between states (defects) and the symptoms thereof are utilised, which can be basically divided into two categories [8]:
• Equivalence relations , also known as classical relations, which have the properties of reflexive, symmetric and transitive relations, with the characteristic function of :
i.e. a total order relation .
• Fuzzy relations, with the characteristic function expanded to the interval [0, 1] as a pair:
Then:
is the relation of different membership function ( of partially ordered set), compliant with the first two properties of equivalence relation (reflexive and symmetric). The classical notion of relation is a specific case of fuzzy relation, when degrees of membership equal only 0 and 1 [8].
3. Development of standards for mechatronic diagnostic system
Vehicle manufacturers have taken into consideration the need for standardisation of data exchange in the vehicle-machine system, which will allow the trading of technologically advanced vehicles. Unfortunately, the monitoring systems currently installed in vehicles are far from perfect. For this reason, standards for the system have been developed to enable precise and comprehensive diagnostics of all components [9].
The mechatronic vehicle diagnostic system must include the diagnostic modules for the following components: engine, powertrain, steering, brake system, suspension and electrical equipment.
On-board vehicle diagnostics facilitates the location of defects and removal of faults.
The tasks of the mechatronic diagnostic system can be divided according to [9] into the following categories (Fig. 1):
• Diagnostics of functional defects of the vehicle.
• Diagnostics of defects compromising the vehicle’s dynamics.
• Diagnostics of emissions-related defects of the vehicle.
• Diagnostics of defects compromising the safety of the vehicle.
• Protection of components from serious defects (breakdown failures and catastrophic failures).
• Recording information on potential defects of monitored systems.
• Recording information on the operating conditions in which defects occur.
• Monitoring parameters important in terms of vehicle operation efficiency.
• Transmitting information to the diagnostic device screen.
Fig. 1Scope of tasks of the Mechatronic Diagnostic System [9]
![Scope of tasks of the Mechatronic Diagnostic System [9]](https://static-01.extrica.com/articles/16670/16670-img1.jpg)
On-board vehicle diagnostic systems must ensure: monitoring of the correctness of the combustion process, control of the fuel system, injection system and engine inlet system, monitoring of turbo charger work, control of lubrication systems, timing gear, the piston-crank system, the exhaust system, the cooling system, recording operating parameters, transmitting information on the diagnostic readiness of the system, protection against unauthorised system modifications, monitoring the condition of all elements of the powertrain, steering and brakes, monitoring the condition of control systems of auxiliary components and all electrical equipment.
The positive features of CAN layer-based networks have resulted in the development of commercial network protocols for the industry. Particularly interesting is the DeviceNet protocol, which has found use in North America (USA, Canada), and the CANopen protocol employed in Europe. It can be noted that communication mechanisms proposed in the DeviceNet are also found in CANopen, despite the different definitions. The number of component connection slots, transfer rate and data block transfer protocols favour the networks based on the CANopen protocol [9].
In developing the hardware of the mechatronic vehicle diagnostic device, the following premises have been adopted, according to [10]:
• The central unit is a mobile PC with MS Windows and touchscreen;
• The CAN is used by the “master device” to transfer input/output data;
• CAN devices connected as “slaves” are used to collect data from sensors;
• The device is configured by the exchange of specialised input/output modules;
• The diagnostic system controls the operation of specific components of the vehicle.
Table 1 lists the types and use of sensors installed in the diagnostic device.
Table 1Summary of use of module inputs of the testing device interface [10]
Item | Measured value | Designated use | Measuring range | Sensor output signal |
1 | Rotational speed | Measurement of rotation of wheels and shafts | up to 5,000 rpm | Impulse |
2 | Angle of rotation | Measurement of steering wheel play | 30° | Impulse |
3 | Temperature | Powertrain elements | –20-+100 °C | Analogue |
4 | Temperature | Fume outlet | 0-+1,000 °C | Analogue |
5 | Vibrations | Engine vibrations Plane , | 0-30 m/s2 5 kHz | Analogue |
6 | Liquid level | Oil and brake fluid | binary | Analogue |
7 | Pressure | In tyres | 0-1 MPa | Analogue |
8 | Pressure | Intake manifold | 0-100 kPa | Analogue |
9 | Pressure | Oil and brake fluid | 0-10 bar | Analogue |
10 | Linear shift | Brake shoes | 0-10 mm | Analogue |
11 | Vehicle tilt | Two planes | –20°-+20° | Analogue |
12 | Electric current | Powering lightbulbs | binary | Analogue |
13 | Supply voltage | Control of injectors | 0-150 V | Analogue |
The main component of the diagnostic system is a mobile computer, resistant to vibrations and shocks. The mobile computer has a touchscreen. It runs under the Windows XP-2000 operating system and has a USB/DeviceNet driver converter, and the installed diagnostic software. The mobile computer is connected via USB to the I-7565 USB/DeviceNet protocol converter, working as the “master”. The CAN network connects the converter with three data acquisition devices (“slave” devices) from sensors installed on specific components of the vehicle. These devices serve as data concentrator units; each device is identified by an ID address and is fitted with four input (output) data acquisition cards, chosen according to the ranges and types of acquired signals [11].
Fig. 2 illustrates the structure of the vehicle diagnostic device.
In the diagnostic system according to [11], the following data analyses are performed:
• online diagnostics – i.e. cyclical operation of the data acquisition software, with data readout from sensors every 1 s (default value), diagnostics, generation of potential error codes;
• vibration tests – acquisition of data file from acceleration sensors, employing the fast Fourier Transform (FFT) procedure and specialised diagnostic procedures;
• engine dynamics tests – acquisition of data file from shaft rotational speed sensors, calculation of speed and acceleration in specific work conditions - utilising knowledge of engine dynamics in diagnostics.
In the diagnostic system data acquisition sets are created, with all I/O devices listed that are installed in slots and participate in the given acquisition, with the allocated time intervals (set frequency of acquisition). With this configuration, after launching automatic data acquisition with the given data acquisition unit, the operator will know which I/O device is to be read out and how often. Depending on the diagnostic strategy, the following data acquisition sets can be developed:
– standard – measurements to detect the condition of defect,
– specialised sets to identify potential defects, launched according to the detected possibility of defect in the given element or component.
Fig. 2Structure of the vehicle diagnostic device [11]
![Structure of the vehicle diagnostic device [11]](https://static-01.extrica.com/articles/16670/16670-img2.jpg)
4. Devices used in vehicle diagnostics
Vehicle diagnostics will be analysed using the example of wheeled tractor diagnostics. For this purpose, two alternative diagnostic devices have been developed: A prototype MSDC-1 device, and a production version of MSDC-2. The devices differ by the type of protocols, standard, and the installed software. Following a minor adaptation, both devices can be used in the diagnostics of other wheel vehicles powered by I.C. engine.
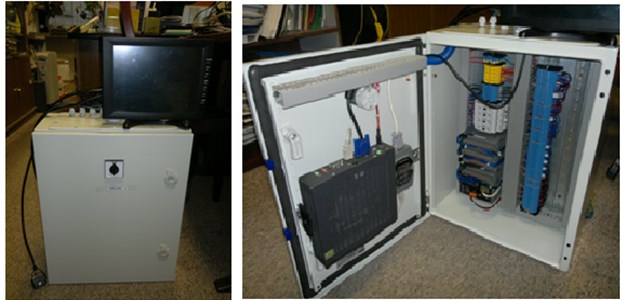
The MSDC-1 diagnostic device (Fig. 3) consists of: a cabinet with slave devices for data acquisition, USB converter, CAN master, and a mobile computer with a touchscreen.
Fig. 3MSDC-1 diagnostic device
The MSDC-2 device (Fig. 4) is a much more integrated device, consisting only of a small microchip and a touchscreen.
In both devices, the same type of sensors are used: engine crankshaft rotational speed (Fig. 5), wheels rotational speed, engine vibrations sensor, gearbox and reduction drive vibrations biaxial sensor (Fig. 5), vehicle tilt position sensor, pressure sensors at engine inlet system, coolant temperature sensor, engine oil temperature sensor, and the sensor of exhaust gas temperature on specific cylinders.
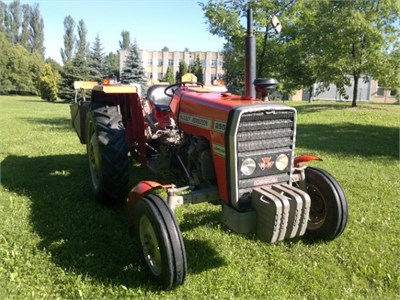
The sensors were installed on an Ursus MF-255 tractor (Fig. 6), which was used for diagnostic tests.
Fig. 4MSDC-2 diagnostic device
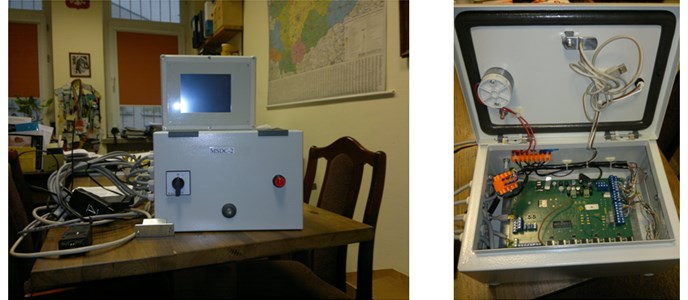
Fig. 5a) Crankshaft speed sensor, b) powertrain vibrations sensor
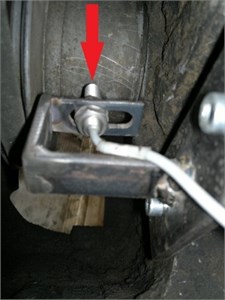
a)
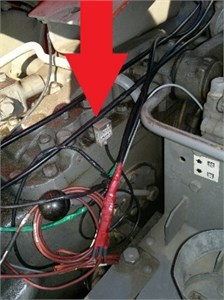
b)
Fig. 6Object of tests, on which MSDC-1 and MSDC-2 diagnostic units have been installed
In the developed diagnostic system of the wheeled tractor, the user is informed of the occurring defects by the signalling of specific fault codes.
5. Method of identification of fault states in the mechatronic diagnostic system of the wheeled tractor
The first character in the fault code: location of the main vehicle component: S – engine, N – powertrain, K – steering, H – brakes, T – auxiliary tools control system, E – electrical system.
The digit in the fault code: type of defect class (as per the hierarchy of defect class – if the defect can be categorised into various defect classes, it is signalled as a defect in the most relevant class):
1 – defect class: functional;
2 – defect class: compromising dynamics;
3 – defect class: emissions-related;
4 – defect class: compromising safety.
The third and fourth characters of the fault code indicate the code of the specific defect.
The diagnostic system records the fault code and the operating condition of the tractor as of the moment of detecting the defect.
6. Field tests of the diagnostic unit
A number of field tests of MSDC-1 and MSDC-2 diagnostic units were performed to check the operation of these devices in normal working conditions.
Methods of experimental tests, according to division criteria, are listed in Table 2.
Table 2Classification of methods of test runs according to division criteria
Group | Division criterion | Test run methods |
I | Test intensity | Intensified testing |
II | Test plan | Tests performed within a set period of time |
III | Performance method | Cyclical testing |
IV | Working conditions | Tests observed in natural operating conditions |
V | Test time | Normal tests |
VI | Type of experiment | Active |
VII | Test location | Continuous tests in operating conditions |
During tests, trial drives were performed with different loads and driving speeds, and with different ranges of engine crankshaft rotational speed.
Tests on both diagnostic units returned similar results, which were additionally confirmed by other diagnostic methods and devices. This indicates that the construction and operation of both devices are correct.
Tests on the MSDC-1 diagnostic unit returned measurement data presented in the diagrams below.
Fig. 7Changes of engine crankshaft rotational speed over time
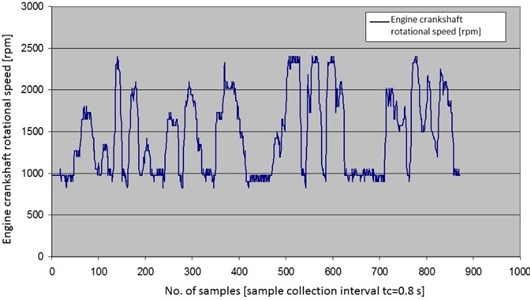
Fig. 7 illustrates the changes of engine crankshaft rotational speed over the duration of a single test drive.
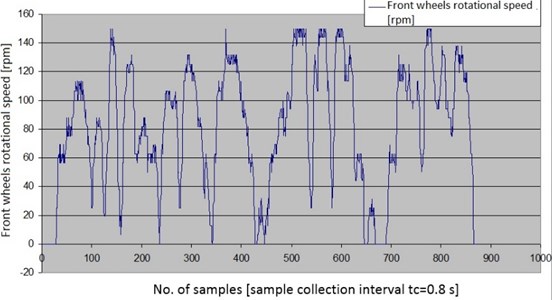
Figs. 8 and 9 illustrate the changes of rotational speed of front and rear axle wheels over time.
Fig. 8Changes of rotational speed of rear axle wheels over time
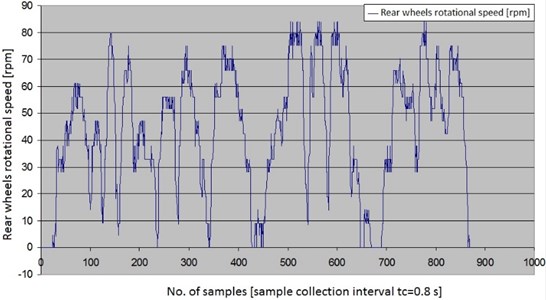
Fig. 9Changes of rotational speed of front axle wheels over time
On the basis of data acquired from the tests, a diagram has been created, illustrating the changes of the total crawl ratio during tests (Fig. 10).
Fig. 10Changes of total crawl ratio over time
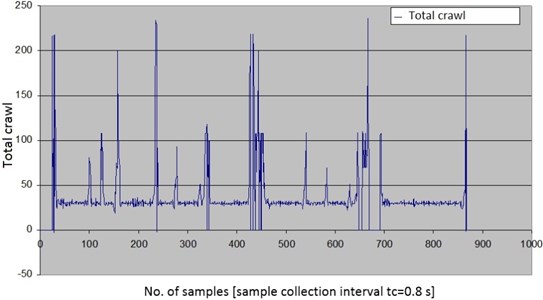
Fig. 11 illustrates the changes of exhaust gas temperature on specific engine cylinders during test drives of the wheeled tractor equipped with the diagnostic device.
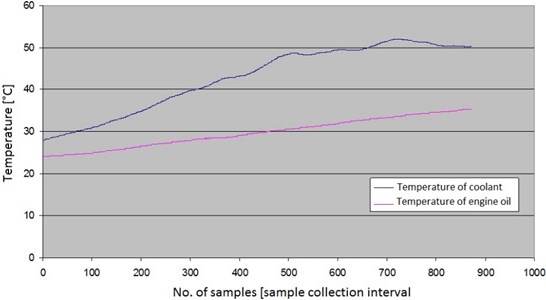
Fig. 12 illustrates the changes in the temperature of coolant and engine oil over time. With time, oil and coolant temperature would increase due to the heating up of the engine.
Fig. 11Changes of exhaust gas temperature on specific cylinders over time
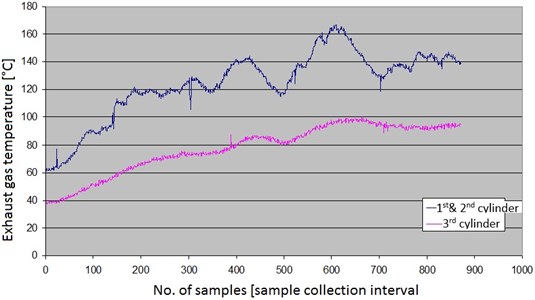
Fig. 12Changes in temperature of coolant and engine oil over time
During tests of the MSDC-2 diagnostic unit, additional tests with simulated defects of the wheeled tractor were performed. The returned results are presented in the diagrams below.
Fig. 13 illustrates the changes in temperature over time on the engine exhaust manifold for the wheeled tractor with a damaged injector cup on the first cylinder.
Fig. 13Changes in temperature of exhaust manifold with damaged injector cup on the 1st cylinder
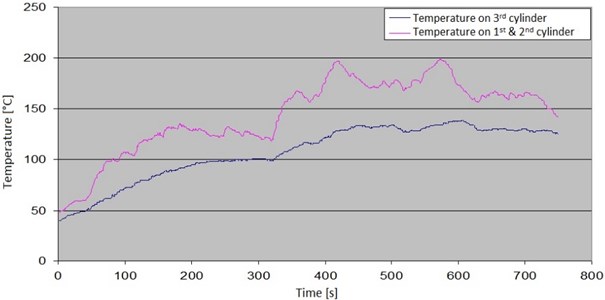
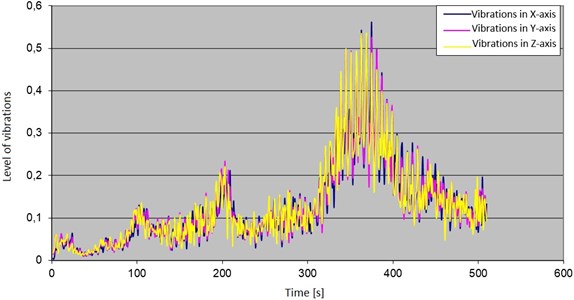
Fig. 14 illustrates the changes of the level of vibrations, recorded during tests on the wheeled tractor with a damaged injector cup on the first cylinder.
With the damage to the injector cup, changes of various diagnostic parameters were observed, which was further confirmed during tests of diagnostic units.
Fig. 14Changes of the level of vibrations recorded on the engine of wheeled tractor with damaged injector cup
7. Conclusions
With the increasing complexity of vehicles manufactured today, it is paramount to develop appropriate systems for online monitoring and diagnostics of their working order. All components of vehicles require appropriate analysis of the working order for different work conditions and loads.
Diagnostics of the working order of vehicles must include all classes of defects and the corresponding consequences and diagnostic symptoms.
For the purpose of real-time assessment of the working order of vehicles, in particular wheeled tractors, two alternative diagnostic devices have been developed, based on different architecture and different data exchange protocols. The study presents the design of MSDC-1 and MSDC-2 devices, as well as the results of tests of both devices in different load conditions, performed on a wheeled tractor.
In the diagrams illustrating the results of the tests, the changes of specific operating parameters of the wheeled tractor over time during tests of MSDC-1 and MSDC-2 units can be observed. The devices differ significantly in terms of design, but they share a purpose, namely Online Diagnostics of Vehicle Condition.
Application in the diagnostic system of the information on the occurrence of specific faults by way of fault codes enables quick identification of the affected component, the class of defect, and the specific nature of the fault. The user of the wheeled tractor immediately obtains information on the severity of the defect and the required operator response.
References
-
Dyer J., Desjardins R. Carbon dioxide emissions associated with the manufacturing of tractors and farm machinery in Canada. Biosystems Engineering, Vol. 93, 2006, p. 107-118.
-
Lindgren M. A. Transient fuel consumption model for non-road mobile machinery. Biosystems Engineering, Vol. 91, 2005, p. 139-147.
-
Kumar A., Pandey K. P. A device to measure dynamic front wheel reaction to safeguard rearward overturning of agricultural tractors. Computers and Electronics in Agriculture, Vol. 87, 2012, p. 152-158.
-
Michalski R., Gonera J., Janulin M. A simulation model of damage-induced changes in the fuel consumption of a wheeled tractor. Eksploatacja i Niezawodność – Maintenance and Reliability, Vol. 16, Issue 3, 2014, p. 452-457, (in Polish).
-
Pranav P. K., Tewari V. K., Pandey K. P., Jha K. R. Automatic wheel slip control system in field operations for 2WD tractors. Computers and Electronics in Agriculture, Vol. 84, 2012, p. 1-6.
-
Singh C. D., Singh R. C. Computerized instrumentation system for monitoring the tractor performance in the field. Journal of Terramechanics, Vol. 48, Issue 5, 2011, p. 333-338.
-
Michalski R., Gonera J., Janulin M., Arendt R. Structural Analysis of a Wheeled Tractor Oriented Towards Damage Diagnostics. Monography, Dissertation No. M29, Wydawnictwo Politechniki Świętokrzyskiej, Kielce, Poland, 2012.
-
Michalski R., Janulin M., Gonera J. Models of diagnostic relations in a wheeled tractor. Biuletyn Wojskowej Akademii Technicznej – Bulletin of the Military University of Technology, Vol. 63, Issue 1, 2014, p. 129-140, (in Polish).
-
Michalski R., Arendt R., Janulin M., Gonera J. Fault Diagnosis of Wheeled Tractors. Identification of Relationship, Models, Hardware and Software of Diagnostic System. Publishing University of Warmia and Mazury, Olsztyn, 2014, (in Polish).
-
Michalski R., Arendt R. Structure and algorithms of a diagnostic device in a wheeled tractor. Diagnostyka, Vol. 14, Issue 4, 2013, p. 55-60.
-
Michalski R., Arendt R. Hardware and software of diagnostic system of wheeled tractors. Journal of Konbin, Vol. 26, 1, p. 151-164, (in Polish).
About this article

