Abstract
The study conducted was to characterize the acoustic features and spectrum of the Ghumot, a membranophone type musical instrument indigenous to Western India. This instrument is part of the dying culture of Goan traditional music; hence it has been studied to give it a scientific understanding. The instrument was played with both conditions of the resonance cavity taken into account (open and closed), and the frequency domain spectra were determined for each. The variation in the acoustics characteristics of the instrument was plotted according to position of impact and position of measurement. The Ghumot membrane displayed non-linear characteristics as compared to a uniform, isotropic circular membrane. A comparative study was also made for the Ghumot and the Tabla to determine the number of unique tones or ‘bols’ that the instrument can produce.
1. Introduction
The Ghumot (Fig. 1) is a membranophone type percussion instrument that is used in the western states of India, like Karnataka, Goa and Maharashtra. Used largely in traditional and folk music, this instrument, it has an endemic status on the verge of extinction. Scientific documentation is almost non-existent. Analytical record of this esoteric instrument will go some way in preserving its identity.
Fig. 1The Ghumot, with vibrating membrane and mouth with resonating cavity inside
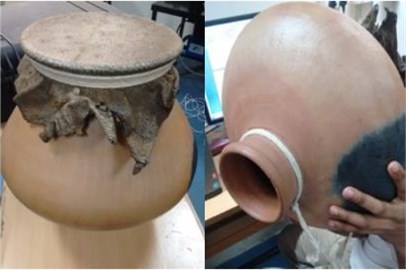
The Ghumot is a baked earthen pot, with circular openings on either end of the cavity [1]. The larger opening is covered by a membrane tied tightly by a rope. This membrane is traditionally made of the skin of the monitor lizard, but variants include goat skin. The vibration of the membrane is the main factor contributing to the tonality of the sound. The pot cavity is a resonating chamber, which conductively resonates the frequencies of the membrane vibrations.
The instrument is played with one hand striking the membrane and the other hand opening and closing the hole at the other end. The second hand controls the size of the resonating column; opening the cavity lets it interact with the air on the outside. The hole at the end will henceforth be referred to in this report as the ‘mouth’ of the Ghumot. From the playing style, it can be inferred that there are two main actions for the striking hand, i.e. the impact at the center and the impact at the edge, which will be studied extensively.
Players of the Ghumot believe that there are multiple tones or ‘bols’ that can be produced by the instrument and to objectively study all such possibilities, a comparative test has been conducted with respect to the Tabla. The Tabla is a percussion instrument that has five properly characterized tones [2, 3] with respect to the way it is played. These five tones were played by an accomplished artist and their FFT is studied to understand what these ‘tones’ or ‘bols’ signify. Hence using the same technique, the ‘bols’ of the Ghumot have been identified.
The membrane is initially assumed to be completely isotropic and tension is assumed to be even. Hence, based on position of impact, the resonating frequencies and displacements should line up to form patterns similar to theoretical understandings of the circular membrane [4].
Realistically, the response from the membrane showed non-linear and anisotropic characteristics as well as uneven distribution of tension. The anisotropy is primarily due to the composition of the skin, which is non-uniform due to the presence of scales on monitor lizard or goat skin.
2. Experimentation
The experiment was conducted and the data was recorded using the vibration analyzer Spider-81 of Crystal Instruments [5]. The Spider-81 is a data acquisition system and the Engineering Data Management software is used for analysis of data. [9]
The accelerometer used in the experiment is the 352C34 of PCB Piezotronics, which has a sensitivity of 101.3 mV/g [6]. It was mounted at certain locations on the membrane, to get local readings so as to check for variation and to average out readings. The detailed locations of sensor and impact positions are discussed in section 4. The Impact hammer, with a plastic tip, of sensitivity 10 mV/lbF was used to standardize impact and make sure no variation is present in the excitation of the membrane. Eight impact average method is used to reduce the experimental error [7]. The acoustic analysis was conducted using the 377B02 microphone (PCB Piezotronics) of sensitivity 50.21 mV/Pa [8]. The experiments were conducted in the semi-anechoic studio room at the BITS Pilani Goa Campus. The analysis was conducted for both conditions of the mouth being open and closed.
1) The acoustic analysis is confined to the range of 1 kHz in the octave, with a block size of 4096:
• Octave Analysis: The microphone was used in the acoustic/octave mode to find the response for impact at the center and the edge. Multiple impacts are made at the edge and the center of the membrane and the average of the responses is calculated.
• Auto Power Spectra: The APS response was determined using the microphone. Multiple impacts are made at both the edge and the center of the membrane and the average of the responses is calculated.
• Fast Fourier Transform: The FFT plots for the membrane in both the cases of center and edge impact were determined acoustically. The ‘record’ function in Engineering Data Management was used to record the time history of the response, and hence find the FFT for the time of impact. The accuracy for this set of readings is 2.5 Hz.
2) The mapping of displacement and first peak of FFT was conducted using an accelerometer on selected points of the membrane as discussed in Section 4. The experiment used the eight impact average method, where eight readings were taken for the same point, and the average of these readings was calculated for the response.
3. Analysis
3.1. Octave analysis
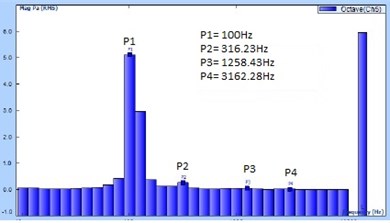
The octave analysis is used to pick out the frequency range that displays the characteristics of the fundamental frequency of the system. The tests were conducted for the condition of the mouth of the Ghumot being open.
Octave analysis can only yield a range of frequencies. As shown in Fig. 2(a), this analysis, with impact on the center, yields a frequency in the area of 100 Hz as the fundamental frequency for the given condition.
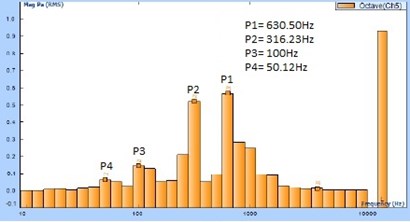
Fig. 2(b) for impact at the edge of the Ghumot shows peaks centered around 100 Hz, 316 Hz and 631 Hz.
Further conclusions can be drawn using the Auto Power Spectra and FFT analysis.
Fig. 2a) Octave analysis for the impact at the center of Ghumot membrane, b) Octave analysis for the impact at the edge of Ghumot membrane
a)
b)
3.2. Auto power spectra and FFT analysis
The APS is directly representative of the power distribution over a band of frequencies in the system, which can be used in practice to determine what frequency to apply on this system to produce the highest amount of power. A peak with a large area under it is a possible fundamental frequency of the system.
Every sound signal can also be characterized as a combination of sinusoidal waves of different frequencies and amplitudes. The Ghumot was studied with a microphone in the Fast Fourier Transform mode for both conditions of impact, on the edge and the center of the membrane.
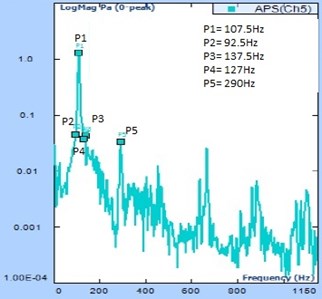
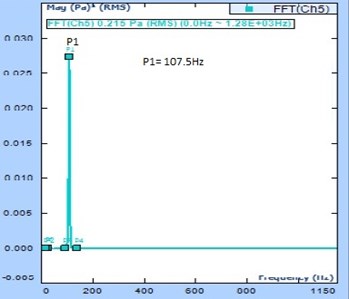
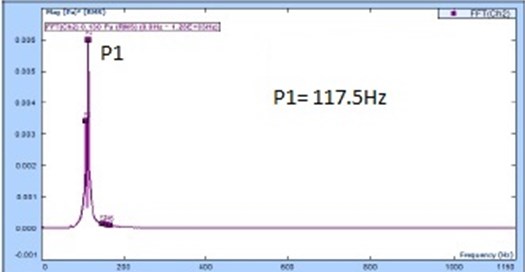
Fig. 3a) APS for the impact at the center of Ghumot membrane, b) FFT analysis for the impact at the center of Ghumot membrane
a)
b)
Fig. 3(a) shows maximum area under the peak at 107.5 Hz. This may be indicative of a fundamental frequency of the Ghumot. The Fig. 3(b) shows that 107.5 Hz is a clear peak in the FFT for the system when the impact is at the center. This could be indicative of a system frequency for impact at the center, which is a symmetrical point of impact.
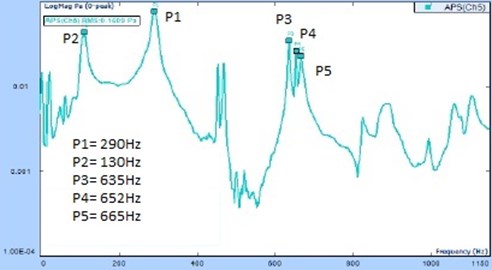
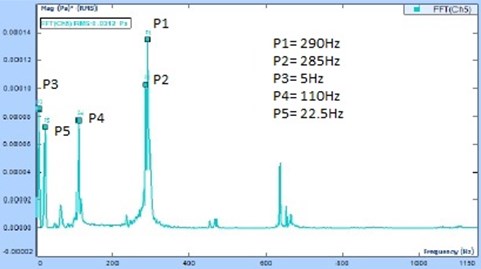
Fig. 4a) APS for the impact at the edge of Ghumot membrane, b) FFT analysis for the impact at the edge of Ghumot membrane
a)
b)
Similarly, in Fig. 4(a), the frequencies 110 Hz and 290 Hz show high areas under them. These could be the fundamental frequencies of the Ghumot for the given impact. The Fig. 4(b), which is the FFT for the impact at the edge, shows the peaks at 290 Hz and 110 Hz as the characteristic peaks for the given condition. This plot shows multiple peaks, indicating that there must be multiple modes excited by the given position of impact. This is a condition where the impact can be at any one of infinite points along the edge, and the variation in the result could be dependent on a number of properties of the membrane, like the tension variation or the anisotropic character. The variation for the edge impact in frequency domain character has been studied in the next section.
It can be concluded from the analysis in this section that the impact at center excites a frequency of 107.5 Hz as the fundamental frequency of the instrument and the edge excites 110 Hz and 290 Hz as the fundamental frequency and its harmonic.
4. Impact response
The accelerometer was placed at multiple positions on the membrane and a standardized impact was given by the impact hammer, as shown in Fig. 5 [7]. The variation in membrane displacement and first peak of FFT were plotted with respect to the position of accelerometer and the impact conditions.
The membrane was divided into 12 sections with an angular difference of 30° in between them, at radii of 4 cm and 7 cm. The 7 cm radius is near the edge, indicated by the numerical markings nearest to the edge, and the 4 cm radius is midway between the edge and the center of the membrane indicated by the numerical markings placed mid-radius on the membrane in Fig. 5. There is also an arbitrary radius marked from the center of the membrane to the edge, with points labeled from 1 to 7 with a distance of 1cm in between them, to understand radial variation of displacement and frequency. These markings are shown in the Fig. 5 radially outward from the centre.
Figs. 6-8 indicate the angular variation of the displacement and first peak of FFT spectrum for an accelerometer placed at the particular angular position at the radii of 4cm and 7cm respectively, with open mouth. The angular positions (i.e. 0, 30, 60…330) on the radial plot represents the angle with respect to an arbitrary point on the membrane. The displacement of membrane at each angular position, with impact at center is shown in Fig. 6 and Fig. 7.
In Fig. 6-8 the displacement or frequency has been normalized to the same average to make it simpler to understand the variation in angular and radial directions.
Fig. 5Ghumot membrane with markings of collection points
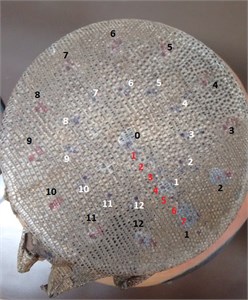
Fig. 6Variation of displacement with impact at center and response at different points at the radii of 4 and 7 cm
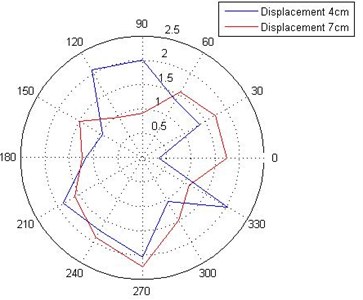
Fig. 7Variation of fundamental frequency with impact at center and response at different points at the radii of 4 and 7 cm
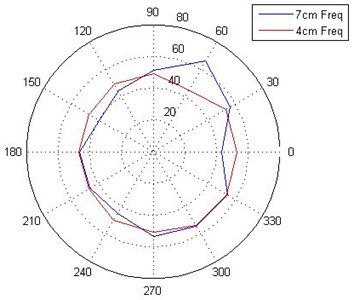
Fig. 8Variation of displacement with response at center and impact at the different points at the radii of 4 and 7 cm
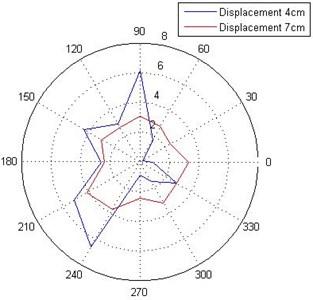
Similarly, Fig. 8 is the plot made for normalized displacement for the opposite of this condition, where the accelerometer is placed at the center and the impact point is varied as shown.
It is clear from the Figs. 6 to 8 that the angular variations of displacement and fundamental frequency are not conclusive. This can be attributed to the numerous causes for non-linearity in the system like anisotropy of the membrane made of monitor lizard skin, and the gradual decrease in tension towards the center of the membrane from the edge.
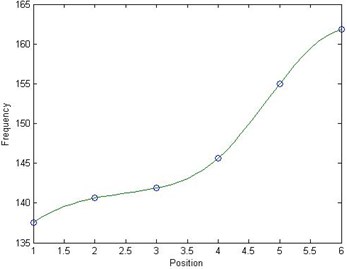
The radial variation of the displacement and fundamental frequency is shown in Fig. 9 and Fig. 10. The axis represents position of the accelerometer. The points are labeled at a distance of 1cm from each other with ‘0’ being at the center.
The displacement is gradually declining as the accelerometer moves away from the center.
The first peak of frequency of vibration in the FFT of the membrane vibration increases as the distance of measurement from the center increases. This is an anomaly and appears to be related to the non-uniform tension of the membrane, which is ideally assumed to be even [4].
An acoustic analysis was also conducted for the impact at the edge with the hand to get an idea of the frequency variation with respect to the angle. The response was determined for impact at 12 points on the edge with an angle of 30° between the impact points. The plots of FFT obtained, for each of these points, had similar spectra and same frequencies get excited. The only difference that was obtained in the plots was the relative preference of certain regions to resonate one particular frequency more than others. It was found that the variation was limited to the relative amplitudes of the peaks. This is indicative of a similarity in the acoustic response of the membrane for impact along the 360 degrees of the edge.
Fig. 9Displacement variation with impact at center and response at different radial positions from the center
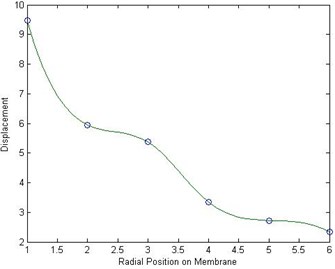
Fig. 10Variation of First peak frequency from FFT with impact at center and response at different radial positions from the center
5. identification of the tones of the Ghumot and Tabla
The number of unique tones, or ‘bols’, of an instrument can be determined by finding the number of distinct sounds that can be produced by exciting the instrument. The Ghumot was searched for the number of unique and different tones it can produce.
5.1. Identification of the tones of the Ghumot
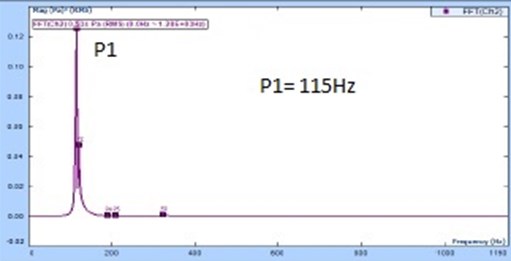
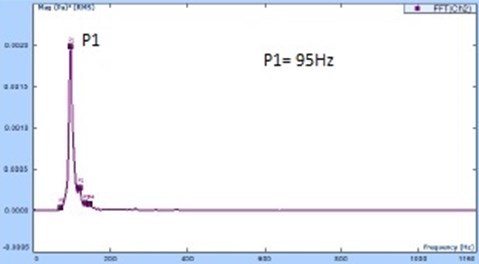
To gather the number of tones of the Ghumot, 6 conditions have been taken into account, impact at three positions (center, edge and an arbitrary position in between) for the two conditions of the opening (open and closed). The FFT plots of the six conditions are presented here from Figs. 11-13.
The first three frequencies from FFT plots shown in Figs. 11 to 13 are given in Table 1. The FFT plots for impact at the center and the arbitrary point for the mouth open condition, as per Fig. 11(a) and 11(b), are similar in terms of shape of spectrum and frequencies excited. Therefore, these can be assumed to be one distinct tone or ‘bol’. Similarly, the same can be said about the center and arbitrary point impact when the mouth is closed, as shown in Fig. 12(a) and 12(b). Therefore, this indicates the second ‘bol’. On noting the frequencies of vibration and the shape of the spectra, it can be concluded that both instances of the impacts on the edge also have the same tonal character. Therefore, these can be assumed to be the third distinct tone or ‘bol’.
Fig. 11a) FFT for impact at the center of the membrane for mouth open condition, b) FFT for impact at arbitrary point on the membrane for mouth open condition
a)
b)
Fig. 12a) FFT for impact at the center of the membrane for mouth closed condition, b) FFT for impact at arbitrary point on the membrane for mouth closed condition
a)
b)
Fig. 13a) FFT for impact at the edge of the membrane for the mouth open condition, b) FFT for impact at the edge of the membrane for mouth closed condition
a)
b)
Table 1List of frequencies in FFT plots of particular tones of the Ghumot (named as “impact condition – mouth condition”)
Number | Tone | First frequency (Hz) | Second frequency (Hz) | Third frequency (Hz) |
1 | Center – Open | 112.5 | – | – |
2 | Arbitrary – Open | 115 | – | – |
3 | Center – Closed | 95 | – | – |
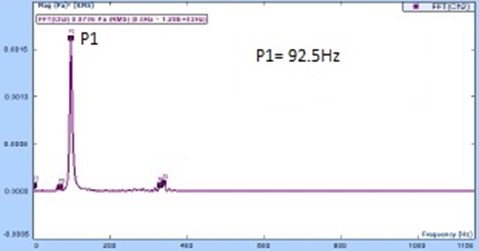
4 | Arbitrary – Closed | 92.5 | – | – |
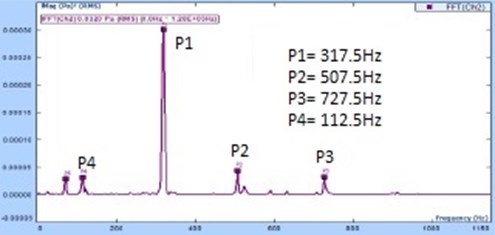
5 | Edge – Open | 317.5 | 507.5 | 70 |
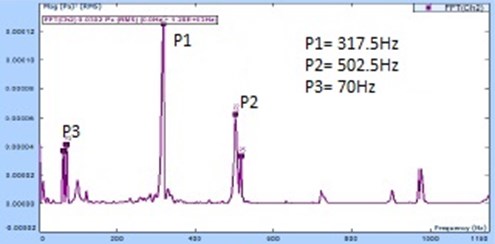
6 | Edge – Closed | 317.5 | 502.5 | 70 |
Hence we can conclude that there are only three unique tones found by this study.
a) Fig. 11refers to a unique “bol” that shall be known as Ghum.
b) Fig. 12 refers to a unique “bol” that shall be known as Dhap.
c) Fig. 13 refers to a unique “bol” that shall be known as Taal.
The arbitrary positions on the membrane, if excited, will yield the same tones as Ghum and Dhap in the conditions of mouth open and closed respectively, and an impact on the edge will always yield the same tone as Taal whether the mouth is open or closed. In practice, the Ghumot is played with impact at the center and edge for the two conditions of the mouth being open and closed.
5.2. Identification of the tones of the Tabla
For comparison, we studied the tones of the Tabla, a Hindustani membranophone instrument which is widely played and scientifically studied [2, 3]. This instrument consists of twin drums, the right handed “Tabla” which is a wooden cylinder with a tightly stretched goat-skin membrane, and the larger, left handed “Dagga” which is made of metal in a bowl shape with membrane stretched across the top. The tunable tabla membrane is attached to the shell by tight hide straps, with wooden pegs inserted to tune the instrument precisely in all directions. The pitch-tuned tabla produces the main rhythm which the bass dagga is used to add effects.
To conclusively understand and confirm the number of different possible tones, the Ghumot is compared to the Tabla, the smaller drum, as a standard. The latter is known to have five different tones viz. Ta, Tin, Din, Ti and Ri [3]. But the nomenclature of the tones for the Tabla is taken differently in different references. We have selected the nomenclature in this paper as Ta, Tin, Din, Ti and Ri. The microphone recorded FFT plots of the five tones of the Tabla are shown in the Fig. 14.
Fig. 14FFT plot for Ta, Tin, Din, Ti and Ri on the Tabla
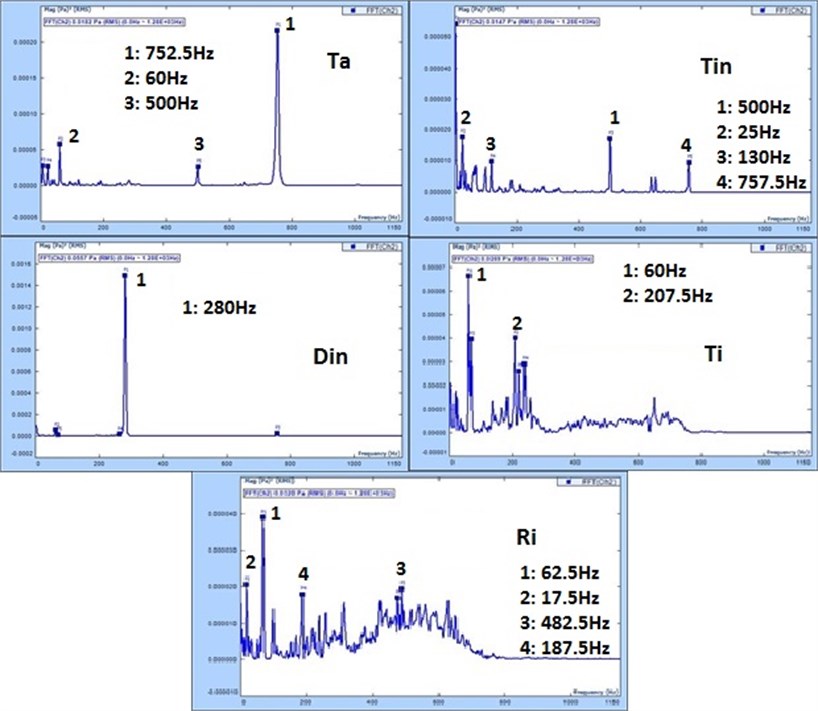
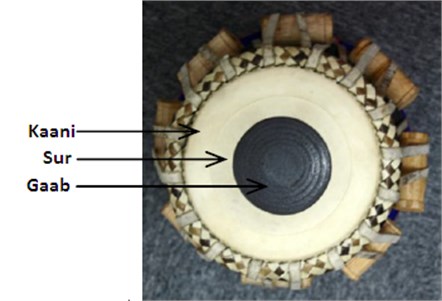
The five tones are distinctive in character with respect to each other and hence can be used as a template to define what a unique tone or ‘bol’ is for an Indian membranophone instrument. Comparing the three tones of the Ghumot to those of the Tabla, the FFT of the two tones for the impact at center of the Ghumot are similar in shape to that of the ‘Din’ of the Tabla. The edge impact tone of the Ghumot is dissimilar to all of the Tabla tones in terms of the frequency spectrum. This calls to question the reason for there being 5 separate tones for the Tabla whereas there are only 3 for the Ghumot. This can be answered by understanding the membrane in the Tabla which is shown in Fig. 15.
There are three regions on the membrane of different tension [10]; the Sur and Kaani regions are separated by a string under the skin. The latter sometimes is made of an additional strip of skin pasted on the base. The hand manipulates the particular region that is to be excited and mutes other regions according the desired sound. Hence, it is possible to create 5 tones on the Tabla by merely changing the dynamics of impact and the position.
Similarly, the Ghumot, as shown in this section, is capable of 3 unique tones of excitation, based on the position of impact and the condition of the mouth.
Fig. 15Tabla membrane top view showing three regions on the membrane
6. Conclusions
This study found that there are three tones for the Ghumot. The three tones shall henceforth be referred to as Ghum, Taal and Dhap. Ghum refers to the tone generated when the hand strikes the center of the membrane, with the mouth open. Taal refers to the hand striking the edge with the mouth open. Dhap indicates the unique tone of the hand striking the center of the membrane with the mouth closed. These are the only possible unique characteristic sounds that can be produced with the Ghumot as has been proved by a comparative study with a standardized Tabla.
The impact at the center for open and closed mouth conditions are different since the air column inside the cavity is closed in the second case, it reacts to the vibrating of the membrane by applying a pressure on it which counteracts the motion. These are two completely different physical constraints on the membrane.
The reason for edge impact response being different from that of the impact at the center can be attributed to the variation in tension in the membrane, which is lesser towards the center in an uneven distribution, as can also be concluded from the radial variation in frequency as per Fig. 10.
These three different physical constraints and conditions, of the membrane and air column, of the Ghumot, cause the presence of three unique tones i.e., Ghum, Taal and Dhap.
The acoustic analysis of Ghumot yields a fundamental frequency of 107.5 Hz which is excited by impact on the membrane at the center and the edge. The impact on the edge also excites 290 Hz as another resonant frequency of vibration of the Ghumot membrane.
In reference to the variation of the displacement and fundamental frequency with respect to position of the impact and measurement, it is found that the membrane displays highly non-linear and anisotropic characteristics. Another contributing factor for the non-linear behavior of the membrane is the variation in tension along its surface.
References
-
Fernandes André Rafael When the Curtains Rise... Understanding Goa’s Vibrant Konkani Theatre, Goa 1556. 2010.
-
Patel Aniruddh D., Iversen John R. Acoustic and perceptual comparison of speech and drum sounds in the North Indian Tabla tradition: an empirical study of sound symbolism. 15th International Congress of Phonetic Sciences, Barcelona, 2003.
-
Gillet Olivier K., Richard Gaël Automatic labelling of Tabla signals. ISMIR Conference, 2003.
-
Sir Raman C. V. The Indian musical drums. Indian Academy of Sciences Section-A, Vol. 1, Issue 3, 1934.
-
Spider-81 Manual. Crystal Instruments.
-
Accelerometer 352C34 Product Manual. PCB Piezotronics.
-
de Silva Clarence W. Vibration Monitoring, Testing and Instrumentation. CRC Press, 2007, p. 1-73.
-
Microphone 377B02 Product Manual. PCB Piezotronics.
-
Engineering Data Management Manual. Crystal Instruments.
-
Khan Tareef Hayat, Tang Joyce Wai-Chung, Variation in Portamenti in Bayan. British Journal of Humanities and Social Sciences, Vol. 7, Issue 1, 2012, p. 13-20.
About this article

The authors acknowledge the support and guidance of Mr. Cotin Savio in the research conducted.
