Abstract
The study of the wheels and worm systems has been the subject of several studies. An important parameter that is not mentioned is the method and the means of manufacture of the wheels and worm to answer a problem of maintaining machinery. We use reverse engineering techniques in order to create a CAD model of non-standard worm and wheel. The paper is concerned with the dynamic study of worm and wheels. Based dynamic model a test stand is developed in order to achieve diagnostics with vibration analysis. We present our results in this article regarding the acquisition and processing of vibratory signals from accelerometers placed on a test stand for worm and wheels. We use signal treatment techniques in order to extract statistical indicators that indicate the quality of the gears.
1. Introduction
Failures associated with gears represent the cause of extended outages and are typically caused by gradual deterioration and wear [1]. Publications of vibration analysis to gear fault diagnosis are widely available and the subject has been investigated for over four decades, however on the contrary, there is limited information on monitoring wheel and worm gear and this is reflected in the limited number of publications in the public domain [2, 3]. However, these types of gears are widely used in many industries and substantial cost may arise from their maintenance due to undetected failures.
However, the relative motion between worm and gear teeth is pure sliding, and so it should be expected that friction plays a dominant role in the performance of worm-gear driven systems. Frictions induce nonlinearities to the system dynamics and are usually the major source of motion disturbances and instability in feedback control [4].
Chung [5] proposed the dynamic models of worm gear, a dynamic model of the worm-gear set is developed and the comparison between the experimental results and the numerical results is also studied. The parameters of the dynamic model are adjusted by the findings of the comparison of the analysis and the experiment. Finally, the effects of moment-inertia of fly wheel, friction, rigidity of shaft and rigidity of gear tooth on the nonlinear behavior of the transmission mechanism are also studied.
Fang [6] developed the mathematical model of ZK-type worm-gear set that was based on the cutting mechanism and its tool parameters.
Practical gear applications often deviate from the theoretical conjugate forms however either due to manufacturing errors or to deliberate profile modifications [7]. In this order Damage of machine parts is a serious problem. It affects production fluency and causes financial losses due machine malfunction. Most threatened are components like transmission parts, tools or electronics.
In this paper, in a first step identification of non-standard operating parameters of the worm gear is the purpose. In this order techniques of reverse engineering are engaged. Emerging new techniques, devices and the globalization of the product market are pushing creativity to its limit [8]. One of these techniques is reverse engineering. His application in various fields is a regular activity in recent years. The reverse engineering approach can be considered methodology to reduce risk and satisfy constraints in systems engineering and different techniques in engineering design are used and employed at each stage in the reverse engineering. More advantage of reverse engineering is development of design solution quickly [9, 10]. Reverse engineering calls for the acquisition of dimensions on parts of various shapes (mechanical parts, medical devices…) and complexity potentially performed in any kind of environment.
Industrial operations are much depending on the rotating equipment to ensure continuous plant operation or production performance. Not to disturb the operation of the equipment based on wheel systems and worm not available on the international market. We need resources of implementation, measurement and diagnosis.
Monitoring of the health status of the machines becomes increasingly strategic activity to the extent that the emphasis is on quality, safety and non-pollution.
In a second step, the analysis of the behavior wheel and the worm by vibroacoustic techniques to give a quality index of operation and meet the criteria for machine maintenance. Why the development of a dynamic model of eight freedom degrees is an original work. The dynamic model used for the design of a test stand in order the acquisition of signals and be analyzed to validate our wheel and worm.
In this area, we are particularly interested in the vibration monitoring of gears from accelerometer signals. Almost all signal processing methods known to date has been used to study the gears [11-13]. Among them, we selected the temporal analysis for its simplicity and its ability to provide compact information easy to interpret some of which are independent of the signal amplitude and position of the sensor.
In this regard more detection indicators have been proposed and used as an aggregate measure of the vibrational level as the crest value, energy, RMS, the average value, and others. More specific indicators to defects inducing shocks, like those of bearings and gears, are also used, including the kurtosis and the crest factor. These indicators, being responsive to signal form, can detect the presence of the fault as they increase with the propagation of the length of the crack [14, 15]. Using the SVM model, it is possible to estimate the performance of the worm and the wheel [16].
2. Design process of worm and wheel gear
Design of gear drives is a subject of intensive research that has attracted the attention of many scientists and engineers [17]. The worm gears are widely used for transmitting power at high velocity ratios between non-intersecting shafts that are generally, but not necessarily, at right angles. It can give velocity ratios as high as 300:1 or more in a single step in a minimum of space, but it has a lower efficiency. The worm gearing is mostly used as a speed reducer, which consists of worm and a worm wheel or gear. Worm gear sets fall into one of four main types ZA, ZN, ZE (or ZI) and ZK types. The worm-type hob cutter is one of the most popular cutting tools used in industry for worm gear manufacturing [6].
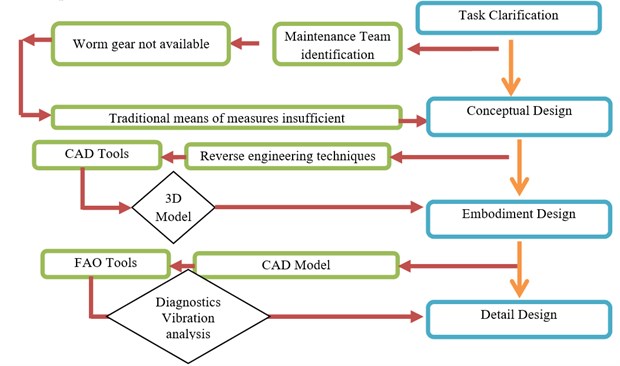
In our work the worm gear does not belong to standards and configurations available. To identify the different parameters (dimensions) the process of the Fig. 1. is adopted.
In a first level identification and analysis of need is performed. In a second step the identification of methods for generation of concepts is necessary. The design according to a method is the objective of the third step. The completion of the detailed design of the product with all parameters and a complete model is the goal of the last stage.
As we have announced our product is a wheel and worm. Worm gears transmit torques between the left shafts that usually intersect at 90°. They are used for transmission ratios between 5 to 100 and more by means of two components: the worm and wheel
The first step of our process is the analysis of need. Three (03) solutions:
– Make use of standard components, hence the need to design the gear depending on standard gears available in the market.
– Contacting specialists of the gear. Professionals working on plans or specifications and provide their customers with cut gears generation machines (hob, blade or tool pinion tool). In this case the quality of meshing is perfect but the costs prove (especially for single parts) often important.
– Designing and manufacturing is it’s himself parts, or gear train.
As a result of this step, the third case is our goal.
Before the validation of this phase behavior analysis of the worm by the vibrational techniques is required due to the reliability of the results of this technique. Because some cases manufacturers are making changes that do not respect the empirical laws and standardization. To solve this second situation, Stage 2 our design process is started for the generation of concepts.
The generation of concepts is based on needs analysis and trades available to achieve an accurate model of the wheel and worm system. Using conventional means, measures does not achieve our goal and this is due to the shape of the teeth. A second solution which converges to the use of reverse engineering techniques is imposed following the analysis performed following the process shown in Fig. 1.
The last phase of our design process is the development of the detailed design with the tools and methods related to this phase. We validate our approach with a robust design and a gateway with the maintenance job by vibration analysis.
Very often in the design or maintenance of a wheel and worm, we are exposed to fixed and unchanging parameters.
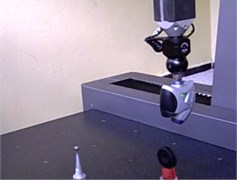
Our example shows case of a damaged transmission gear wheel. First step of replacing the damaged gear wheel is to get his CAD model. Our example study assumes absence of original part CAD model in the cause is not standardized parts. To create our model should be used reverse engineering techniques as 3D scanning as shown in Fig. 2. There are many factors that are affecting 3D scanning processes. One from them is reflective ability of components surface. Expectation for quality 3D scan is matt, bright surface. Problem of optical scanning systems are for example high shine of surfaces like chrome-plated surfaces or also black surfaces that doesn’t reflect laser ray.
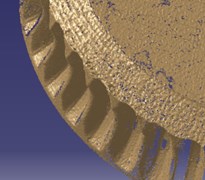
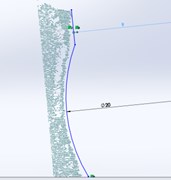
Surface color of our example part is theoretically proper for 3D scanning; however, there was a problem with point´s cloud by scanning of unadjusted surface. Those inaccuracies reside mainly about tooth system (Fig. 3(a)). It came there to uncontrolled laser ray scattering. That caused incorrect scanning. This problem looks like points in space, which doesn’t exist in real (Fig. 3(c)). Number of points scanned like this is big and it causes really serious problem by CAD modification for rapid prototyping processes.
One option to eliminate this unwanted effect is to eliminate it by the points overlay reduction, which allows us under specific options to automatically eliminate the unwanted or incorrect points.
Fig. 1Design process of worm and wheel
As shown in Fig. 2, the process in reverse engineering (RE) starts from collecting data by digitization parts and generating a cloud points. System of digitization is very important and each application or part requires the use of specific system. Treatment of cloud points in CAD environment in order to create a 3D CAD model of parts. The main purpose of RE is to convert the discrete data obtained from the model into continuous model.
Fig. 2General diagram of reverse engineering [18]
![General diagram of reverse engineering [18]](https://static-01.extrica.com/articles/17203/17203-img2.jpg)
The final stage of our design process aims to develop the detailed design with the tools and methods related to this phase. We validate our approach with a robust design and a gateway to the maintenance profession.
Very often in the design or maintenance of a wheel and worm, we are exposed to fixed and unchanging parameters.
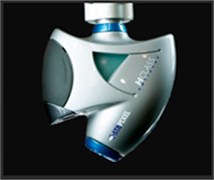
We used in this paper a three-dimensional measuring machine Trimek (Fig. 3(a)) type Spark M3 pledge. This machine is equipped with a laser sensor OptiScan (Fig. 3(b)).
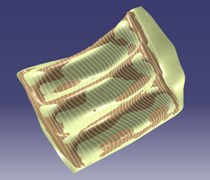
During the reconstruction process of the CAD-wheel model, after the step of filtering the noise, the point cloud undergoes triangulation giving a surface mesh which has holes (for both environments). These holes are due to the non-selection of certain items belonging to the cloud. After filling the holes, the mesh is smoothed by increasing the number of triangles. From the resulting refined mesh (Fig. 3(d); Fig. 3(f)), a grid of parametric curves is created to overcome the rough edges of the mesh and proceed to the smoothing phase. Then a curve fitting is made to reconstruct the 3D-CAD model.
Fig. 3CAD model of worm and wheel by reverse engineering techniques
a)
b)

c)
d)
e)
f)
The goal of treatment is to achieve manage manufacturing parameters on measurement of the toothed wheel. Validation work is based on a four-phase design process to minimize design cycle times. The goal is to make a bridge to the maintenance profession equipment where the components are complex to achieve by conventional means. The difficulty in using conventional means to recover the dimensions pushed us worm adapting the three-dimensional reconstruction of the wheel in a CAD environment, and the study on the design. It is in particular the result of a 3D reconstruction process and testing.
This result requires a theoretical and practical validation. To do the development of a dynamic model of the wheel and worm system is a first step, followed by completion of a test stand that uses dynamic modeling results. Worm and wheels tests are performed from the CAD model
Operating CAD models allowed us to achieve the wheel and worm system not standardized with the means available. The result is shown in Fig. 4.
To validate our product a test stand is required. For carrying out the test stand for the acquisition and operation of our system is required to determine the dynamic model of the wheel and worm, this is the goal of the next step.
Fig. 4The exploitation of reverse engineering results to manufacture the wheel and worm
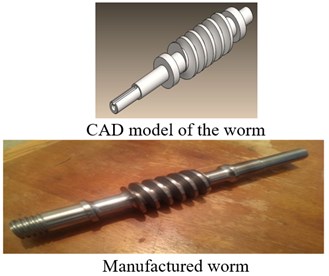
a) Worm
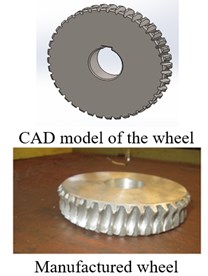
b) Wheel
3. The dynamic models of worm gear
In order to establish the dynamic model of worm gear, some physical characteristics must be considered. First of all, the parametric excitation due to the meshing stiffness fluctuation and transmission error variations, caused by the tooth elastic deflections, must be included in the model.
The influence of the number of degree of freedom is large and cannot be neglected; taking into account the profile defects, however taking into account profile fault is considered differently [19]. Thus, it is necessary to make a compromise between simplicity and accuracy of the model. However, the objective of the model developed to be fast and adaptable to many situations. The authors also compare the amplitudes of the angular acceleration obtained by the models in six and eight degrees of freedom with experimental data obtained by Parey [20]. This validation shows greater correlation to the results in six degrees of freedom.
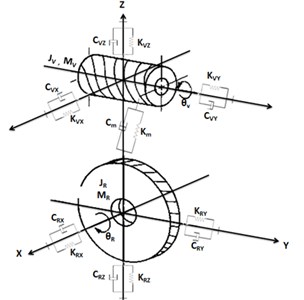
Comparing to our case (wheel and worm system), we see that the only difference is that in the developed models, the teeth either the wheel or the pinion, are rights that is to say the angle of inclination is equal to zero, so the contact force is on the plane perpendicular to the axis of rotation. But in the case where the teeth are inclined at an angle (cylindrical worm wheel), the contact force is in the space, that is to say it has three components (following , and ), as is shown in Fig. 5. The three components of the contact force (force engagement), will create three translations along , and (three degrees of freedom) for the worm and three for the wheel. So in total, eight degrees of freedom, this is the model that will be used for our study; it is shown in Fig. 6.
To get this information, the selected model will be based on a system a minimum of eight degrees of freedom. The models including a number of degrees of freedom than eight require them to know about details of the frame, the motor and load. This data is sometimes difficult to know and modeling effectively. So as not needlessly overload the model.
The model of Fig. 6 can be modeled in the form of eight equations, each corresponding to one degree of freedom:
Fig. 5Modeling the contact force in the wheel and worm [9]
![Modeling the contact force in the wheel and worm [9]](https://static-01.extrica.com/articles/17203/17203-img11.jpg)
Fig. 6Modeling with eight degrees of freedom
Such as:
Thereafter, writing the equations in the matrix system, we obtain a system of coupled equations where q is the generalized displacement degrees of freedom:
Thus, by returning on the left, the terms for variables in the equation (13), we obtain a new system whose force is constant:
The matrices [], [] and [], presented below, are the mass matrices respectively, damping and rigidity of the system, and indeed show the coupling between the various degrees of freedom. These matrices depend on the following values:
: The friction coefficient.
: The inclination angle.
: The pressure angle of the gear.
and : The inertia of the wheel and the worm.
and : The weight matrices for the wheel and the worm.
, and : Damping of the support of the worm following , and .
, and : Damping of the support of the wheel following , and .
, and : The rigidities of the supporting worm according to , and .
, and : The rigidities of the supporting wheel according to , and .
Development test bed for vibro-acoustic analysis is based on the dynamic model with 8 DOF and the results of the simulation.
4. Experimental procedure
In the context of an experimental validation of our product (wheel and worm), achieved the test stand is the basis for the study of a wheel worm speed reducer. All components of a vibratory measurement chain were set up to allow the acquisition, preprocessing and storage of collected data. The analysis results can then be undertaken using numerical tools developed in our work.
Whilst there are varied vibration diagnostics technique available to use. Three techniques: Spectral Kurtosis, envelop analysis and a few statistical measures such as Kurtosis, R.M.S. and FM4 [21]. The techniques selected for this investigation employed a very established diagnostic technique (enveloping), a relative modern diagnostic technique (Spectral Kurtosis) and a few traditional statistical measures.
In order to guarantee the correct tests, the test procedure was done according to the developed, instructions and statistic planning is stated. So that the measurements will be always made in the same way, the measuring method should be standardized by means of a written procedure which will describe how to carry out the measurements.
4.1. Test equipment
A measuring test stand, self fabricated as shown in Fig. 7 was employed in this investigation, based on steel body was constructed aiming to determine worm gear’s error.
The worm and wheel used in this investigation is self manufactured by using reverse engineering results as shown in Fig. 4.
Table 1 show different parts are used in the tests in this paper.
Experimental setup is shown in Fig. 1 and Fig. 7 and the specifications of the worm-gear set are listed in Table 1.
Table 1Characteristics of different parts of Test Stand.
Part | Characteristics | ||||
Worm | Number of threads | Helix angle | Module | Material | |
1 | 13° | 3 | Steel, Aluminum | ||
1 | 5° | 1.5 | Steel, Aluminum | ||
Wheel | Number of teeth | Helix angle | Module | Pressure angle | Material |
50, 30, 20, | 13° | 3 | 20° | (Steel, Bronze, Aluminum, POM) | |
50, 30, 20, | 13° | 1.5 | 20° | (Steel, Bronze, Aluminum, POM) | |
50, 30, 20, | 5° | 3 | 20° | (Steel, Bronze, Aluminum, POM) | |
50, 30, 20, | 5° | 1.5 | 20° | (Steel, Bronze, Aluminum, POM) | |
Test stand | Variable center distance Variable speed of the engine | ||||
To change the number of teeth and the module and the angles of the helices our design is based on the concept of variable center distance. For each change is disassembled the couple used and will be replaced by a new couple.
4.2. Initial vibration characteristics
This measurement campaign is to collect and carefully preserve the original vibration data. They will serve as absolute reference for tracking progress of the installation and the various subsequent studies.
For scanning signals, we chose by default the following settings:
• Sampling frequency fech = 1.6 [kHz];
• Number of samples Nech = 8192.
These parameters can be modified within the limits of the capacity of the equipment used.
We have taken 06 different modes of behavior of the system, which should be diagnosed (Table 2).
Fig. 7Test stand developed (based 8 DOF)
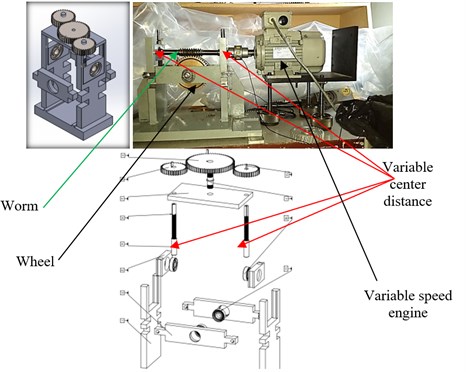
Table 2Sample of six cases for study
Modes | State of the wheel for testing | State of the worm for testing | |
Steel | Bronze | Steel | |
Classe1 C1 | Good healthy state | – | Good |
Classe2 C2 | – | Good healthy state | Good |
Classe3 C3 | – | Broken tooth | Good |
Classe4 C4 | Center distance | – | Good |
Classe5 C5 | – | – | Default of the profile |
Classe6 C6 | Center distance | – | Default of the profile |
4.3. Presentation of the measuring chain
To allow control of the worm gears manufactured by reverse engineering techniques, a laboratory test stand is designed, for the study of various common defects of worm gears. Two measuring points were chosen on two bearings being located on the two shafts of test stand.
The measuring chain is composed of the following main elements:
– Accelerometers (brand Bruel & Kjaer), Model 4514-B, Sensitivity 9.529 [mV/g], fixing method: Magnetic);
– Module Controller (brand Bruel & Kjaer type 7536);
– Card Acquisition (brand Bruel & Kjaer type 3109);
– Processing software (brand Bruel & Kjaer, name: PULS- Version 18.0).
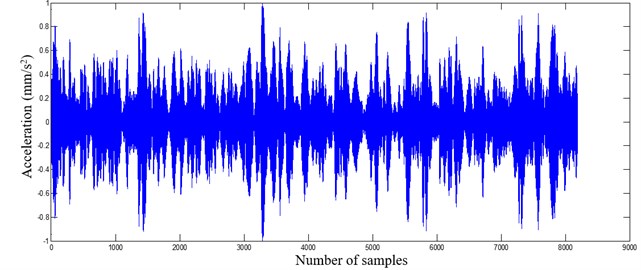
Starting from these experimental signals as shown in Fig. 8 with signal processing techniques mentioned before, we will extract the statistical indicators that are the basis of our form of recognition by classification approach.
Fig. 8Acceleration signal of a healthy worm gear
5. Results and discussion
5.1. Reverse engineering
Results obtained by Reverse engineering techniques are cloud of points. Exploiting this cloud points in design process is an increasing trend in the design process structure and Computer Aided Design practice, caused primarily by the availability of powerful algorithm developed able to generate the cloud points from files. This tool is the first contribution of this work in order to enrich the design process stages of worm gear.
Using cloud points to manufacture the worm gear have been successfully implemented in CAD environment supporting by CNC environment.
Dimensional 3D sketches in cloud points are finalized by engineers after collected data. This 3D sketches are prepared in the upstream design stages. Preparation the upstream manufacturing process by Rapid prototyping of 3D CAD model and CNC techniques obtained in CAD environment product as shown in Fig. 3 and Fig. 4.
Product obtained and his influence in amelioration the job of maintenance is the interest contribution of the new design process; different results obtained from our work are interesting and their use in machines is ameliorated.
5.2. Dynamic studies
The developed model is a system of differential equations of second order nonlinear. The resolution system is performed using the “Matlab” software. The numerical results of the vibratory responses of the model to eight degree of freedom studied; show that the amplitude of vibration in the bearings is proportional to the rigidity as shown in Fig. 9. Against the transmission error decreases as shown Fig. 10.
Fig. 9Amplitude of the temporal response Xvt (Steel-POM) (Steel-AL) et (Steel-Bronze)
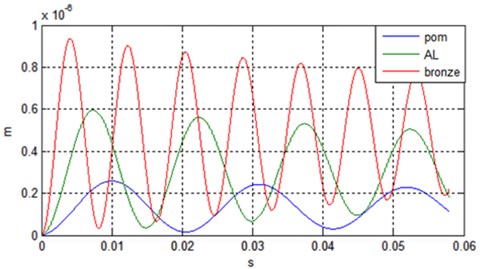
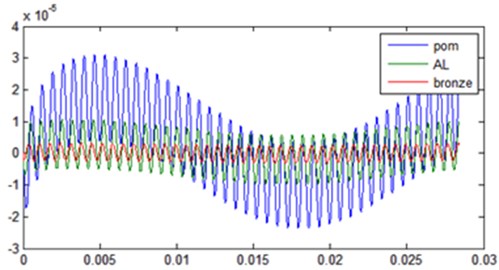
Fig. 10Time representation Transmission error (Steel-POM) (Steel-AL) et (Steel-Bronze)
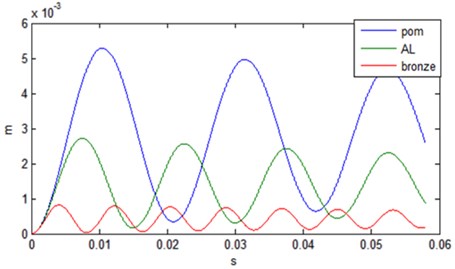
Table 3 summarizes the characteristics of the transmission that we used for the simulation.
The numerical results of the vibrational responses with eccentricity defects are periodic (period ) Fig. 11 and Fig. 12.
Table 3The characteristics of the transmission
Parameters | Value | Parameters | Value |
(kg) | 0.2 | 0.0001 | |
(kg) | 1.13257 | 0.007 | |
(m) | 0.01451 | 0.002 | |
(m) | 0.1008 | 0.0005 | |
(kgm2) | 0.0070861 | 0.005 | |
(kgm2) | 0.0164 | 0.001 | |
(deg) | 20° | 0.0008 | |
(deg) | 7° | (tr/mn) | 3010 |
(kg) | 0.137 | (N.m) | 40 |
(kg) | 0.105 | (N.m) | 150 |
(m) | 0.0001 | (m) | 0.0001 |
Fig. 11Amplitude of the temporal response Xv(t) (Steel-POM) (Steel-AL) et (Steel-Bronze)
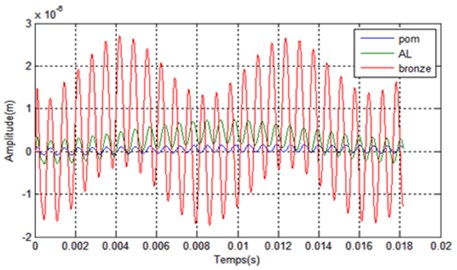
In the case where there are no defects eccentricities, the only internal source of excitation is the mesh stiffness. This stiffness is constant in this case. The temporal analysis shows firstly, that the amplitude of the vibrations recorded the bearings levels is greater in the case of a gear Steel-Bronze. On the other hand, the error of dynamic transmission is greater in the case of a gear steel-POM (Polyoxymethylene). The simulation of excitation induced eccentricity default, shows that temporal responses to levels of bearings and transmission error becomes periodic (period ). This last result is very interesting because it can diagnose the faults of eccentricity when monitoring wheel gear and worm, knowing either: error caused transmission or when the displacement on one of the bearings involved in the transmission.
Fig. 12Time representation Transmission error (Steel-POM) (Steel-AL) et (Steel-Bronze)
5.3. Vibration analysis and the relationship between experimental and numerical results
Application of SVM classifier:
For each process, detection or identification of defects, construction of the classifier can be divided into three main stages:
• Acquisition of gross vibratory signals from accelerometers and adequate treatment of these signals and data extraction from the appropriate monitoring and diagnostic indicators.
• Choice of attributes and classes and formatting the data set.
• Application of SVM classification algorithm.
The data are collected at five different speed 1000 rpm, 1250 rpm, 1500 rpm, 1750 rpm and 2000 rpm. Data are recorded for 01 seconds in each case making large amount of data.
Each case measurement is repeated ten Eq. (10) times.
Example Class01 as shown in Fig. 13.
Fig. 13Statistical indicators from the signal in Fig. 8
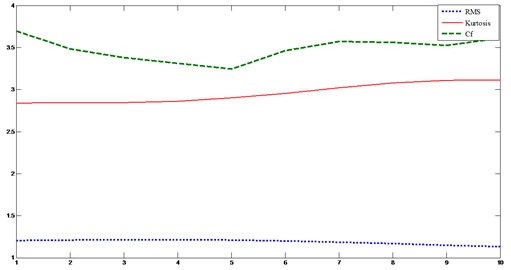
This class includes a steel wheel which has 50 helical teeth inclined at an angle of 13° engaged with a steel worm in one thread. This mode presents the healthy state of the wheel and worm. We will build on these statistical indicators for the classification of gears (healthy and deficient). Note that the kurtosis values are at around 3, which mean that the signal does not contain pikes due to defects in addition the crest factor is below the critical value 6. We present the results of SVM on a database which includes the 06 classes of gear faults.
In our study we used the values of the indicator “” and “kurtosis” from treatment of experimental signals, this choice is motivated due to his excellent score and sensitivity for the detection of the literature. We apply a nonlinear SVM model with kernel (RB). This kernels that provides the best rate of correct classification and the slightest error.
Fig. 14SVM classification (class C2)
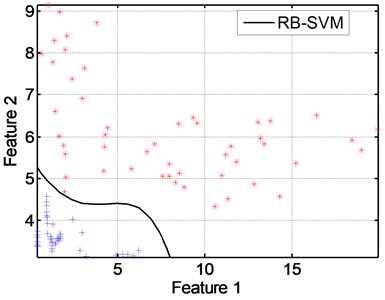
The classes represent the gear state are designated in Table 2.
Cinematic Features: The worm 01 one thread (directly related to the engine). The wheel (Bronze or steel): 50 teeth. Engine speed: 1500 rpm (25 Hz).
Database: This base represents a vibratory diagnosis; it contains 06 classes, each represented by statistical indicators RMS size and Kurtosis 100 each.
– the percentage of learning is 60 %;
– the percentage of the test is 40 %.
From Table 4, the elements of the diagonal of the confusion matrix indicate the number of correctly classified examples. The second elements of the second line indicate the number of examples belonging to the C2 class and have the same class as the SVM classifier. For against, the first members of the line indicate the number of examples belonging to the C2 class but are misclassified by the SVM classifier.
For evaluation of a classifier we present example, the classification rate and the learning error based on the number of classes. Knowing that the classification rate is the ratio between; the number of examples correctly classified by the algorithm; and the total number of examples that makes up the dataset.
Fig. 15SVM classification (class C3)
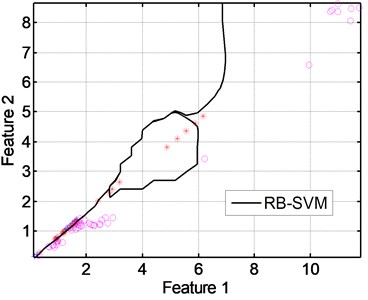
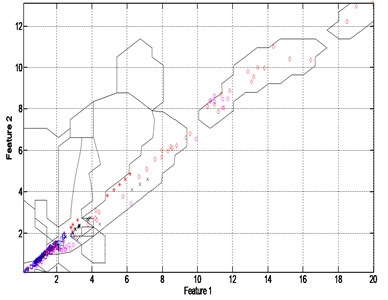
Fig. 16SVM classification (class C6)
Comparison of the results from simulation with those obtained in the real tests using reverse engineering and test stand based vibration analysis reveals an acceptance results. This results show the relationship between experimental and numerical results.
In first, the parts of worm and wheel manufactured by available resources are based CAD model and reverse engineering techniques as shown in Fig. 3 and Fig. 4. The numerical result in SolidWorks by the 3D CAD model is reflected by real parts.
Secondly, the mathematical model (equation 1 to 13) is used to building the test stand in order to achieve vibration analysis of worm and wheel parts. Using SVM classification and confusion matrix we can identify and selected the deficiency parts of worm and wheel. This identification is based the values of the indicator “” and “kurtosis” from treatment of experimental signals as shown in Fig. 13 and Fig. 14.
The confusion matrix shown in Table 4; is a powerful tool that allows selection the good part or failing.
Table 4The confusion matrix
C1 | C2 | C3 | C4 | C5 | C6 | Total | |
C1 | 60 | 0 | 0 | 0 | 0 | 0 | 60 |
C2 | 7 | 53 | 0 | 0 | 0 | 0 | 60 |
C3 | 0 | 3 | 53 | 0 | 4 | 0 | 60 |
C4 | 0 | 0 | 9 | 47 | 4 | 0 | 60 |
C5 | 0 | 2 | 10 | 1 | 47 | 10 | 60 |
C6 | 0 | 0 | 9 | 4 | 9 | 38 | 60 |
Total | 67 | 58 | 71 | 52 | 64 | 48 | 360 |
6. Conclusions
The objective of this study was to evaluate a relation between reverse engineering techniques to manufacturing a worm gears and vibro-acoustic analysis of the worm gear. The following conclusions were obtained:
– good parts not standardized of worm and wheel;
– original dynamic models of 8 DOF;
– a measuring test stand, self fabricated;
– chain measurement of vibration;
– data base of signal acquisition.
This research reveals more understanding the roles of reverse engineering and process design to fabricate nonstandard worm gear and the vibration diagnostics in predicting and diagnosing the machine faults.
Given diagnosis of worm and wheel not standardized with vibroacoustic analysis is the way to identification a different symptom and existence of defect. The SVM classification has allowed us to determine and predict the defects of our system.
References
-
Ebrahimi Ebrahim Developing an intelligent fault diagnosis of MF285 tractor gearbox using genetic algorithm and vibration signals. Modern Mechanical Engineering, Vol. 3, 2013, p. 152-160.
-
Elforjani M., Mba D., Muhammad A., Sire A. Condition monitoring of worm gears. Applied Acoustics, Vol. 73, Issue 8, 2012, p. 859-863.
-
Vähäoja Pekka, Lahdelma Sulo, Leinonen Jaakko On the condition monitoring of worm gears. Engineering Asset Management, Proceedings of the 1st World Congress on Engineering Asset Management, 2006, p. 332-343.
-
Yeh T.-J., Wu Feng-Kung Modeling and robust control of worm-gear driven systems. Simulation Modelling Practice and Theory, Vol. 17, 2009, p. 767-777.
-
Chung M. Y., Shaw D. Parametric study of dynamics of worm and worm-gear set under suddenly applied rotating angle. Journal of Sound and Vibration, Vol. 304, 2007, p. 246-262.
-
Fang Hong-Sheng, Tsay Chung-Biau Mathematical model and bearing contacts of the ZN-type worm gear set cut by oversize hob cutters. Mechanism and Machine Theory, Vol. 35, 2000, p. 1689-1708.
-
Townsend D. P. Dudley’s Gear Handbook. McGraw-Hill, New York, 1992.
-
Ye Xiuzi, et al. Reverse innovative design – an integrated product design methodology. Computer-Aided Design, Vol. 40, 2008, p. 812-827.
-
Yoon Tae-Hun, et. al. A system design process tailored for reverse engineering and reengineering. International Journal of Engineering Science and Technology, Vol. 2, Issue 10, 2010, p. 5780-5788.
-
Benko P., Kos G., Varady T., Andor L., Martin R. Constrained fitting in reverse engineering. Computer Aided Geometric Design, Vol. 19, Issue 3, 2002, p. 173-205.
-
Qiao Wei, Lu Dingguo A survey on wind turbine condition monitoring and fault diagnosis. Part II: signals and signal processing methods. IEEE Transactions on Industrial Electronics, Vol. 62, Issue 10, 2015, p. 6546-6557.
-
Pryor Anna H., Mosher Marianne, Lewicki David G. The application of time-frequency methods to HUMS. The American Helicopter Society’s 57th Annual Forum, Washington D.C., 2001
-
Engin Seref Naci, Gülez Kayhan, Badi M. N. M. Advanced signal processing techniques for fault diagnostics – a review. Mathematical and Computational Applications, Vol. 4, Issue 2, 1999, p. 121-136.
-
Igba Joel, Alemzadeh Kazem, Durugbo Christopher, Eiriksson Egill Thor Analysing RMS and peak values of vibration signals for condition monitoring of wind turbine gearboxes. Renewable Energy, Vol. 91, 2016, p. 90-106.
-
Dube Abhinay V., Dhamande L. S., Kulkarni P. G. Vibration based condition assessment of rollingelement bearings with localized defects. International Journal of Scientific and Technology Research, Vol. 2, Issue 4, 2013.
-
Bharati Mokara, Poornima V. Deepika, Jyothrimai S. A performance prediction of worm-worm wheel and its multi objective design parameter optimization based on genetic algorithm. International Journal of Scientific and Research Publications, Vol. 5, Issue 2, 2015, p. 1-6.
-
Litvin Faydor L., Gonzalez-Perez Ignacio, Yukishima Kenji, Fuentes Alfonso, Hayasaka Kenichi Design, simulation of meshing, and contact stresses for an improved worm gear drive. Mechanism and Machine Theory, Vol. 42, 2007, p. 940-959.
-
Barbero Basilio Ramos, Ureta Elena Santos Comparative study of different digitization techniques and their accuracy. Computer-Aided Design, Vol. 43, 2011, p. 188-206.
-
Sawalhi N., Randall R. B. Simulating gear and bearing interactions in the presence of faults. Mechanical Systems and Signal Processing, Vol. 22, Issue 8, 2008, p. 1924-1951.
-
Parey A., El Badaoui M., Guillet F., Tandon N. Dynamic modelling of spur gear pair and application of empirical mode decomposition-based statistical analysis for early detection of localized tooth defect. Journal of Sound and Vibration, Vol. 294, Issue 3, 2006, p. 547-561.
-
Faris Elasha, Cristobal Ruiz-Cárcel, David Mba, Goh Kiat, Ike Nze, George Yebra Pitting detection in worm gearboxes with vibration analysis. Engineering Failure Analysis, Vol. 42, 2014, p. 366-376.
About this article

