Abstract
In this paper, deep belief networks were used for localization of acoustic emission events on ship hull structures. In order to avoid complex and time consuming implementations, the proposed approach uses a simple feature extraction module, which significantly reduces the extremely high dimensionality of the raw signals/data. In simulation experiments, where a stiffened plate model was partially sunk into the water, the localization rate of acoustic emission events in a noise-free environment is greater than 94 %, using only a single sensor.
1. Introduction
Shipping has been the largest carrier of freight throughout recorded history, serving more than 90 % of global trade by carrying huge quantities of cargo, fuel etc., cost-effectively, cleanly and safely [1]. Apart from commodities, more than 400 million sea passengers a year travelling through European ports, passenger ships and ferry services have a direct impact on the quality of life of citizens in islands and peripheral regions [2]. Damage to the ship hull is among the top five causes of vessel sinking [3], causing huge loss of human life (about 100 lives are lost on cargo ships in Europe every year) and pollution of the seas and coastal areas. A ship’s life-cycle is estimated to at least 30 years of operational service [2] and maintenance and condition servicing is an essential part of maritime industry. The existing repair and maintenance practices, which are based on periodic inspection during dry and wet dock, needs to be improved in order to decrease the number of accidents caused by degradation of the ship hull structure. It is obviously important to detect, identify and take early corrective action, in case of hull structural failures.
In the direction of real-time health monitoring, early damage detection and identification to ship hull, the processing of Acoustic Emission (AE) events can be efficiently used whilst in service and throughout the service life. AE is the phenomenon of radiation of acoustic (elastic) waves in solids that occurs when a material undergoes irreversible changes in its internal structure, for example as a result of crack formation due to aging [4]. The ship hull structures can be monitored by AE techniques [5-7] during the application of an external stress. The external dynamic stress introduced by the sea-waves and cargo movements in the outside and in the inside of shell respectively is an excellent source of AE phenomena.
The AE localization problem can be tackled as a typical classification problem [6, 8]. In this work, the classification problem was solved, using a deep learning paradigm. Deep Belief Networks (DBNs) [9] are employed with the results being competitive to our previous works [6, 8]. Even though DBNs are known to be able to map the raw input space into a lower dimension feature space, in this work a very simple preprocessing stage was involved to reduce the very high dimension of the input space. More specifically, the Discrete Cosine Transform (DCT) [10] was combined with Piecewise Aggregate Approximation (PAA) [11, 12] to transform the original AE signal from the time domain to a more tractable representation that could be used by the DBN classifier.
The rest of the paper is structured as follows: Section 2 shows in summary all the involved methods including DCT and PAA for feature extraction and DBN for classification/localization of the AE source. In Section 3, the experimental set up is presented while Section 4 summarizes the experimental results. In the end Section 5 concludes the paper.
2. Proposed procedure
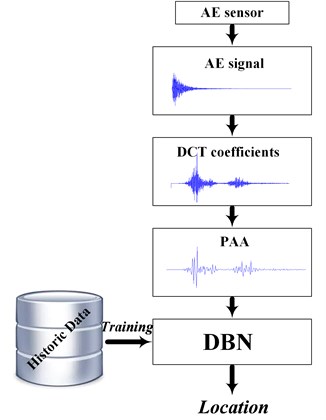
The overall approach is depicted in Fig. 1. The raw AE signal was transformed using the DCT. The DCT coefficients were then “averaged” using PAA and fed into a DBN which performs the final classification step, assigning every new measurement into one out of three predefined classes. The following section briefly presents the background theory of each involved step.
Fig. 1The proposed localization procedure
2.1. Discrete Cosine transform
DCT is usually used for compression purposes [13]. However, it can also be used for feature extraction, transforming the original time domain signal into DCT coefficients [13]. There are many DCT implementations. However, one of the most common and popular is the following [13, 14]:
Given a discrete signal of length , let be:
then the Discrete Fourier Transform of is:
and the DCT of is given by:
where .
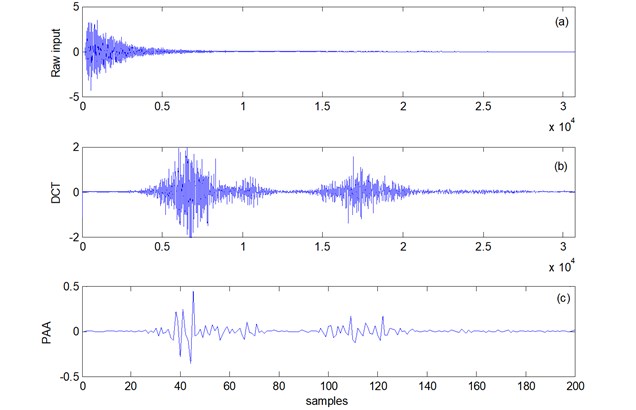
The result of the application of the DCT to a raw AE signal is shown in Fig. 2(b). The DCT creates a sequence of coefficients that have the same length as the original signal. Usually, for compression purposes, only a fraction of them is retained. In this work, a different path was followed, applying PAA to come up with a reduced representation instead of the standard approach of retaining only part of the DCT coefficients and setting the rest equal to zero.
2.2. Piecewise aggregate approximation
PAA, was independently introduced by [11], and by [12]. Given a discrete signal of length (or a time series – since both terms were used in the literature) PAA creates a representation of length , with:
Practically speaking, PAA, divides the series into equal sized windows taking the mean value of the data falling within a frame. If is not divided exactly by , a slightly modified formula applies [15]. In practice the same result can be achieved, as it was originally proposed by Dr. Wei where a time series times longer than the original time series is created by adding zeros between each consecutive samples of the original signal and then applying PAA in the augmented signal [16]. The application of the PAA to the sequence of the DCT coefficients can be seen in the bottom of Fig. 2.
Fig. 2AE signal processing: a) raw AE signal, b) the DCT representation of the AE signal and c) the PAA representation of the DCT coefficients
2.3. Deep belief networks
Deep neural networks have drawn much attention lately, and have been successfully applied in numerous applications and competitions [17]. On the other hand very few applications can be found in the available literature in the field of condition monitoring. In [18] and [19] DBNs were used for the diagnosis of faults in power transformers, and reciprocating compressor valves.
DBNs consist of a stack of Restricted Boltzman Machines (RBMs) [9]. RBMs are generative models that are used for feature generation within the DBN architecture. A DBN usually includes a number of RBMs, which constitute its hidden layers and a final layer of softmax units in case it is used for classification purposes.
RBMs are trained in an unsupervised manner (without using the corresponding labels) one layer at a time. Once training is finished the stacked RBMs and the weights of the final layer are fine tuned in a supervised manner using the labels of the training set. This sequential training allows quite deep architectures to be trained within reasonable amount of time.
3. Experimental set-up
A Stiffened Plate Model (SPM) was used to simulate the side shell of a ship hull structure (Fig. 3). The outside side shell was dyed with oil-paint in order to make as much as possible better simulation of the real outside ship’s side. Physical Acoustics Corporation R15-Alpha sensors were used to detect the wave in the steel stiffened plate placed on four different locations (Fig. 4). In the simulation experiments, the external plate of the SPM sank into water, recreating close to real-life conditions during ship cruising. Acoustic reflections at the end of the SPM were reduced by wrapping the ends in putty. The putty at the edges of the SPM prevents the pass of the water in the inside side shell of the plate. The putty was dyed with oil-paint for better water-tightness and to prevent putty corrosion. The fixed boundary condition of the model was obtained by clamping the side shell by three heavy bases. Insulation material was placed between the following: the SPM and the three bases, the three bases and the bottom of the tank, and the bottom of the tank and the floor to eliminate external noise. A detailed description of the experimental set up can be found in [8].
Fig. 3The tank with the stiffened plate model under test
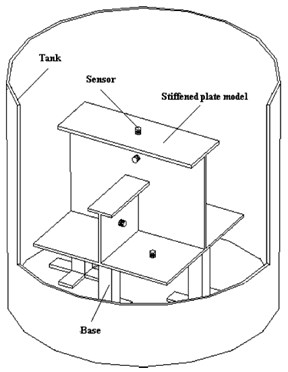
Fig. 4The stiffened plate and the sensor positions
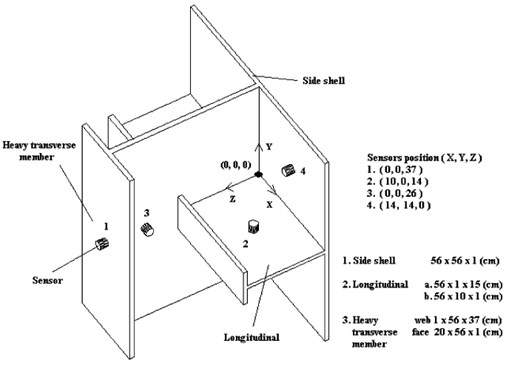
Τhe AE source was simulated with a Piezoelectric Pulse-Generator and in each location ten repeated measurements were recorded. Three locations/classes were simulated: (i) AE-source in the welding seam between the longitudinal and the heavy transverse member (web), (ii) AE-source in the welding seam between the longitudinal and the side shell, (iii) AE-source in the welding seam between the heavy transverse member (web) and side shell. The collected signals, each one 30720 samples long, from four different AE sensors were used for the evaluation of the proposed method.
4. Results
As it was mentioned in the previous section, ten signals were recorder from locations as near as possible to the welding seam, in 15 different locations for each class. Therefore, a total of 450 recordings were collected from each one of the four sensors (Fig. 4). In order to test the discriminative capabilities of the four different sensor positions, the recordings from each sensor were treated alone. The classification performance of the proposed procedure for each one of the four sensors was evaluated using 10 fold cross validation [20].
After an initial experimentation phase from the original PAA representation which reduced the input vector to 200 samples, only the first 100 samples/features were selected to be fed to the DBN, because they have on average higher values for the Area Under the Receiver Operating Characteristic Curve (AUC) [21].
The architecture of the DBN was also performed with an initial experimentation phase without fine tuning and a 100-50-10-3 was selected, using the rule of thumb that smaller layers should be used as we move from the input to the output, to force the neural network to generalize rather than overfit [22].
The results are summarized in Table 1, while Table 2 shows (aggregated) the confusion matrix for the case of sensor 4.
Table 1Classification performance
Sensor | Overall accuracy |
Sensor 1 | 92.00 % |
Sensor 2 | 64.00 % |
Sensor 3 | 93.56 % |
Sensor 4 | 94.67 % |
Table 2Aggregate confusion matrix for sensor 4
Predicted class | ||||
A | B | C | ||
True Class | A | 145 | 3 | 2 |
B | 9 | 140 | 1 | |
C | 5 | 4 | 141 | |
5. Conclusions
This article presented the potential use of DBNs for localization of AE events on the extreme complex ship hull structures. To the best of our knowledge, this is the first application of a deep learning paradigm in this field.
Robust AE localization rates, greater than 94 %, were achieved using only a single sensor. In fact, the current results are comparable and even better than our previous studies [7, 8], where all signals (from the 4 sensors) were used for the feature extraction module. This is probably due to the advanced discriminative power of the DBNs. Nevertheless, further investigation is needed before the proposed method can actually be used in industrial applications.
References
-
The International Maritime Organisation (IMO), www.imo.org, 2016.
-
The European Union’s Maritime Transport Policy for 2018, European Commission Report. http://ec.europa.eu/transport/themes/strategies/2018_maritime_transport_strategy_en.htm, 2016.
-
International Union of Marine Insurance (IUMI). Hull Casualty Statistics, http://www.iumi.com/, 2016.
-
Miller K. R., Hill E. V. K., Patrick O., Moore O. P. Nondestructive Testing Handbook. Third Edition. Vol. 6, Acoustic Emission Testing, 2015.
-
Kappatos V., Dermatas E. Acoustic Emission Testing for the Monitoring and Detection of Damage to Ship Hull Structures. Theory and Uses of Acoustic Emissions, Nova Publishers, 2011.
-
Kappatos V., Georgoulas G., Stylios C., Dermatas E. Evolutionary dimensionality reduction for crack localization in ship structures using a hybrid computational intelligent approach. International Joint Conference on Neural Networks, 2009, p. 1531-1538.
-
Georgoulas G., Stylios C., Kappatos V., Dermatas E. Wavelet usage for feature extraction for crack localization. 17th Mediterranean Conference on Control and Automation, 2009, p. 1540-1545.
-
Kappatos V., Dermatas E. Neural localization of acoustic emission sources in ship hulls. Journal of Marine Science and Technology, Springer, Vol. 14, 2009, p. 248-255.
-
Hinton G. A practical guide to training restricted Boltzmann machines. Momentum, Vol. 9, 1, p. 2010-926.
-
Ahmed N., Natarajan T., Rao K. R. Discrete cosine transform. IEEE Transactions on Computers, Vol. 100, Issue 1, 1974, p. 90-93.
-
Keogh E., Chakrabarti K., Pazzani M., Mehrotra S. Dimensionality reduction for fast similarity search in large time series databases. Journal of Knowledge and Information Systems, Vol. 3, Issue 3, 2000, p. 263-286.
-
Yi K., Faloutsos C. Fast time sequence indexing for arbitrary Lp norms. Proceedings of the 26th International Conference on Very Large Databases, Cairo, Egypt, 2000.
-
Rao K. R., Yip P. Discrete Cosine Transform: Algorithms, Advantages, Applications. Academic Press, 2014.
-
Proakis J. G., Manolakis D. G. Digital Signal Processing: Principles, Algorithms, and Applications. Prentice Hall, 1996.
-
Karvelis P., Georgoulas G., Tsoumas I. P., Antonino-Daviu J. A., Climente-Alarcón V., Stylios C. A symbolic representation approach for the diagnosis of broken rotor bars in induction motors. IEEE Trans Industrial Informatics, Vol. 11, Issue 5, 2015, p. 1028-1037.
-
http://www.cs.ucr.edu/~eamonn/SAX.htm, 2016.
-
Schmidhuber J. Deep learning in neural networks: an overview. Neural Networks, Vol. 61, 2015, p. 85-117.
-
Tran V. T., Althobiani F., Ball A. An approach to fault diagnosis of reciprocating compressor valves using Teager-Kaiser energy operator and deep belief networks. Expert Systems with Applications, Vol. 41, Issue 9, 2014, p. 4113-4122.
-
Tamilselvan P., Wang P. Failure diagnosis using deep belief learning based health state classification. Reliability Engineering and System Safety, Vol. 15, 2013, p. 124-135.
-
Witten I. H., Frank E. Data Mining: Practical Machine Learning Tools and Techniques. Morgan Kaufmann, 2005.
-
Wasikowski M., Chen X. Combating the small sample class imbalance problem using feature selection. Knowledge and Data Engineering. IEEE Transactions on Knowledge Data Engineering, Vol. 22, Issue 10, 2010, p. 1388-1400.
-
Heaton J. Artificial Intelligence for Humans, Vol. 3: Deep Learning and Neural Networks. Create Space Independent Publishing Platform, 2013.
About this article

This work was partially supported by the Horizon 2020 Framework program DISIRE under the Grant Agreement 636834.
