Abstract
Condition monitoring (CM) is an effective approach to prevent accidents caused by structural damage. An online condition monitoring system for suspension is vital to vehicles’ safety and reliability, as suspension is an important subsystem of the vehicle. Average Correlation Signals based Stochastic Subspace Identification (ACS-SSI) is a new approach which has the potential to achieve online CM for vehicle suspension systems. In order to investigate the influences of possible errors, like placement of sensors and excitation amplitudes, on implementing ACS-SSI for online suspension CM, a simplified test device is developed to study the performance of identifying the most three common vibration modes of a vehicle, which are bounce, pitch and roll. A three degrees of freedom (3-DOF) model were established for the devices to highlight the effects of the errors. The study results show that the ACS-SSI is an effective method to carry out system identification even if the inputs are highly noisy and non-stationary. However, the implementation of ACS-SSI needs to take into account these potential errors in order to obtain accurate CM results.
1. Introduction
Suspension system plays a decisive role in determining the vehicle driving performance, passenger comfort and road safety. In order to satisfy consumers’ requirements of comfort and safety in the competitive automobile industry, the suspension system has become a complex part to support the weight of vehicle, absorb road shocks to protect the driver and passengers and to provide steering control during sudden brake [1-3]. Because of the significant role of the suspension systems, its quality and reliability recently have drawn extensive attention.
Condition monitoring (CM) is an efficient approach to help diagnosing whether the monitored structure should be maintained or replaced before it is damaged and causes accidents [4]. As referred previously, the vehicle suspension system is very important, therefore, fault diagnose systems based CM for suspension system have been investigated by different researchers. Fuzzy positive C-means clustering was adopted by Shen et al. [5] to monitor the performance of vehicle suspension. This method can only handle the function attenuation of springs in the suspension systems based on the accelerometer measurement. Shahram and Abbas [6] presented a method based on continuous wavelet transform to detect the faults of vehicle suspension systems. Their method can be used to detect the faults of suspension systems in the assembly line. Fischer et al. [7] proposed fault detection method for the active suspension system based on local neural network analysis with 13 sensors. Similarly, Jeppesen and Cebon [8] designed an intelligent fault monitoring system for a prototype heavy vehicle with an active suspension system. Jeppesen et al. employed the analytical redundancy techniques and by dividing the complete and complicated suspension systems into simpler subsystems to diagnose the faults. However, in the redundancy techniques, some residuals may respond faster than others so make the fault diagnose results unreliable. Plenty of other approaches for suspension fault detection have been presented by some other researchers like the model based fault method [9, 10]. However, a method which is really suitable for online monitoring of different types of suspension systems has not been found until recently Chen and Hamed et al. [11-13] proposed the ACS-SSI.
The ACS-SSI approach choose a channel which has high signal noise ratio (SNR) as the reference to calculate the correlation signals. The original data is divided into several segments and calculate the average correlation signals of each channel are calculated. After that, the covariance matrixes are obtained using the average correlation signals and then the Topelize matrix is developed by gathering the covariance matrix. Moreover, singular-value decomposition (SVD) for the Topelize matrix can get the extended observability and controllability matrix. Then, the modal parameters can be obtained based on the previous results. The details of ACS-SSI can be found in references [11, 12, 14]. The main aim of this paper is to investigate the influences of possible errors when implementing the ACS-SSI.
The outline of this paper is as follows: section two is an introduction of the set-up of the simplified test system and the corresponding 3-DOF model and followed with the theory calculation results of system resonance frequencies; section three is the experiment study using the developed test rig; last but not least, some conclusions are given in section four.
2. Experiment set-up and corresponding 3-DOF model
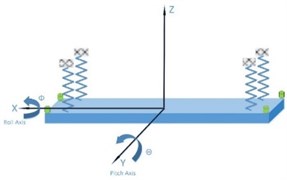
A vehicle suspension system is a fairly complicated vibration system in terms of its dynamic behaviour. For example, it can be seen from Fig. 1, a schematic of McPherson suspension, that the real suspension system was not as simple as the linear 7-DOF full vehicle model such as the deformation of the spring and damper is not in the vertical direction, and the dynamic parameters can vary on the left and right sides due to manufacturing deviations. To investigate the potential influences on implementing the ACS-SSI, a simplified laboratory test system were constructed. In this study, a 3-DOF model of this test rig which are the common vibration modes were considered, including bounce, pitch and roll. The details of the set-up will be introduced in the follows.
Fig. 1Schematic of McPherson suspension
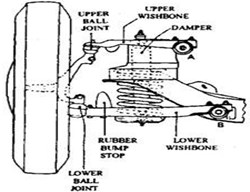
a) McPherson strut suspension [15]
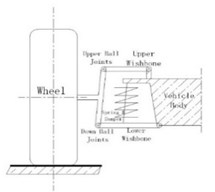
b) Simplified McPherson
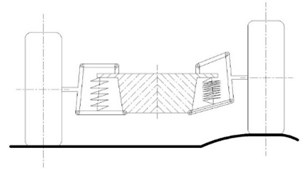
c) Deformation of McPherson
2.1. Experiment Set-up
Four springs were employed to represent the suspension system in the vehicle and a steel plate was adopted to stand for the vehicle body. The steel plate was hanged up by four springs, shown as Fig. 2. Fig. 2(c) shows the dimensions of the plate. In this experiment, four acceleration sensors were installed on the four corners of the plate referring to the measure method in reference [1, 13]. The sensors were connected with a four channel data acquisition device and then connected with a laptop to collect the vibration signals. The sensors are piezoelectric accelerometers and model is CA-YD-185, shown as Fig. 3(a). This type of sensors used widely in condition monitoring based vibration measurement because it has small mass and wide useful measurement frequency band, from 0.5 Hz to 5000 Hz. The 4-channel data acquisition device used in this experiment has independent A/D (analogue/digital) converter in each channel and with sampling frequency from 0 Hz to 96 kHz, shown as Fig. 3(b).
Fig. 2Test Set-up
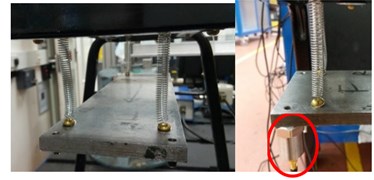
a) Photos of Test Set-up
b) Schematic of Test Set-up
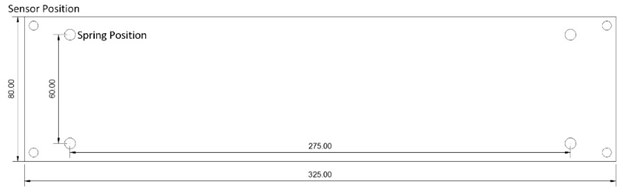
c) Dimension of Test Set-up
Fig. 3Acceleration sensors and data acquisition
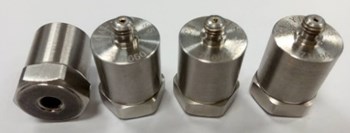
a) Acceleration sensors
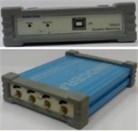
b) Data acquisition
2.2. 3-DOF model
The simplified suspension system only considers three degree of freedoms when developing the mathematical model, including the bounce, pitch and roll, shown as Fig. 2(b). The dynamic equation was developed basing on the Newton second law, shown as Eqs. (3)-(5). In the dynamic equations, ( 1, 2, 3, 4) stand for the stiffness of the four springs. They have the same value in this system so they will be written in a same form as in the stiffness matrix (). Additionally, , , were employed to stand for the movement of bounce, pitch and roll, respectively and ( 1, 2, 3, 4) were used to stand for the vertical displacement of the four springs. The pitch and roll are small movement so ( 1, 2, 3, 4) have the relationship with bounce movement shown as Eq. (1) and Eq. (2). and are the distance between the springs. Eq. (1)-(2) has been submitted into Eqs. (3)-(5):
The dynamic equations can be written in matrix format to develop the state space matrix and then calculate the modal parameters of this system. Basing on the dynamic equations, the mass matrix and stiffness matrix can be written as follows:
The state matrix can be written as:
The theoretical resonance frequencies of this system can be obtained through the eigenvalue () calculation and the mode shapes were the correspond eigenvector (), shown as Eq. (8). The mass of the steel plate including the four sensors was measured through a balance. The measurement result is 1.7138 kg. The stiffness of four springs were measured via Hooke’s law and the average result is 159.5 N/m.
The natural frequency of the first three orders of this system can be obtained via submitting the measured parameters. The results of bounce, pitch and roll are 3.05 Hz, 3.94 Hz and 4.47 Hz, respectively. This is the calculation result for an ideal 3-DOF simplified suspension system without damping effect. However, the test rig developed for the 3-DOF simplified suspension experiment was not ideal as the mathematical model. The same problem that theory mathematical model was not fully represent the real vehicle suspension was exist in the suspension study. For this reason, different configurations of the springs in the simplified suspension system will be discussed in the next section and compared with the theory calculation result:
3. Experiment result and analysis
Based on the introduction of the experiment set-up, two experiments were conducted to investigate the potential influences when using ACS-SSI for online vehicle suspension CM. The inputs of these experiments were given by a hammer with a rubber head. The first experiment was the influences of the sensor placement on the experiment results. The second one was the influences of different excitation amplitudes on the identification results.
3.1. Placement of sensors
The sensor placement under on road test conditions have some constraints. One of the case which may have important influences on the identification result is the center of gravity and sensors are not in the same plane. This section will investigate two different cases of the springs connecting with the steel plate in different configurations to study the influences of sensor not in the same plane with the center gravity. The first case is the springs connected with the steel plate directly via the bolt, shown as Fig. 4(a). In this case, the sensor and the gravity center are almost in the same plane. The second case is the springs connected the steel plate through a long bolt (Fig. 4(b)) that the spring has a distance from the steel plate. In the second case, the force of the spring is not directly loading on the steel plate. The force analysis schematic is shown as Fig. 4(c). is the force produced by spring and is one of the resolution of which is vertical to the steel plate; is another resolution of which is parallel with the steel plate. is the main factor of roll movement. However, equal with and equal zero when the spring directly load on the steel plate. Therefore, the second connecting method should have a big effect on the modal parameter of roll modes. The experiment results of the two configurations would be given in the follows.
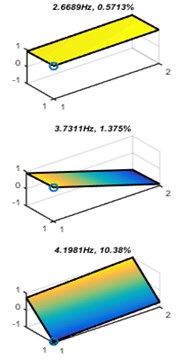
The modal parameters, modal shapes and natural frequencies, of the two experiments are given in Fig. 5. Comparing the theory calculation result with direct connection, the ACS-SSI identification errors of bounce, pitch and roll frequencies are 12.5 %, 5.3 % and 6.1 %, respectively. A considerable reason for this error is the theoretical calculation of the natural frequency does not consider the damping effects. In other words, the direct connection methods indicate that the ACS-SSI is an effective method to identify the system modal parameters.
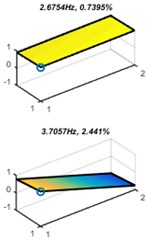
Moreover, it can be seen from Fig. 5 that the connection method has little effect on the bounce and pitch frequency. The errors of the two different connection methods of bounce and pitch resonance frequencies are 0.8 % and 1.0 %, respectively. However, the error of the roll natural frequency in the two experiment cases is 45.3 %. The result has a good agreement with the expectation which means the online monitoring of vehicle suspension should consider the placement of sensors.
Fig. 4Different connection methods
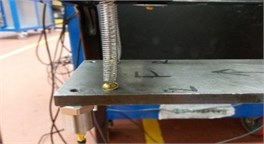
a) Directly connect

b) Connect through long bolt
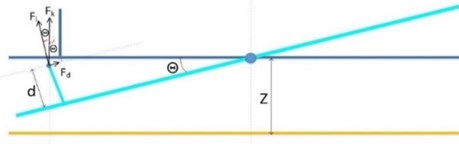
c) Force analysis of the long bolt connection
Fig. 5Modal parameters of different spring configuration
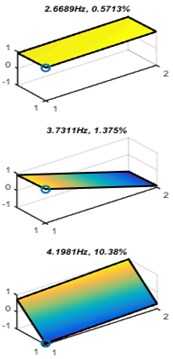
a) Directly connection
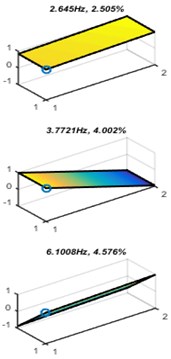
b) Long bolt connection
3.2. Different excitation amplitudes
The vehicle may be driven on different road conditions. In order to study the effectiveness of ACS-SSI when vehicle under different road conditions, the set-up (directly connection) was excited by random excitation with different amplitudes. The excitation was also provided via a hammer with rubber head. The amplitudes of the excitations were classified into three grades, including strong excitation, medium excitation and light excitation. Fig. 6 presents the RMS values of each test. From the RMS values we can see that the amplitudes are different of the three tests and the inputs are non-stationary because the RMS values are nonzero.
Fig. 6RMS of different amplitudes signal
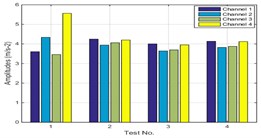
a) Strong excitation
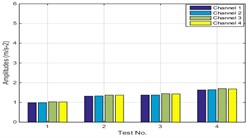
b) Medium excitation
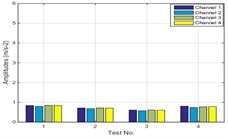
c) Light excitation
Fig. 7 presents the identification results of the set-up with different excitation amplitudes. On one hand, it can be seen that the three expected modes were excited by strong and medium amplitude excitation. However, a repeat modal shape (4.14 Hz and 4.16 Hz) and a harmonic modal shape (7.46 Hz) were excited by strong excitation but roll mode not appeared when load light excitation on the system. These errors can be avoided by improve the ACS-SSI.
Fig. 7Modal parameters of different identification
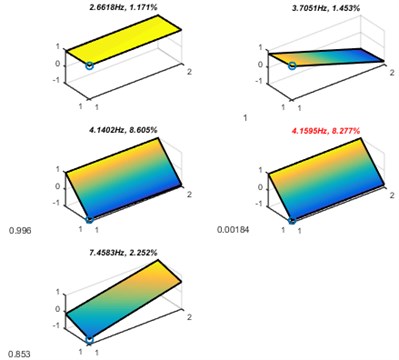
a) Strong excitation
b) Medium excitation
c) Light excitation
On the other hand, the resonance frequencies of bounce, pitch and roll modes have a good coherence under different amplitudes of excitation, which means ACS-SSI is an effective method to meet the requirements of online monitoring. Nevertheless, the accuracy of ACS-SSI should be improved to suppress the condition that the excitations are strong or light to obtain a more accurate result.
Moreover, even though the system is simple and near linearity, the identification results still has errors compared with the theory calculation result from the 3-DOF model. However, a vehicle is a much more complicated system which contains nonlinear elements like dampers, so the 7-DOF linear full vehicle model which adopted in [1, 13] cannot fully present the vehicles’ dynamic performances and yet a more complicated model need to be developed.
4. Conclusions
This paper has presented a study of the influences of possible errors on using ACS-SSI by constructing a laboratory test system. Some conclusions can be obtained through the study:
1) By comparing the theoretical calculation result and experiment result can be seen that ACS-SSI is effective and accurate to identify the tested systems;
2) The results of different connection methods show that the placement of sensors has a big effect on the identification results of systems’ modal parameters;
3) Different amplitudes of excitation show that ACS-SSI is accurate to identify the laboratory system but still need to be improved in a further step to suppress some extreme conditions like strong excitation caused by hard road condition. In other words, ACS-SSI should be improved to achieve online CM of vehicle suspension when vehicle run on a rough road or an extreme smooth road;
4) From the 3-DOF model for the simple laboratory device could indicate that the 7-DOF model is not accurate enough to present the vehicles’ dynamic performances and a more complicated and yet feasible model need to be developed.
References
-
Hamed M., et al. Vehicle suspension performance analysis based on full vehicle model for condition monitoring development. Vibration Engineering and Technology of Machinery, 2015, p. 495-505.
-
Arslan Y. Z., Sezgin A., Yagiz N. Improving the ride comfort of vehicle passenger using fuzzy sliding mode controller. Journal of Vibration and Control, Vol. 21, Issue 9, 2015, p. 1667-1679.
-
Aly A. A., Salem F. A. Vehicle suspension systems control: a review. International Journal of Control, Automation and Systems, Vol. 2, Issue 2, 2013, p. 46-54.
-
Jardine A. K., Lin D., Banjevic D. A review on machinery diagnostics and prognostics implementing condition-based maintenance. Mechanical Systems and Signal Processing, Vol. 20, Issue 7, 2006, p. 1483-1510.
-
Yin S., Huang Z. Performance monitoring for vehicle suspension system via fuzzy positivistic C-means clustering based on accelerometer measurements. IEEE/ASME Transactions on Mechatronics, Vol. 20, Issue 5, 2015, p. 2613-2620.
-
Azadi S., Soltani A. Fault detection of vehicle suspension system using wavelet analysis. Vehicle System Dynamics, Vol. 47, Issue 4, 2009, p. 403-418.
-
Fischer D., Kaus E., Isermann R. Fault detection for an active vehicle suspension. Proceedings of the American Control Conference, 2003.
-
Jeppesen B., Cebon D. Application of observer-based fault detection in vehicle roll control. Vehicle System Dynamics, Vol. 47, Issue 4, 2009, p. 465-495.
-
Börner M., et al. Model based fault detection of vehicle suspension and hydraulic brake systems. Mechatronics, Vol. 12, Issue 8, 2002, p. 999-1010.
-
Kim H., Lee H. Model-based fault-tolerant control for an automotive air suspension control system. Proceedings of the Institution of Mechanical Engineers, Part D: Journal of Automobile Engineering, Vol. 225, Issue 11, 2011, p. 1462-1480.
-
Chen Z., et al. Characterizing the dynamic response of a chassis frame in a heavy-duty dump vehicle based on an improved stochastic system identification. Shock and Vibration, Vol. 2015, 2015, p. 1-15.
-
Chen Z., et al. The average correlation signal based stochastic subspace identification for the online modal analysis of a dump truck frame. Journal of Vibroengineering, Vol. 17, Issue 4, 2015, p. 1971-1988.
-
Hamed M. Characterisation of the Dynamics of an Automotive Suspension System for On-line Condition Monitoring. University of Huddersfield, 2016.
-
Peeters B., De Roeck G. Reference-based stochastic subspace identification for output-only modal analysis. Mechanical Systems and Signal Processing, Vol. 13, Issue 6, 1999, p. 855-878.
-
Gillespie T. D. Fundamentals of Vehicle Dynamics. Society of Automotive Engineers, Warrendale, PA, 1992.
About this article

