Abstract
In actual intelligent fault diagnosis of mechanical equipment, the sample data that can be measured is very limited. How to identify the type of fault relies on as little as possible of the sample and as low as possible of the low-dimensional feature vector uniquely require research in actual mechanical machinery and equipment intelligent fault diagnosis. By using the threshold noise reduction, improving the cubic spine interpolation, signal SVM extending and so on to improve EEMD method; researched the cross-validation model grid optimization SVM parameters, obtained the optimal parameters of SVM by using Sigmoid kernel function; applied optimal excellent SVM parameters, SVM by using Sigmoid kernel function in the ultra-low-dimensional ultra-small-sample four categories intelligent fault diagnosis classification accuracy rate reached 100 %, SVM parameter optimization can enhance the method combined the improved EEMD with SVM in ultra-low-dimensional ultra-small-sample four categories fault diagnosis accuracy.
1. Introduction
Intelligent diagnosis is the development direction of mechanical condition monitoring and fault diagnosis. Typical feature extraction of the fault and choose appropriate machine learning method is two key factors of intelligent diagnosis [1].
Empirical Mode Decomposition (EMD) [2] method as a new signal analysis theory, is suitable for extracting the actual nonlinear the nonstationary signal. But it has serious endpoint effect and modal aliasing phenomenon, and has a bad effect on the accuracy of the analysis results. Thus, the solution to end effect and modal aliasing phenomenon has become the key to successful application EMD machinery fault diagnosis. Numerous scholars are focusing on the research of end effect and Ensemble Empirical Mode Decomposition (EEMD) [3] can effectively resolve modal aliasing phenomenon in EMD.
For mechanical intelligent diagnosis, currently that the most used methods are neural networks and support vector machine (SVM) [4]. As the training samples of neural network are particularly large; there are some difficulties in actual use. SVM does not pursue the number of samples tends to infinity when the optimal solution, and the pursuit of finite sample optimal solution, has had a large number of applications in the current intelligent classification.
This paper proposed an improved EEMD based on the EEMD method, and successfully applied the method combined the method combined the improved EEMD with SVM [5], and boosted SVM classification accuracy by optimizing the parameters to study the ultra-low-dimensional ultra-small-sample intelligent classification of mechanical fault diagnosis of the condition.
2. Fault diagnosis steps of combination improved EEMD with SVM
Fault diagnosis steps of combination Improved EEMD with SVM is as follows [6]:
(1) Train sample by improved EEMD decomposition. Improved EEMD decomposition get groups order IMF component , ,…, and surplus . Mainly including the following:
a) Threshold noise by improved EEMD;
b) On the threshold of the signal after noise reduction SVM extension [7];
c) In continuation of the signal by adding a set of zero mean and variance equal to the random white noise sequence [8];
d) Extension of SVM and processing noise composite signal obtained after the treatment with EMD group IMF component and group m headroom .
IMF component obtained m corresponding group mean and mean surplus , then:
Among:
e) Truncation SVM extension part as the original signal final decomposition results [9].
The improved EEMD method proposed in this paper made the following main improvements:
1) The threshold noise suppression pulse interference and noise pollution, so that the signal before the EEMD decomposition of the signal itself and contains only zero mean and variance equal to the random white noise sequence [12].
2) Improved the cubic spine interpolation method suppresses “overshoot” and “undershoot” phenomenon. Extreme points of all of the signal is formed by a straight line segment connecting the upper and lower envelope line; strike the upper and lower envelope envelopes of line; inflection point of the flat line a cubic smoothing spine connected to form the mean of the signal envelope.
3) Extension of SVM signals suppression end effect. Before joining the white noise signal SVM extension, increasing the length of the signal sequence of data to improve the accuracy of the results decomposition, inhibit the end effect.
3. The method combined the improved EE-MD with SVM in ultra-low-dimensional ultra-small-sample intelligent diagnosis case analysis
Examples used the bearing signal that easily measured to multi-classification intelligent diagnosis. In order to prevent too little samples are not persuasive in the study and have some effect on improvements intelligent classification and recognition results by the method combined improved EEMD with SVM in ultra-low-dimensional ultra-small-sample application. Measured respectively collected bearing in normal state, ball fault and inner ring and outer ring fault vibration signal of the four kinds of typical conditions 50 group a total of 200 sample data, and then to a random sample from the required training and testing of small samples for research.
The experiment measured by using photoelectric counting rotor speed, collected bearing vertical level and axial vibration signal by 4 channel sensors. Sampling frequency is set to 10 kHz, and analyzing frequency is 2 kHz.
3.1. Improved feature extraction EEMD
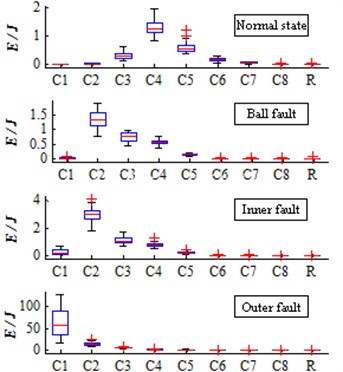
Process all 200 samples of bearing vibration signal sample data by improved EEMD method to threshold noise reduction, then let the sample data signal after noise cancellation decomposes by improved EEMD method. To get the bearing state of four different 200 groups of the IMF and the surplus , seek the energy of each group of IMF and the surplus , to obtain a total of 200 group 9 dimension (dimension 8 IMF component C1-C8 and 1 order surplus ) normalized eigenvector energy as a sample preparation, Fig. 1 is 200 groups 9D energy statistics distribution.
Fig. 1200 groups 9D energy statistics distribution
3.2. The method combined the improved EEMD with SVM in ultra-low-dimensional ultra-small-sample intelligent diagnosis
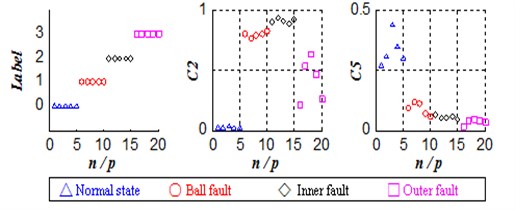
Bearing four types of 20 groups of two-dimensional feature vector data will serve as input to the SVM training sample set in the classification training, establish ultra-low-dimensional ultra-small-sample classification model for classification test, observe the method combined the improved EEMD with SVM in ultra-low-dimensional ultra-small-sample case four classification results. Fig. 2 is a group of two randomly selected 20-dimensional feature vector class labels and distributions.
Fig. 2Ultra-low-dimensional ultra-small-sample test set category labels and 20 groups of two-dimensional feature vector
SVM using Sigmoid kernel function, set penalty parameter 1, kernel function gamma function parameter 1. The training set input to the SVM for training, establish classification model.
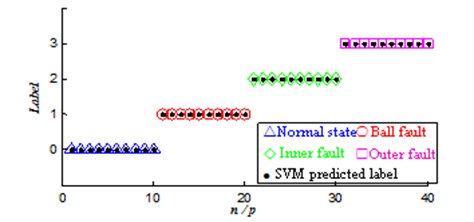
The test sample set input to the established model of SVM classifier to classify and then obtain the prediction labels of the test sample (Fig. 3(a)).
Fig. 3Large sample of ultra-low-dimensional ultra-small-sample sample label SVM prediction
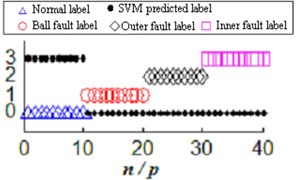
a) Ultra-low-dimensional ultra-small-sample multiple classification
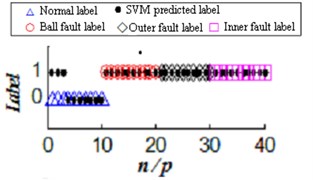
b) Large sample of two high-dimensional classification
SVM use Sigmoid kernel function to create classifier which let 10 groups of normal state all the data among the test sample miscalculate into race fault. Ball bearing failure, the failure of inner ring and outer ring altogether 30 sets of data in total mistaken for normal state, correct rate of four classifications is 0.
Whether the method combined the improved EEMD with SVM when uses Sigmoid kernel function to create a classifier can have the correct classification functions? For simplicity, this paper conducted normal and ball bearings, inner ring and outer ring three kinds of fault state of binary classification recognition under the condition of high dimension large sample (Fig. 3(b)), the binary classification accuracy rate of normal and ball bearings, inner ring and outer ring three kinds of fault state recognition under the condition of high dimension large sample is 92.5 %, Fig. 3 is a high-dimensional large sample and low-dimensional small sample classification accuracy comparison.
4. The method combined the improved EE- MD with SVM ultra-low-dimensional ultra-small-sample SVM parameter optimization and diagnostics
In order to improve the ultra-low-dimensional ultra-small-sample four classifications accuracy, to further enhance the classification accuracy, this paper interactive test mode through the grid optimization method to find the best adapted kernel function parameters and .
4.1. SVM parameter optimization
The SVM applied to the bearing of the ultra-low-dimensional ultra-small-sample classification test, just set the parameters and , determined by using the grid optimization, observe and compare the classification accuracy rate changes.
Training samples after parameter optimization are still using ultra-low-dimensional ultra-small-sample four classified training samples and Sigmoid kernel function, and used the grid optimization method to determine the parameters and :
1) Parameter , values in a wide range, can set [2-30 230], [2-5 220], in as the -axis, as the -axis, then the point (, ) constitute the grid plane ; Set classification accuracy (%) as the -axis, the combination constitutes a SVM classification accuracy 3D space grid.
2) Training samples and the corresponding labels are divided into six subsets, apply the interactive test mode, part of a randomly selected subset of the subset as training samples and test samples subset, through all points (, ) in the grid plane for SVM training, create a series of classifiers, calculate multiple classification accuracy and then obtain 3D spatial distribution of SVM classification accuracy (Fig. 4).
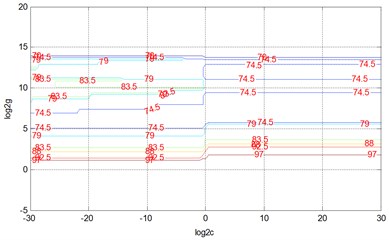
3) The 3D spatial distribution of the SVM classification accuracy projected into the grid plane . Connect all the same classification accuracy rate corresponding points, and then obtain classification accuracy contour (Fig. 5)
In Fig. 5, find the curve of the highest classification accuracy; all points on the curve (, ) can make SVM classification model create the highest classification accuracy; Corresponding values of and can be as the best parameter and . Choose one set of parameters 0.00093132, 0.03125 as the best SVM parameters.
Fig. 4The 3D spatial distribution of SVM classification accuracy
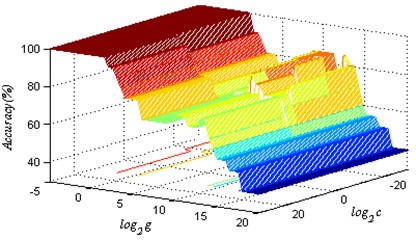
Fig. 5SVM classification accuracy contour
4.2. Ultra-low-dimensional ultra-small-sample four classifications fault identification after optimization
By Sigmoid kernel function and the optimal parameters , , let the above training sample set make SVM training again to establish the classification model.
The ultra-low-dimensional ultra-small-sample test sample set input to the already established model of SVM classifier to classify to obtain the predicted label of the test sample set (Fig. 6).
Fig. 6Ultra-low-dimensional ultra-small-sample test set prediction labels
Classification results showed that: when the parameter , through the grid optimization method, SVM that used Sigmoid kernel function classification accuracy rate reached 100 %, under the conditions of ultra-low-dimensional ultra-small-sample multi-classification bearing four states entirely correctly distinguish. SVM classification results will be different in the same kernel function under different parameter settings. Interactively test mode and grid optimization method can find the optimal SVM parameters to help achieve the desired learning outcomes and generalization performance, thereby enhancing the method combined the improved EEMD with SVM in ultra-low-dimensional ultra-small-sample fault intelligent diagnostic accuracy.
5. Conclusions
This paper successfully applied the method combined the improved EEMD with SVM to the ultra-low-dimensional ultra-small-sample four categories intelligent fault diagnosis.
1) Proposed by using the threshold noise reduction, improved cubic spine interpolation, signal SVM extension and other measures to improve EEMD approach.
2) Researched the cross-validation model grid optimization SVM parameters, obtained optimal parameters of the SVM by using Sigmoid kernel function.
3) Applied the cross-validation model grid optimization SVM optimal parameters, SVM by using Sigmoid kernel function to the ultra-low-dimensional ultra-small-sample four categories intelligent fault diagnosis classification accuracy rate reached 100 %, SVM parameter optimization can improve the method combined the improved EEMD with SVM in ultra-low-dimensional ultra-small-sample four categories fault diagnosis accuracy.
References
-
Li Hwi, Liu Xiaofeng, Lin Bo Signal component extraction using instantaneous parameters estimation. Journal of Vibration and Shock, Vol. 31, Issue 1, 2011, p. 32-35.
-
Dou Dongyan, Yan Jianguo, Li Lijuan, et al. Intelligent fault diagnosis method of rolling bearing based on EMD and MLEM2. Transactions of the CSAE, Vol. 27, Issue 3, 2011, p. 125-130.
-
Li Hwi, Liu Xiaofeng, Lin Bo Signal component extraction using instantaneous parameters estimation. Journal of Vibration, Measurement and Diagnosis, Vol. 31, Issue 1, 2011, p. 591-595.
-
Huang N. E., Shen Z., Long S. R. The empirical mode decomposition and the Hilbert spectrum for nonlinear and non-stationary time series analysis. Proceedings of the Royal Society of London, Series A: Mathematical, Vol. 454, 1998, p. 903-995.
-
Wu Zhaohua, Huang Norden E. Some considerations on physical analysis of data. Advances in Adaptive Data Analysis, Vol. 3, Issue 3, 2009, p. 1-41.
-
Zhang Meijun, Han Sichen, Wang Chuang, et al. The improved EEMD method based on SVM signal continuation. Journal of Vibration Measurement and Diagnosis, Vols. 479-481, 2012, p. 1180-1185.
-
Zhang Meijun, Chen Hao, Cao Qin, et al. The improved EEMD method based on SVM signal continuation. Journal of Vibration, Measurement and Diagnosis, Vol. 33, Issue 16, 2013, p. 93-97.
-
Su Wensheng, Wang Fentou, et al. Application of EMD denoising and spectral kurtosis in fault early diagnosis of rolling element bearing. Journal of Vibration and Shock, Vol. 29, Issue 19, 2010, p. 18-21.
-
Xiao Zhiyong, Yang Xiaoling, Liu Ailun Mechanical fault diagnosis based on improved EMD and LSSVM. Process Automation Instrumentation, Vol. 29, Issue 23, 2008, p. 24-26.
-
Wu Z. H., Huang N. E. Ensemble empirical decomposition: a noised-assisted data analysis method. Advances in Adaptive Data Analysis, Vol. 1, Issue 1, 2009, p. 1-41.
-
Zhang M. J., Han S. C., Wang C., Li S. G., et al. Improved EEMD method research. Advanced Materials Research, Vols. 479-481, 2012, p. 1180-1185.
-
Su W. S., Wang F. T., Zhang Z. X., et al. Application of EMD denoising and spectral kurtosis in early fault diagnosis of rolling element bearings. Journal of Vibration and Shock, Vol. 22, Issue 1, 2010, p. 3537-3540.
About this article

This project was financially supported by Natural Science Foundation of China (51175511).
