Abstract
In several applications, certain components must be designed to withstand the fatigue damage induced by dynamic loads due to vibrations. Highly Accelerated Life Tests (HALTs) by means of vibration qualification can be performed for the most critical ones. The proper synthesis of test profiles, which starts from the real environment vibrations and which preserves both the fatigue damage potential and the signal characteristics of the excitation, is important to obtain reliable results. A special kind of vibration excitation is the so-called Sine-on-Random (SoR), i.e. sinusoidal contributions superimposed to random vibrations, particularly significant for systems where rotating parts are present. A methodology was previously proposed to synthesize SoR test profiles for HALTs, starting from reference measured vibrations. The present paper illustrates the experimental campaign carried out to verify the effectiveness and the accuracy of the proposed method.
1. Introduction
Several components may be subjected to vibrations during their operational life. The corresponding dynamic loads can induce fatigue damage and the components must be designed to last through the induced damage. To verify their resistance, the components can be validated with qualification tests. In order to conduct reliable tests, the environmental excitations can be taken as a reference to synthesize the test profile: this procedure is referred to as Test Tailoring. Highly Accelerated Life Tests (HALTs) are usually performed to reduce the duration of the excitation acting on the component for its entire life-cycle, that can be up to thousands of hours.
The so-called Mission Synthesis procedure permits to quantify the induced damage of the environmental vibration and to synthesize a test profile with a reduced duration, but the same amount of induced damage [1]. In order to focus on the damage potential associated with a vibratory excitation, a generic component is represented by a series of linear Single Degree of Freedom (SDOF) systems with the natural frequency that varies in the range of interest. It is assumed that if two dynamic excitations produce the same damage on the SDOF linear system taken as reference then they produce the same damage also on the real component under test. Under the assumption of three main hypotheses (i. stress proportional to the relative displacement between mass and base of the SDOF system; ii. Wöhler’s curve and Basquin’s law , where is the number of cycles to failure under stress of amplitude , whereas and are characteristic constants of the material; iii. Miner’s rule for the linear damage accumulation) this simplification permits to reduce the problem of the damage quantification in finding the response of a linear SDOF system. To this aim a frequency-domain function, i.e. the so-called Fatigue Damage Spectrum (FDS), is defined to quantify the fatigue damage [1]. When a new profile with the same amount of damage and a reduced duration is required for laboratory HALTs, it can be synthesized starting from environmental excitation by maintaining the same FDS.
In case the original excitation has random characteristics with a Gaussian distribution, the procedure is well-known [1] and a Power Spectral Density (PSD) is synthesized as a test profile which closely represents the original excitation. However, in a number of cases, the vibration does not follow a Gaussian distribution. In particular, when a rotating part is present in the system, deterministic components in the form of sinusoids are superimposed to a random process, so that the excitations assume Sine-on-Random (SoR) characteristics. In this case, the value distribution is not Gaussian and a synthesized PSD (with a reduced duration) has not the adequate characteristics to properly represent the original excitation in laboratory HALTs. Indeed, a proper Test Tailoring should not only preserve the accumulated fatigue damage, but also the “nature” of the excitation in order to obtain reliable results. Thus, in case of environments with SoR features, a SoR synthesized profile is supposed to better represent the original excitation compared to a purely random profile. To this purpose, a novel methodology to synthesize SoR test profiles (instead of PSD) for HALTs was developed and proposed in Angeli et al. [2], where the detailed formulation can be found. Numerical simulations proved the superiority of the method with respect to the traditional one in terms of better FDSs matching (of the reference and the synthesized profiles). The present paper illustrates the experimental campaign that was carried out to further investigate the procedure effectiveness, that was finally confirmed by the experimental data.
2. Experimental tests
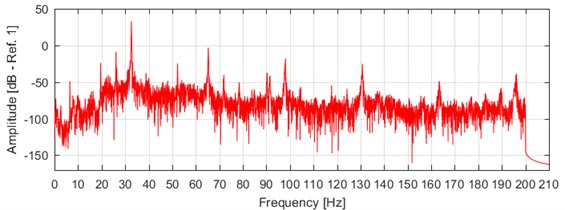
In order to experimentally verify the effectiveness of the proposed SoR Mission Synthesis procedure, the method was applied starting from environmental data (hereinafter referred to as “reference signal”) acquired on a helicopter working in a typical regime condition. In particular, the measurements were taken by an accelerometer mounted on the control board of a helicopter having a 5-blades main rotor (a NOTAR anti-torque system replaces the tail rotor). The signal was sampled at the frequency 400 Hz for a duration of about 27 s. The main rotor constant speed was about 393 rpm. As a consequence, the signal is characterized by the major presence of the rotation frequency harmonics (·6.55 Hz, 1, 2, …) and, mainly, the blade frequency harmonics (·5··32.65 Hz, 1, 2, …), as shown in Fig. 1.
Fig. 1PSD of environmental data measured on a helicopter
2.1. Set up
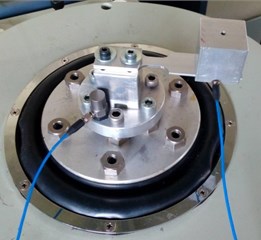
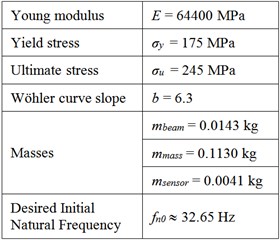
An extensive experimental campaign was performed to further investigate the effectiveness of the proposed SoR synthesis procedure [2] with respect to the traditional PSD synthesis [1]. To this aim many laboratory tests were carried out by means of an electromechanical shaker (Dongling ES-2-150), which imposed the reference signal and different synthesized profiles on purpose-built specimens (Fig. 2). The idea was to compare the fatigue damage actually induced by the synthesized excitations with the damage due to the reference one. The specimen was a flat beam, made of the Aluminum alloy EN AW-6060, fixed to a rigid support in a cantilevered configuration. The thickness was 2 mm and the critical section 10 mm wide; a lumped mass was fixed to its tip (the center of mass being about 66.5 mm from the rigid support) in order to present the natural frequency of the first bending mode at about 32.65 Hz, i.e. corresponding to the main peak of the base excitation signal. A preliminary experimental characterization [3] permitted to determine the material actual mechanical properties (Fig. 2), in particular the value of the Basquin‘s law exponent , which is particularly important in the Mission Synthesis algorithms [1, 4, 5]. Besides the control accelerometer placed at the specimen support base, a second sensor was fixed under the appended mass in order to measure the specimen tip acceleration.
Fig. 2Purpose-built specimen used for the experimental validation

2.2. Test procedure
The helicopter measured vibrations were kept as the reference for this experimental investigation. They were replicated as base excitation to induce on the specimen a certain fatigue damage. Due to both the signal and specimen characteristics, failure breakdown was not achievable (in a reasonable time) so that a “conventional Time-to-Failure”, cTTF, was introduced considering the effect of accumulated fatigue damage to decrease the specimen natural frequency [6, 7]. In particular, cTTF is here defined as the time necessary to decrease the specimen natural frequency from the value 32.67 Hz to the final value 31.04 Hz (5 % decrement). The value 32.67 Hz was chosen since (i) is bigger than and very close to the excitation peak at 32.65 Hz and (ii) most specimens exhibit an initial value 32.67 Hz (Table 1).
Five kinds of tests were carried out, each one repeated for three different specimens for the sake of data reliability, corresponding to the application of the following base excitations:
s0. reference signal (specimens and tests denoted as , , and );
s1. synthesized PSD (, , ) computed to induce the same damage in the same test duration of the reference signal, that is to present the same FDS and cTTF;
s2. synthesized SoR (, , ) computed to have the same FDS and cTTF of the reference signal;
s3. synthesized PSD (, , ) computed to have the same FDS and half the duration cTTF of the reference signal (accelerated tests);
s4. synthesized SoR (, , ) computed to have the same FDS and half the duration cTTF of the reference signal (accelerated tests).
The FDS functions, i.e. the target in the PSD and SoR profile syntheses, were computed considering the following parameters: bandwidth 5-200 Hz, frequency resolution 0.05 Hz; Factor 1/2, 69.4; Wöhler curve slope 6.3; material constants appearing in Eq. (11) of ref. [2] 1.
Among the three data sets for each kind of test, the results corresponding to the specimen exhibiting the median value of cTTF were considered as representative for a direct comparison. In particular, the cTTF associated with the reference signal, necessary to synthesize the other four signals, was 484 minutes (, Section 2.3).
The shaker controller was run by means of the LMS Test.Lab modules Single Axis Waveform Replication (for tests , , and , 1, 2, 3, where the input profile was sequentially replicated until the achievement of cTTF) and Random Control (for tests and , 1, 2, 3) with a sampling frequency of 800 Hz (automatically fixed by the software): the results were then low-pass filtered at 200 Hz and down sampled at 400 Hz, in order to exactly match the signal characteristics of the original measurements.
The natural frequency of the specimens was monitored by computing the Frequency Response Function (FRF) between the mass and base accelerations. The FRFs were computed for signal windows of 30 seconds (with NFFT = 4096 points per signal-block, an overlap of 66.67 %). The initial value of the natural frequency, , was computed for each specimen with a running average approach performed for 3 values of . The same approach is used to compute the final value of the natural frequency that determines the cTTF. Table 1 reports the values of (as well as the mean values of the damping factor computed for the entire test duration) for each specimen. It can be noted that specimens and exhibit an initial frequency smaller than 32.67 Hz. For these specimens cTTF is computed as the time necessary to decrease the corresponding of an amount of 5 %.
Table 1Initial natural frequency fn0 and mean damping factor ζmean of the 15 tested specimens
[Hz] | 32.70 | 32.70 | 32.70 | 32.67 | 32.80 | 32.70 | 32.37 | 32.31 | 32.70 |
0.57 % | 0.69 % | 0.68 % | 0.66 % | 0.84 % | 0.65 % | 0.72 % | 0.56 % | 0.71 % | |
[Hz] | 32.83 | 32.70 | 32.70 | 32.89 | 32.70 | 32.73 | |||
0.55 % | 0.54 % | 0.80 % | 0.68 % | 0.52 % | 0.81 % |
2.3. Results
Table 2 reports the most important results of the experimental campaign. It can be noted that for both the equal-time tests and the HALTs (time reduction factor equal to 0.5) the proposed mission synthesis procedure performs better than the traditional algorithms. Indeed, even though both the PSD and SoR profiles were synthesized in order to match the FDS of the reference signal (specifically the target one corresponding to ), the SoR profiles prove a superior suitability to represent the reference signal in terms of induced fatigue damage, as it can be appreciated by comparing the actual median cTTFs with respect to the corresponding desired value cTTFtarget. The “errors” in terms of actual cTTF vs. target cTTF are in fact +3.5 % and +17.4 % for and (SoR profiles), in spite of +101.7 % and +79.3 %, for and (PSD profiles), respectively.
As an example, Fig. 3 reports the variation of the specimen natural frequency over time: for the other cases, similar trends were observed.
Fig. 3Specimen s43 natural frequency
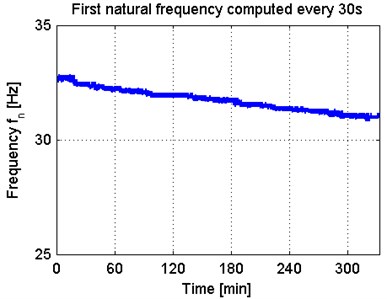
Fig. 4FDSs computed for the measured base excitations (close-up)
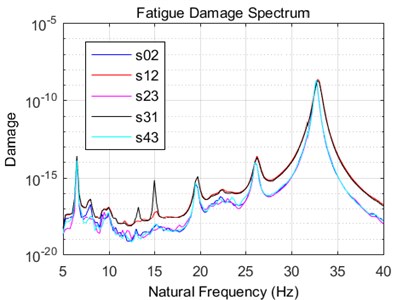
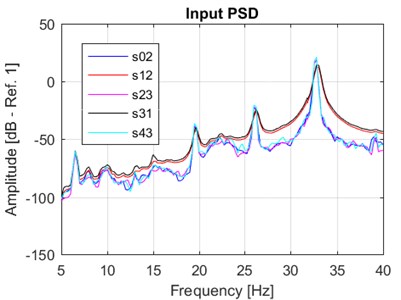
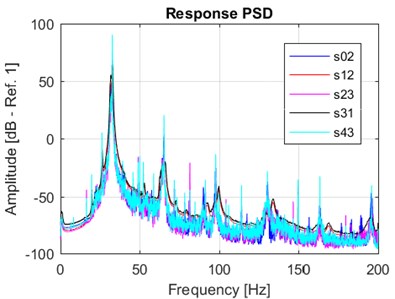
Fig. 4 reports a close-up view of the actual FDS functions computed from the measured base acceleration signals referring to the time interval which defines the cTTFs. Fig. 5 reports the PSD of the measured inputs (base acceleration) and responses (relative mass-base acceleration). It can be noted that the PSD synthesized profiles (red and black curves) were not able to perfectly match the very narrow peak at 32.65 Hz. The damage potential was thus spread over the adjacent frequencies to compensate for the absence of the deterministic sinusoid components, but the final effect proved not meaningful in this application where the specimen natural frequency was set up on purpose just to be resonant, Fig. 5(b).
Table 2cTTFs computed as the time [min] to decrease the natural frequency from fin= 32.67 Hz to ffin= 31.04 Hz (Δfn= –5 %), with the exception of specimens s21 and s22. The partial time corresponding to 1 %-4 % decrement of fn is also reported
Reference signal | Synthesized PSD (cTTFtarget = 484 min) | Synthesized SoR (cTTFtarget = 484 min) | |||||||
Specimen | |||||||||
–1 % | 8 | 31 | 22 | 31 | 27 | 19 | 59 | 14 | 16 |
–2 % | 48 | 105 | 83 | 76 | 77 | 42 | 196 | 67 | 132 |
–3 % | 147 | 209 | 213 | 268 | 293 | 310 | 404 | 118 | 227 |
–4 % | 260 | 323 | 341 | 404 | 662 | 798 | 489 | 221 | 341 |
–5 % | 410 | 484 | 485 | 606 | 976 | 1073 | 607 | 328 | 501 |
Synthesized PSD (cTTFtarget = 242 min) | Synthesized SoR (cTTFtarget = 242 min) | ||||||||
Specimen | |||||||||
–1 % | 19 | 12 | 41 | 15 | 11 | 24 | |||
–2 % | 43 | 59 | 123 | 71 | 63 | 84 | |||
–3 % | 127 | 113 | 343 | 162 | 136 | 159 | |||
–4 % | 288 | 229 | 630 | 223 | 180 | 216 | |||
–5 % | 434 | 289 | 991 | 329 | 250 | 284 | |||
1 Median values of the triplet. 2 cTTF is computed as the time to decrease the natural frequency from 32.37 Hz to 30.75 Hz (–5 %). 3 cTTF is computed as the time to decrease the natural frequency from 32.31 Hz to 30.69 Hz (–5 %). | |||||||||
Fig. 5PSD computed for the a) measured base (close-up) and b) relative mass-base accelerations
a)
b)
Finally, Table 3 reports the peak and RMS values of input and response accelerations measured for the representative specimens of the five tests. These data further prove the better consistency of the SoR synthesized profiles with the reference signal than the PSD profiles.
Table 3Statistical analysis of measured accelerations [m/s2]
Base | Mass-base | Base | Mass-base | Base | Mass-base | Base | Mass-base | Base | Mass-base | |
Peak | 5.54 | 162.99 | 9.40 | 189.32 | 5.15 | 161.86 | 10.66 | 194.79 | 5.83 | 151.15 |
RMS | 2.08 | 47.97 | 1.93 | 30.42 | 2.04 | 44.69 | 2.15 | 37.21 | 2.30 | 50.98 |
3. Conclusions
The papers reported the experimental campaign carried out to validate a novel algorithm proposed to synthesize Sine-on-Random test profiles for accelerated fatigue life vibration testing. The experimental results proved the higher accuracy of Sine-on-Random synthesized profiles with respect to traditional PSD synthesized ones in reproducing the damage potential of real vibrations characterized by sinusoidal components superimposed to random process. This evidence would confirm the positive contribution proposed by the authors to improve the reliability of Test Tailoring procedures conceived for vibration qualification testing of systems characterized by the presence of rotating components generating vibrations.
References
-
Lalanne C. Mechanical Vibration and Shock Analysis, Volume 5: Specification Development. Third Edition, John Wiley and Sons, London, 2014.
-
Angeli A., Cornelis B., Troncossi M. Fatigue damage spectrum calculations in a mission synthesis procedure for sine-on-random excitations. Journal of Physics: Conference Series, Vol. 744, 2016, p. 012089.
-
Baldazzi M. Experimental Investigation on the Dynamic Response of Aluminum Flat Specimens Subjected to Different Kinds of Non-Gaussian Vibration. M.Sc. Thesis, University of Bologna, 2015, (in Italian).
-
Troncossi M., Cipollini R., Rivola A. Experimental evaluation of the FDS-based equivalence approach for the mission synthesis in accelerated life tests. Proceedings of ICSV 20, Thailand, 2013.
-
Hieber G. M. Use and abuse of test time exaggeration factors. Test Engineering and Management, New Jersey, Vol. 61, 1999, p. 14-16.
-
Česnik M., Slavič J., Boltežar M. Uninterrupted and accelerated vibrational fatigue testing with simultaneous monitoring of the natural frequency and damping. Journal of Sound and Vibration, Vol. 331, Issue 24, 2012, p. 5370-5382.
-
Troncossi M., Rivola A. Response analysis of specimens excited with non-Gaussian acceleration profiles. Proceedings of ISMA2014, Belgium, 2014, p. 799-808.
About this article

