Abstract
Power electronic circuits play a vital role in industry application and get more attention in fault diagnosis fields in recent years. In this paper, a method based on wavelet packet transform and least square support vector machine is proposed to diagnose fault of power electronic circuits. We use single-phase half-bridge rectifier as example. Output voltage signal at the main circuit DC side is selected as research object. Wavelet packet transform is used to extract fault feature samples and then multi-class LSSVM classification is built for fault identification. Results show that the performances based on LSSVM are better than that of RBPNN.
1. Introduction
Power electronic circuits are widely used in many fields and electronic devices. It plays an important role in maintain the ability of industrial system. Unexpected circuit fault in the device can lead to serious influence. In recent years, many researchers focus on analog circuits’ fault diagnosis and performance evaluation [1-5].
In past decades, power electronic circuits, such as single-phase rectifier and three-phase rectifier, were usually used to be diagnosis example [6, 7]. Here, we use DC600V locomotive electricity supply device i.e. single-phase half-bridge rectifier as research circuit. Majority detection devices of electricity supply systems work only on the voltage and the current power only by which the state of the electricity device can’t be defined. When electricity supply system breaks down, it is difficult to recognize the kind of malfunction and find where the breakdown happens. The upper computer software of the detection system mentioned in reference [8] can only implement test control, data storage and data output, but fault diagnosis. The upper computer software mentioned in reference [9] can implement fault diagnosis but is confined to searching fault example in information base.
As for faults in main circuit of DC600V locomotive electricity supply device, it is mainly studied by an analytical approach based on frequency traits of voltage signals. When the main circuit breaks down, both the phase-frequency characteristic and the amplitude-frequency characteristic of the output voltage will change a lot. Because of the influence that fault have on the constituents of frequency, the inner energy of frequency band will also change, which can help us recognize the fault [10]. In this article, the system recognition method is used to transform output voltage data by adopting an approach called three layers Wavelet Packet Transform (WPT) which is strong to analyze details. As eigenvector, wavelet packet coefficients of every node of the third layer are input to LS-SVM multi-class classifier to recognize fault. In this way, main circuit fault of electric locomotive power supply can be diagnosed.
The remainder of the paper is organized as follows. In Section 2 and Section 3, a brief review the basic theory of wavelet packet transform and LSSVM, respectively. Section 4 gives the detailed description of model power electronic circuits. Section 5 presents the simulation results and discussions. Conclusions are drawn in Section 6.
2. Fault feature extraction based on Wavelet Packet Transform
Wavelet Packet Transform (WPT) [11-14] is a more precise approach based on multi resolution analysis to orthogonal decomposition, divides the frequency band of signals into different layers, not only takes a distinct advantage in time domain, but also achieve deeper analysis of high frequency band. The wavelet packet decomposition algorithm is as below:
where: and are conjugate filter coefficient of wavelet packet decomposition; is number of decomposition layers; is wavelet packet coefficient of WPT frequency band.
The original signal is decomposed by Wavelet packet transform into frequency bands. We can get low frequency signal (L1) and high frequency signal (H1) from the first layer decomposition, four frequency bands (HH2, HL2, LH2, LL2) from the second layer decomposition based on the first layer decomposition, and so on. As is showed in Table 1, different frequency bands correspond to different frequency ranges.
Table 1Wavelet packet transform frequency range of each frequency band
Signal node | d30 | d31 | d32 | d33 | d34 | d35 | d36 | d37 |
Frequency range | 0 ~0.125f | 0.125 f ~0.25f | 0.25f ~0.375f | 0.375f ~0. 5f | 0.5f ~0.625f | 0.625f ~0.75f | 0. 75f ~0.875 f | 0.875 f ~f |
If is the original signal of which data length is , the data length of discrete signals in frequency band of decomposition will be turned to . Its energy form is:
where is data length of the original signal, is the number of decomposition layers, is location number of frequency band of decomposition. According to relative energy normalization, using the ratio of energy contained in frequency band signal to gross energy of signal, the relative energy of the m decomposition of frequency band signal can be demonstrated as below:
The progress of eigenvalue extraction of three layers WPT and examples information database construction describe as below:
1) Step 1, transforming DC600V locomotive electric power supply using three layer WPT, then extracting characteristics of signals of all the frequency from low-frequency to high-frequency. Therefore, we can get eight decomposition coefficients of eight frequency bands.
2) Step 2, reconstruction for Wavelet Packet decomposition coefficient, then extracting energy of signals of all the frequency bands as , ,…, .
3) Step 3, using normalization method, then we can get eigenvectors in different states: , where is .
4) Step 4, combining eigenvectors in different states into examples information database which can be used in examples training and examples testing of fault sorts recognition.
3. Feature recognition based on LSSVM
By using a least squares cost function and involves equality constraints instead of inequalities in the problem formulation, the LSSVM [15, 16] improved SVM, which variation shown as follows:
1) Equality constraint instead of inequality constraint;
2) Solving quadratic programming is transformed into solving linear equations:
Lagrange function is used to solve the optimization problem as follows:
where is Lagrange multiplier.
When the kernel function is defined as , nonlinear prediction model can be shown as:
where is sign function.
Generally, Linear kernel, Polynomial kernel and RBF kernel are commonly used [17]. Owing to RBF kernel function can lead to a good performance for the nonlinear case [18], in this paper, RBF kernel function is chosen as the kernel function of SVM, which is shown in the following formula:
where is a spread parameter of RBF.
4. Fault mode analysis of main circuit
In this paper, we choose main circuit of TGF-76 power supply as the experimental circuit, which is used in the HXD3C locomotive. Majority faults of main circuit in the HXD3C DC600V electric locomotive power supply contain of self-fault, input or output faults. First of all, faults of main circuit are analyzed by simplifying the main circuit, as shown in the Fig. 1.
Where is main circuit input AC860V single-phase alternating current; is output voltage, is load resistance. VD1 and VD2 are diodes; VD3 and VD4 are thyristors; 13L is inductance; 19C is capacitance.
From actual experiences, single component fault occurs in high frequency. In this experiment, normal state and six fault states are analyzed, as shown in the Table 2.
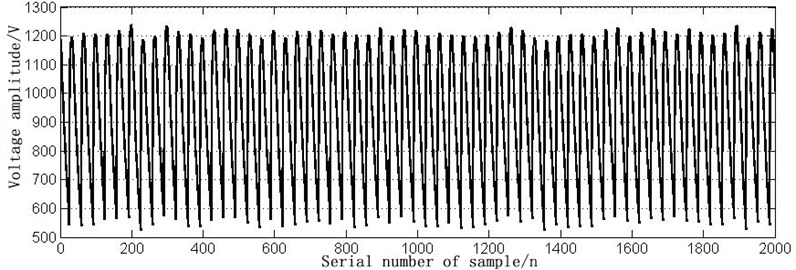
According to the common faults in Table 2, simulation models are built in MATLAB, respectively. The time-domain waveform of normal signal and six fault signals in DC600V electric locomotive power supply are shown in Figs. 2-8.
Table 2The fault model setting
Fault code | Fault model |
G0 | Normal |
G1 | VD1 open circuit fault |
G2 | VD2 short circuit fault |
G3 | VT3 open circuit fault |
G4 | VT4 short circuit fault |
G5 | 19C open circuit fault |
G6 | 13L short circuit fault |
Fig. 1The main circuit diagram of HXD3C type electric locomotive
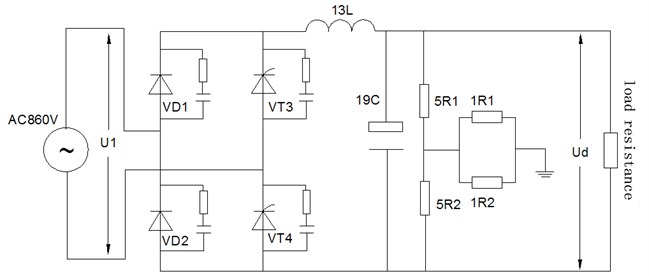
Fig. 2The time domain waveform of the normal signal
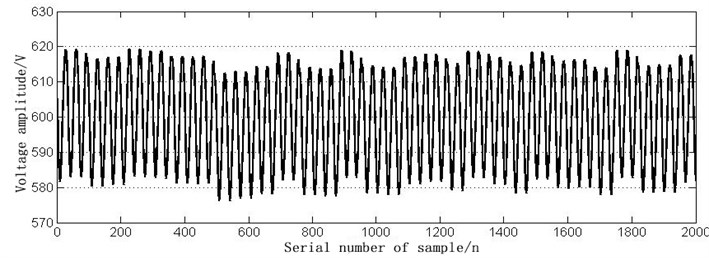
Fig. 3The time domain waveform of VD1 open circuit fault
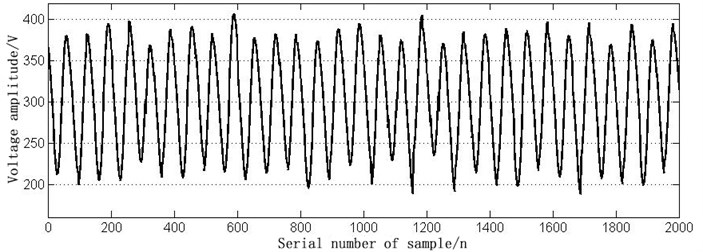
Fig. 4The time domain waveform of VD2 short circuit fault
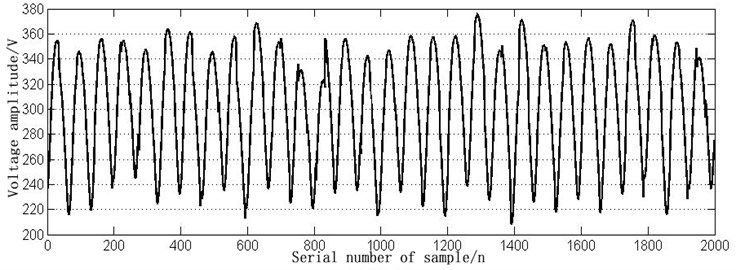
Fig. 5The time domain waveform of VT3 open circuit fault
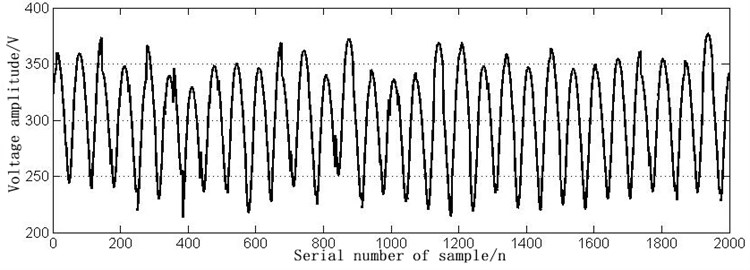
Fig. 6The time domain waveform of VT4 short circuit fault
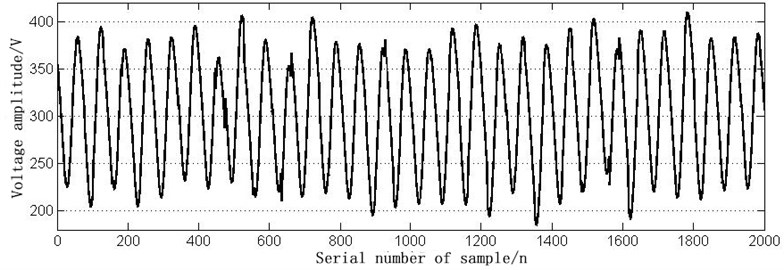
Fig. 7The time domain waveform of 19C open circuit fault
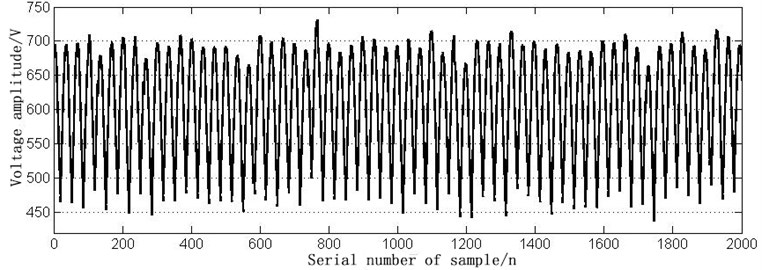
Fig. 8The time domain waveform of 13L short circuit fault
5. Simulation results and analysis
In this paper, the correspondent relationships between main circuit fault and voltage signal energy are used to analyze main circuit faults. In the circumstance of rated load, correspondent output voltage is collected, when fault happens in the main circuit. As signal frequency in main circuit commutation system concentrates on low-frequency part, signal frequency collected by filtering and stabilizing won’t exceed 1000 Hz. Therefore, samples frequency is set to 2000 Hz. The highest frequency of signal is 1000 Hz. Samples points are 2000 conjugate quadrature filter banks. In this paper, db5 conjugate quadrature filter is used to implement three layers wavelet packet transform for main circuit fault voltage signal. Frequency of signal is divided into 8 frequency ranges, each of which covers 125 Hz. Frequency ranges, which represent 8 extracted frequency band components, are shown as below:
Table 3Frequent range of signal
Signal node | d30 | d31 | d32 | d33 | d34 | d35 | d36 | d37 |
Frequency range (Hz) | 0 ~125 | 125 ~250 | 250 ~375 | 375 ~500 | 500 ~625 | 625 ~750 | 750 ~875 | 875 1000 |
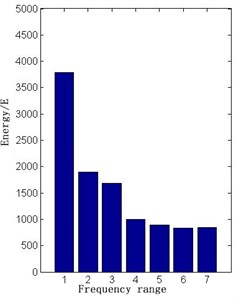
The wavelet packet energy extraction is carried out for the voltage signal in normal state and six fault states. E30 can be used as the first level faults class criteria, because it contains many direct current energy components. Voltage signals of various energy states are shown in Figs. 9-16.
Fig. 9Each state signal E30 energy diagram
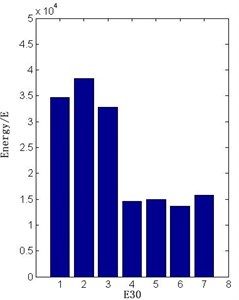
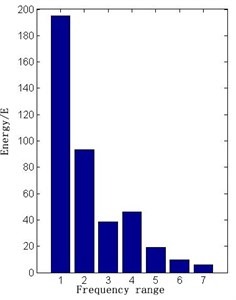
Fig. 10The normal signal energy diagram
In LSSVM classifier, the penalty parameter and the kernel parameter with the radial basis function (RBF) affect the classification performance seriously [19]. In this paper, double chains quantum genetic algorithm (DCQGA) based method is used to optimize and , and the value are 10.7953, 25.8729. The voltage signal in normal state and six fault states are transformed by wavelet packet and extracted energy entropy of each frequency. After the normalization, the characteristic vectors of 90 groups of state signals are obtained. Among them, 68 samples data are selected to train the LSSVM classification model, and the remaining 22 sets of data are used as the test samples to classify the trained models. Parts of training samples are shown in Table 4.
Fig. 11The VD1 open circuit energy diagram
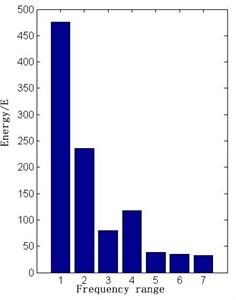
Fig. 12The VD2 short circuit energy diagram
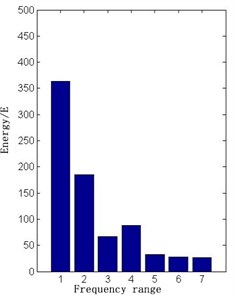
Fig. 13The VT3 open circuit energy diagram
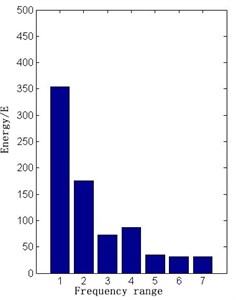
Fig. 14The VT4 short circuit energy diagram
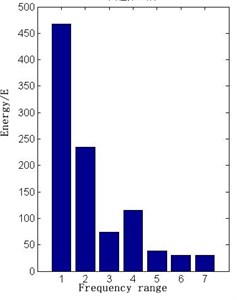
Fig. 15The 19C open circuit energy diagram
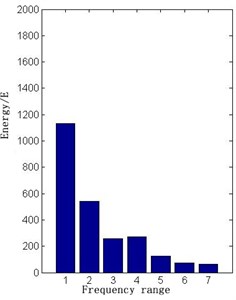
Fig. 16The 13L short circuit energy diagram
Using two classifiers, which trained with LSSVM and RBPNN respectively, test samples and compare with each other. The results are shown in the Table 5.
The experimental results show that the LSSVM based on RBF kernel function with the penalty parameter 10.7953 and the kernel parameter 25.8729 can achieve better performance than RBPNN classifier.
Table 4Parts of LSSVM training samples
Training group | Fault feature vector | Fault code | ||||||
E60 | E61 | E62 | E63 | E64 | E65 | E66 | ||
1 | 0.8590 | 0.4185 | 0.1542 | 0.2203 | 0.0881 | 0.0661 | 0.0441 | G0 |
2 | 0.8812 | 0.4502 | 0.1437 | 0.2490 | 0.0824 | 0.0805 | 0.0766 | G1 |
3 | 0.8571 | 0.4048 | 0.1548 | 0.2262 | 0.0952 | 0.0929 | 0.0905 | G2 |
4 | 0.8641 | 0.4303 | 0.1748 | 0.2214 | 0.0864 | 0.0771 | 0.0785 | G3 |
5 | 0.9245 | 0.4581 | 0.1411 | 0.2378 | 0.894 | 0.0794 | 0.0788 | G4 |
6 | 0.8612 | 0.4014 | 0.1912 | 0.2210 | 0.0897 | 0.0847 | 0.0852 | G5 |
7 | 0.5606 | 0.2879 | 0.2414 | 0.1515 | 0.1212 | 0.1152 | 0.1147 | G6 |
8 | 0.8457 | 0.4328 | 0.1568 | 0.2108 | 0.0895 | 0.0652 | 0.0554 | G0 |
9 | 0.8904 | 0.4479 | 0.1388 | 0.2512 | 0.0842 | 0.0824 | 0.0847 | G1 |
10 | 0.8546 | 0.4112 | 0.1570 | 0.2274 | 0.0947 | 0.0932 | 0.0911 | G2 |
11 | 0.8678 | 0.4215 | 0.1736 | 0.2236 | 0.0868 | 0.0769 | 0.0793 | G3 |
12 | 0.9381 | 0.4790 | 0.1397 | 0.2395 | 0.0898 | 0.0798 | 0.0838 | G4 |
13 | 0.8582 | 0.4095 | 0.1859 | 0.2232 | 0.0893 | 0.0894 | 0.0815 | G5 |
14 | 0.5758 | 0.2769 | 0.2402 | 0.2143 | 0.1385 | 0.1077 | 0.1123 | G6 |
Table 5LSSVM and RBP neural network for fault identification contrast
Classifier | Training sample | Testing sample | Training time (s) | Diagnosis rate (%) |
LSSVM | 68 | 22 | 0.109 | 92.65 |
RBP | 68 | 22 | 0.188 | 88.24 |
6. Conclusions
In this work, a method combined with wavelet packet transform and LSSVM to solve main circuit fault diagnosis of HXD locomotive DC600V electricity supply device is proposed and verified. First of all, the theory of wavelet packet transforms and LSSVM are reviewed. And then, main circuit faults of electricity supply device are introduced. Further, the application of wavelet packet transforms and LSSVM to circuit fault diagnosis is verified with MATLAB simulation. Results show that the accuracies and time consumption of classification based on LSSVM are higher than that of the RBPNN.
References
-
Tao C., Shan-xu D., et al. A survey of fault diagnosis technology for power electronics system. Electrical Measurement and Instrumentation, Vol. 5, 2008, p. 1-7.
-
Hu Zhi-kun, Gui Wei-hua, et al. Wavelet fractal fault detection method of power electronic circuit. Control Engineering of China, Vol. 3, 2008, p. 337-341.
-
Jing-ding Cai, Ren-wu Yan Fault diagnosis of power electronic circuit based on wavelet analysis and random forests algorithm. Journal of Electronic Power Science and Technology, Vol. 2, 2011, p. 54-60.
-
Jiang Cui, You-ren Wang Testing the parametric faults of power electronic circuits applying classifiers fusion method based on fuzzy inference. Proceedings of the CSEE, Vol. 18, 2009, p. 54-59.
-
Yi Wu, Youren Wang Multiple parametric faults diagnosis for power electronic circuits based on hybrid bond graph and genetic algorithm. Measurement, Vol. 92, 2016, p. 365-381.
-
Hu Qing, Wang Rongjie, Zhan Yiju Fault diagnosis technology based on SVM in power electronics circuit. Proceedings of the CSEE, Vol. 12, 2008, p. 107-111.
-
Cai Jin-ding, Yan Ren-wu Fault diagnosis of power electronic circuit applying ARMA bispectrum and discrete hidden Markov model. Proceedings of the CSEE, Vol. 24, 2010, p. 54-60.
-
Gong G. S., Wang X. Load test and detection system of DC 600 V locomotive power supply device. Electric Drive for Locomotives, Vol. 5, 2011, p. 4-58.
-
Zhang B. K. Design and realization of fault diagnosis software for HXD3C electric locomotive power supply. Electric Drive for Locomotives, Vol. 5, 2012, p. 93-95.
-
Cai Jin-ding, Yan Ren-wu Fault diagnosis of power electronic circuit based on wavelet analysis and random forests algorithm. Journal of Electric Power Science and Technology, Issue 2, 2011, p. 54-60.
-
Liu M. C. Wavelet Analysis and Application. Tsinghua University Press, Beijing, 2013.
-
Han X. J. Research on Fault Diagnosis of Power Electronic Circuits Based on Wavelet Transform and Neural Network. Nanjing University of Aeronautics and Astronautics, 2008.
-
Astaf’eva N. M. Wavelet analysis: basic theory and some applications. Physics-Uspekhi, Vol. 39, 11, p. 1996-1085.
-
Chen P., Chen H. Y. Wind speed forecasting based on combination of wavelet packet analysis with support vector regression. Power System Technology, Vol. 35, Issue 51, 2011, p. 178-182.
-
Cortes C., Vapnik V. N. Support vector network. Machine Learning, Vol. 20, Issue 3, 1995, p. 237-297.
-
Suykens J. A. K., Vandewalle J. Least squares support vector machine classifers. Neural Processing Letters, Vol. 9, Issue 3, 1999, p. 293-300.
-
Vapnik V N. The Nature of Statistical Learning Theory. Tsinghua University Press, Beijing, 2005.
-
Bai P., Zhang X. B. Support Vector Machine and Its Application. Xidian University Press, Xi’an, 2008.
-
Chen P., Yuan L. F. An improved SVM classifier based on double chains quantum genetic algorithm and its application in analogue circuit diagnosis. Neurocomputing, Vol. 211, 2016, p. 202-211.
About this article

