Abstract
For the problem affected by speed and uneven grinding in abrasive flow with non-linear pipe, the T-tube is regarded as the research object, the numerical simulation of the flow state of the abrasive flow under different inlet velocities is carried out by using the large eddy simulation (LES). The dynamic pressure, turbulent kinetic energy, turbulence intensity and wall shear force under different inlet conditions are compared and analyzed. We can see from the numerical analysis that with the increase of inlet velocity, the dynamic pressure, turbulent kinetic energy, turbulence intensity and wall shear force also increase, and the polished effect is improved. The surface roughness and surface morphology of the T-tube workpiece before and after polished of abrasive flow are measured, the surface roughness decreased from 3.633 μm to 1.201 μm. Therefore, the effectiveness of the abrasive flow polished inner channel structure is confirmed, Also the credibility of numerical analysis is verified and provides theoretical support for the development of abrasive flow polished technology.
1. Introduction
In the increasingly technological development today, the precision of mechanical parts is put forward higher requirements by all fields. In the situation, ultra-precision machining technology transformed into the miniaturization, the parts for the miniaturization, high precision has become an inevitable trend. Due to the traditional processing methods have a natural drawback for miniaturized parts, especially the micro-hole, cross-hole structure, there are obvious limitations appearing in the traditional processing technology. The non-linear tube has wide applications in many areas, which make sure that the quality of the internal channel surface of the part cannot be ignored [1-3].
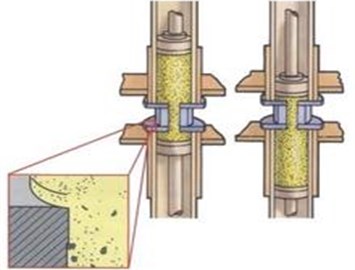
Abrasive flow machine (AFM) is a new processing technology, whose mechanism is that put solid-liquid two-phase abrasive that solid particles suspended in the liquid medium under external pressure through the inner surface of complex structural parts, after repeated grinding processing, the higher accuracy requirements can be achieved. The high precision of the inner surface of the complex structure with the abrasive flow is beyond the traditional processing technology. As a result, in the field of high-tech technology, abrasive flow processing technology is more widely used [4, 5]. However, unlike conventional processing methods, the abrasive flow machining technique is achieved by repeated contact friction between the fluid abrasive and the workpiece surface. And its environmental and saving. Abrasive flow polished parts schematic diagram is shown in Fig. 1.
Harmesh K. and other scholars through the experimental analyzed the different processing parameters to the effect of abrasive flow processing. The influence of different input parameters on material removal rate and surface roughness was analyzed by the principle of Taguchi experiment. It was observed that the extrusion pressure was the most significant factor affecting the material removal rate and surface roughness. And the influence factors of material removal rate and surface roughness were optimized by Taguchi method [6].
Fig. 1Abrasive flow polished parts schematic diagram
Wang Hanqing and other scholars illustrated the application of the large eddy simulation in the field of engineering field from the atmospheric and environmental science, turbulence numerical simulation, air flow, thermal energy engineering, and the application field and development trend of large eddy simulation were summarized [7].
Zhou Lei and other scholars combined with the recent years of research results about the large eddy simulation in the internal combustion engine proposed a comprehensive summary and introduction, and the research progress of large eddy simulation in fuel spray process is discussed [8].
The Solid-liquid two-phase flow is a complex form of turbulent motion. At present, the turbulence numerical calculation method is roughly divided into three types: Reynolds-averaged Navier-Stokes(RANS), Direct Numerical Simulation(DNS) and Large Eddy Simulation (LES). The Large Eddy Simulation can more accurately describe the flow in the elbow and the secondary flow.Consequently, the Large Eddy Simulation method can be used to simulate and analyze the grinding and polished process of abrasive flow. Turbulence is composed of vortexes of various scales. Among them, the large - scale vortex components mainly dominate the dynamic characteristics of turbulence, while the small-scale vortex is primarily dissipated. Large-scale vortex have obvious anisotropy, while small scales are closer to isotropic. The basic idea of Large Eddy Simulation is that the turbulence motion is divided into two parts: large scale and small scale by filtering function, and the instantaneous Navier-Stojes equation is used to directly simulate large - scale vortex in turbulence, and the effect of small-scale vortex on large-scale vortex and the whole flow field is solved by establishing subgrid model [9-12].
2. Simulation analysis of solid – liquid two – phase grinding gravity polished T – tube
As the T-tube in the field of mechanical and physical are widely applied, and the processing accuracy requirements are higher, so the T-pipe is selected as the text object. In this paper, the inlet diameter for T-pipe is set to 6 mm, and the outlet is 5.5 mm. The diagram for T-pipe is shown in Fig. 2. In the initial setup, the LES model and the SIMPLE algorithm are used, 20 % silicon carbide particles and hydraulic oil are used as the two-phase flow materials, boundary conditions select speed entrance and free exit. Both of the inlet 1 and inlet 2 have the same speed. The initial speed are respectively set to 25 m/s, 30 m/s, 35 m/s, 40 m/s. The numerical simulation for T-pipe is conducted.
2.1. Influence of different inlet velocities on dynamic pressure
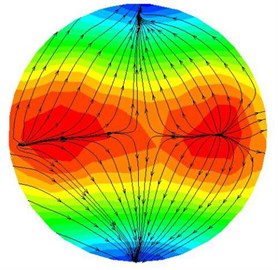
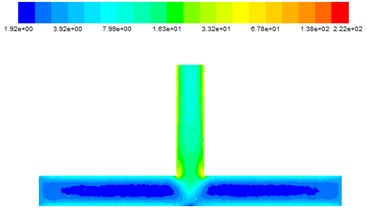
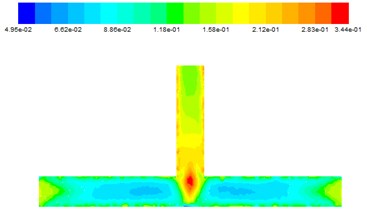
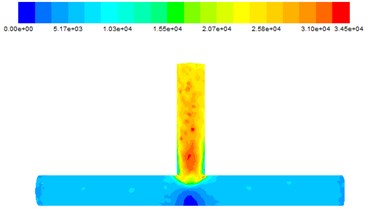
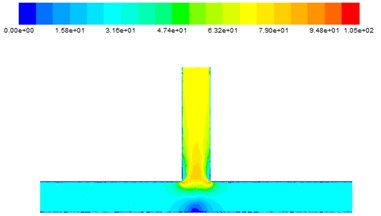
After the numerical simulation of the T-tube, the abrasive flow trajectory and dynamic pressure simulation are obtained, as shown in Fig. 3 and Fig. 4.
It can be seen from Fig. 4 that when the abrasive flows from the inlet 1 and the inlet 2 simultaneously flow into the pipe, the dynamic pressure is in the same state at both sides of the inlet. Both sides of the abrasive together into the intersection, the dynamic pressure at the intersection significantly increased. Due to the main road volume is relatively large, so there is no distinctive change in the main road. When the abrasive flow moves to the intersection, there is a obvious low pressure zone in the middle of the main road. According to the flow trajectories in Fig. 3, when the abrasive flow converge to the intersections, the abrasive flow increase dramatically and the dynamic pressure at the intersection gradually increases, which shows that polished effect the abrasive to the outlet is better, and higher processing accuracy can be received. And only a small part of particles in the middle of the main road, so the middle of the main road polished effect is fairly poor.
Fig. 2T-tube three – dimensional fluid model
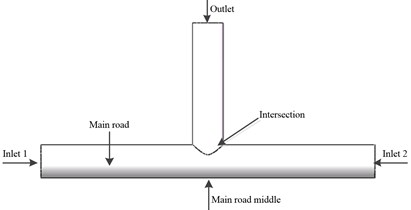
Fig. 3The abrasive flow trajectory
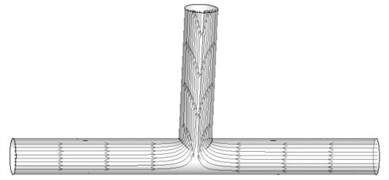
Fig. 4Dynamic pressure diagram at different inlet velocities
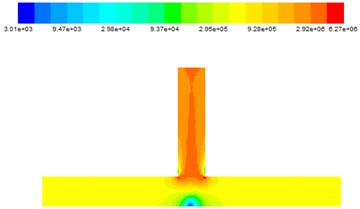
a) 25 m/s
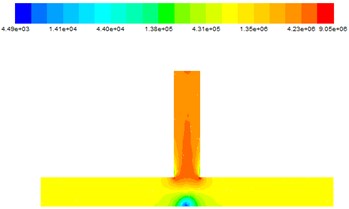
b) 30 m/s

c) 35 m/s
d) 40 m/s
In order to better analyze the collision polished mechanism abrasive flow on the wall, the abrasive movement in the outlet is analyzed. The cross-section and the abrasive flow trajectory for the T-tube in the outlet are shown in Fig. 5 and Fig. 6.
It can be detected from Fig. 6(a) that the vertex formed on both sides of the wall moves to the center, and the arrow represents the movement direction. Through the dynamic pressure can also be found that when the two sides of the flow move to the center, the dynamic pressure also becomes larger. The Fig. 6(b) indicates that when the abrasive flow converge at the center, the movement begins to move out of the center because the movement is still in an unstable state. At this time, most of the abrasive particles concentrated in the central part, as a consequence, the dynamic pressure in central part is higher than the wall. It can be obtained from Fig. 6(c) that after abrasive collision, the abrasive flow form two motion vortexes moving toward the wall. At this time, the abrasive particles due to the collision and rebound are more disorderly random. The Fig. 6(d) reveals that there is a vertex at center, and abrasive particles move around the wall, which demonstrate that the abrasive flow is in a stable state of motion, and the polished is more uniform.
Fig. 5The cross-section position
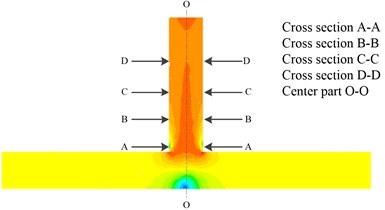
Fig. 6The abrasive flow trajectory diagram in cross-section
a) Cross-section A-A
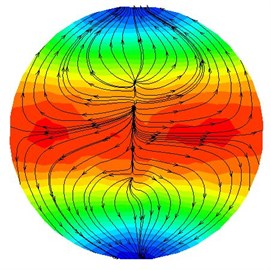
b) Cross-section B-B
c) Cross-section C-C
d) Cross-section D-D
In order to describe T-tube, its divided three parts: the inlet is set to No. 1, the middle of the main road is No. 2, the outlet is No. 3. The data is shown in Table 1.
Table 1Distribution table of dynamic pressure data at different inlet velocities
Inlet speed (m/s) | Dynamic pressure (×104Pa) | ||
NO. 1 | NO. 2 | NO. 3 | |
25 | 29.5 | 9.37 | 292 |
30 | 43.1 | 13.8 | 423 |
35 | 57.0 | 18.0 | 571 |
40 | 74.6 | 23.6 | 747 |
It can be seen from Table 1 that the inlet speed increases with the dynamic pressure increases In the NO. 2, the increase rate is small, the NO. 1 is relatively big, the NO. 3 is the largest. The T-tube internal dynamic pressure has increased, the polished effect is better. Through numerical comparison, it is found that the higher the inlet speed, the greater the dynamic pressure, the better the polished effect.
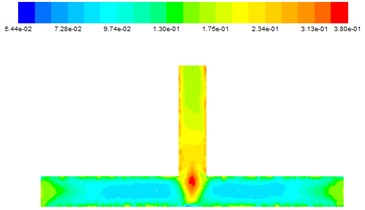
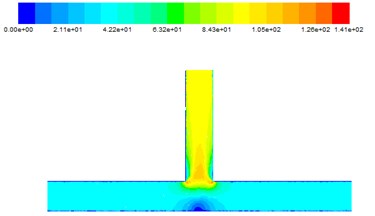
2.2. Influence of different entrance velocity on Turbulent kinetic energy
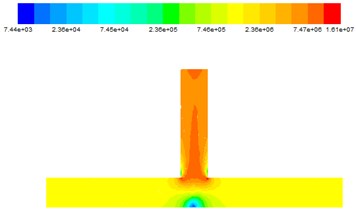
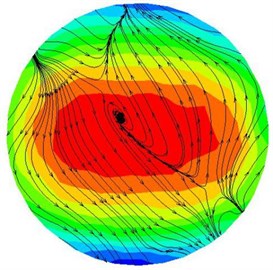
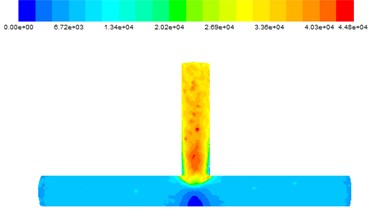
The effect of different inlet velocities on turbulent kinetic energy is shown in Fig. 7.
It can be seen from Fig. 7, with the flow of abrasive, abrasive particles on the main road turbulence kinetic energy is smaller. When the abrasive is converged at the intersection, the turbulence kinetic energy increases, as the abrasive enters the outlet, the turbulence kinetic energy continues to increase. Which confirm that the abrasive flow has the best effect at the intersection and the outlet. When the abrasive flows from the inlet into the T-tube, the turbulence kinetic energy decreases in the main tunnel. This is because in the entire abrasive flow processing process, with the abrasive flow on the wall of the polished effect, the abrasive energy is reduced, the initial kinetic energy is transformed into work and energy.
Fig. 7The turbulent kinetic energy diagram at different entrance velocity
a) 25 m/s
b) 30 m/s
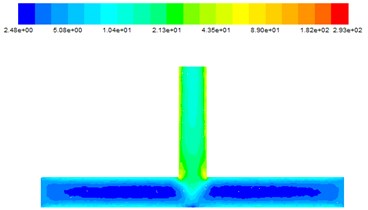
c) 35 m/s
d) 40 m/s
2.3. Influence of different entrance velocity on turbulent viscosity
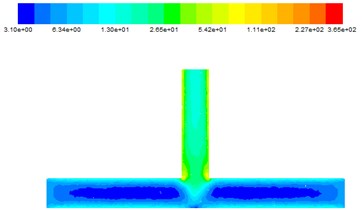
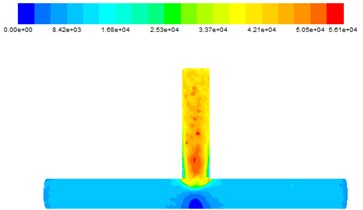
It can be learned from Fig. 8 that the variation of turbulent viscosity is large. When the abrasive just flows from the inlet into the main road, due to the impact, the inlet turbulence viscosity is large, and then slowly reduced in the form of parabola, the turbulence viscosity in the main channel gradually decreases from the wall to the inside, which means that the polished abrasive flow on the wall is more even. When the abrasive particles reach the intersection, the turbulence viscosity reaches the maximum. After entering the outlet, due to energy loss, the turbulence viscosity gradually weakened. Based on the above analysis, the outlet is selected as I, the main road is II, the intersection is III, the outlet section is IV, the outlet is V, the data of the turbulence viscosity at different inlet velocities are obtained as shown in Table 2.
It can be seen from Table 2 that at the same inlet speed, the value at III and IV is greater than the II, which reveal that the polished effect in the intersection and the outlet section is more obvious. Energy down a level from I to II, it illustrates that most of the energy is transformed into work. When the inlet speed increases, the turbulence viscosity also increases accordingly, indicating that when the speed is greater, the greater the turbulence viscosity, the better the processing effect.
Fig. 8The turbulent viscosity diagram at different entrance velocity
a) 25 m/s
b) 30 m/s
c) 35 m/s
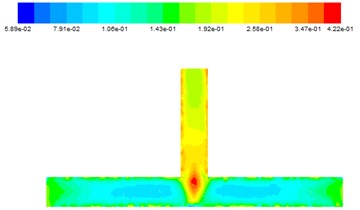
d) 40 m/s
Table 2Distribution table of turbulent viscosity data at different inlet velocities
Inlet velocity (m/s) | Turbulent viscosity (kg/m·s) | ||||
I | II | III | IV | V | |
25 | 0.107 | 0.080 | 0.307 | 0.190 | 0.142 |
30 | 0.118 | 0.089 | 0.344 | 0.212 | 0.158 |
35 | 0.130 | 0.097 | 0.380 | 0.234 | 0.175 |
40 | 0.143 | 0.106 | 0.422 | 0.258 | 0.192 |
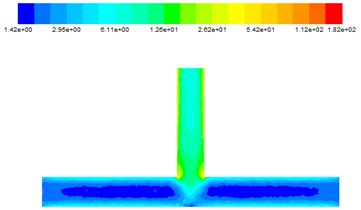
2.4. Influence of different entrance velocity on wall shear force
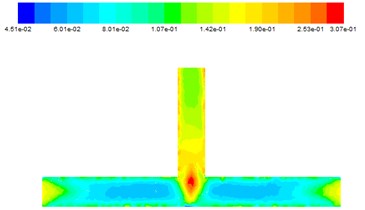
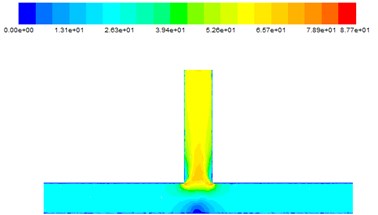
It can be found from Fig. 9 that the polished effect abrasive on the outlet section is more obvious, the main road polished is more uniform. There was a significant low value in the middle of the main road, it’s because that abrasives are gathered at the intersection, with only a few abrasives acting on the middle of the main road.
2.5. Influence of different inlet speed on speed
The Fig. 10. shows that with the inlet speed gradually increasing, the outlet speed also increases. When the abrasive enters the inlet, it moves at the constant speed in the main road. When moving to the intersection, the central speed of the main road is less than the speed at the entrance. It’s because part of particles energy is lost during polished. When both sides of the abrasive just moved together, a strong impact occurred, so the speed reached its maximum at intersection. With the abrasive flow in the outlet section gradually move, finally reach a stable state.
Fig. 9Wall shear force at different inlet velocities
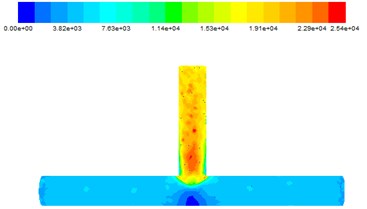
a) 25 m/s
b) 30 m/s
c) 35 m/s
d) 40 m/s
Fig. 10The speed diagram at different inlet speeds
a) 25 m/s
b) 30 m/s

c) 35 m/s
d) 40 m/s
3. Experimental analysis on the polished quality at different inlet speed
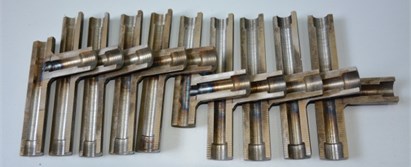
In order to verify the practicality of polished the T-tube at the different inlet speeds, four kinds of speed that 25 m/s, 30 m/s, 35 m/s, 40 m/s are chosen to carry out experiment for polished T-pipe. The unprocessed workpiece and four experiment samples are respectively labeled 01#, 02#, 03#, 04#, 05#. For effective testing, the T-tube is subject to destructive testing. First, the T-tube needs to be cut and then use acetone solution for ultrasonic cleaning, to ensure that the detection of T-tube wall is clean and smooth. the T-tube after cutting is shown in Fig. 11.
Fig. 11The T-pipe after cutting
3.1. Detection of workpiece surface roughness
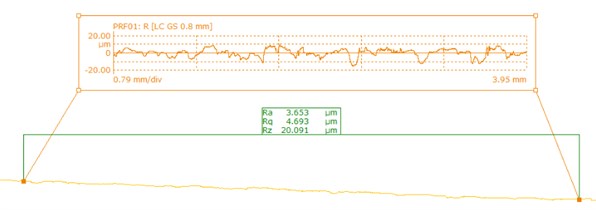
The surface roughness is detected by the Mahr stylus measuring instrument, and the measurement result was shown in Fig. 12.
Fig. 12The measurement result for the surface roughness of the workpiece
a) 01#
b) 02#
c) 03#
d) 04#
e) 05#
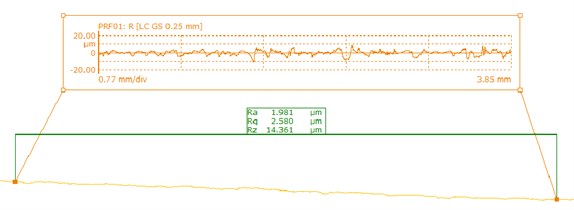
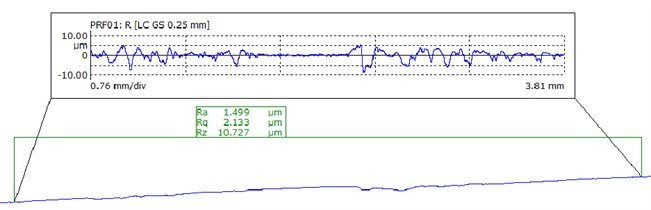
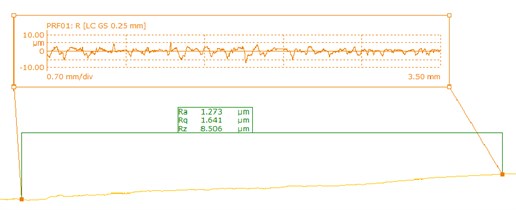
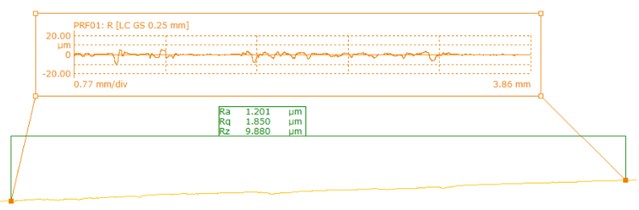
As shown in Fig. 12, there is a large fluctuation range for the surface roughness measurements before T-tube processing, while it gets smaller after polished. The inner surface quality of the T-tube is improved. In order to better analyze the polished effect, the average value of the surface roughness can be used as an evaluation index of surface roughness, the result is shown in Table 3.
It can be found from Table 3 that the average surface roughness of the T-tube before polished is 3.653 μm, the text results of the samples shows that there is a less fluctuation. The minimum value of the measurement is 1.201 μm and the maximum value is 1.981 μm. It is found that the surface accuracy of the pores is improved after the abrasive flow processing, and the surface quality is improved obviously. From the data in Table 3 can also be seen that the greater the entrance speed, the better the processing effect, which is conducive to enhance the surface quality of the workpiece.
Table 3The roughness experiment results
Number | 01# | 02# | 03# | 04# | 05# |
Average surface roughness (μm) | 3.653 | 1.981 | 1.499 | 1.273 | 1.201 |
3.2. Detection of surface morphology of workpiece
In order to better understand the improvement of the surface morphology of the orifice before and after processing, the surface morphology of the workpiece was further examined by electron microscopy, whose magnification is 1000. The surface morphology of the abrasive flow before and after polished is shown in Fig. 13.
The Fig. 13 indicates that the intersection and the inner surface of the small hole are rough before polished, and there are more defects, the inner surface is uneven. On the contrary, the inner surface after the abrasive flow processing is clear and the surface roughness of the common rail is obviously reduced and the surface morphology becomes better.
Fig. 13The surface morphology of the abrasive flow before and after polished
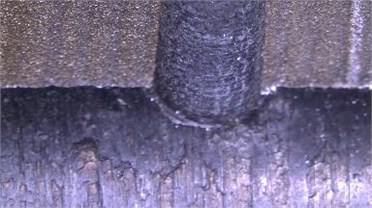
a) Before polished
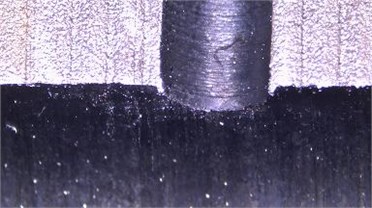
b) After polished
4. Conclusions
The numerical analysis of the T-tube was studied by grinding the abrasive flow at different inlet velocities shows that he higher the inlet speed, the higher the precision of the inner surface of the workpiece. But if the speed is too large, it will play the opposite effect. So, the choice of the inlet speed depends on the actual processing of the workpiece to ensure that it cannot also meet the polished requirements, but improve the polished efficiency.
Numerical analysis of dynamic pressure, velocity field and turbulent kinetic energy displays that with the increase of speed, the grinding effect is gradually improved. Through the analysis of the trajectory at the outlet, the movement path of the abrasive flow at the intersection and the outlet section and the collision between the abrasive flow and the wall are obtained, which provides a theoretical basis for the prediction of the actual polished effect and the development of the polished process.
In order to verify the correctness of the numerical analysis, the T-tube is selected to conducted experiment. which illustrates that after surface roughness and surface morphology at the intersection and outlet before and after polished were examined, it was found that the internal surface roughness of the T-tube after polished by the abrasive flow flow is 1.201 μm. The effectiveness and practicability of the processing of abrasive flow flow are confirmed.
References
-
Li Jun Ye, Liu Wei Na, Yang Li Feng, et al. Numerical simulation of flow characteristics of injector micropores. Coal Mine Machinery, Vol. 31, Issue 10, 2010, p. 56-58.
-
Li Jun Ye, Xu Ying, Yang Lifeng, et al. Experimental study on abrasive flow processing of non - linear tube parts. China Mechanical Engineering, Vol. 25, Issue 13, 2014, p. 1729-1733.
-
Liang Fang, Jia Zhao, Bo Li, et al. Movement patterns of ellipsoidal particle in abrasive flow machining. Journal of Materials Processing Technology, Vol. 209, 2009, p. 6048-6056.
-
Jani Kenda, Franci Pušavec, Janez Kopac Modeling and energy efficiency of abrasive flow machining on tooling industry case study. Procedia CIRP, Vol. 13, 2014, p. 13-18.
-
Gov K., Eyercioglu O., Cakir M. V. Hardness effects on abrasive flow machining. Journal of Mechanical Engineering, Vol. 59, Issue 10, 2013, p. 626-631.
-
Harmesh K. Experimental investigation and optimization of process parameters of Al/SiC MMCs finished by abrasive flow machining. Advanced Materials and Manufacturing Processes, Vol. 30, Issue 7, 2015, p. 902-911.
-
Wang Hui-Qing, Wang Zhi-Yong, Kou Guang-Xiao Progress of large eddy simulation theory and its application in engineering. Fluid Mechanics, Vol. 32, Issue 7, 2004, p. 23-27.
-
Zhou Lei, Jie Mao-Zhao, Luo Kai-Hong, et al. Study on the application of large eddy simulation in internal combustion engine. Acta Mechanica Sinica, Vol. 45, Issue 4, 2013, p. 467-482.
-
Sun T., Guo J. C., Sun H. O. Application of large eddy simulation in the performance study of wave blocker. Journal of Marine Science and Application, Vol. 4, Issue 4, 2005, p. 7-11.
-
Urbin G., Knight D. Large-eddy simulation of a supersonic boundary layer using an unstructured grid. AIAA Journal, Vol. 39, Issue 7, 2001, p. 1288-1295.
-
Rizzetta D. P., Visbal M. R., Gaitonde D. V. Large-eddy simulation of supersonic compression-ramp flow by high-order method. AIAA Journal, Vol. 39, Issue 12, 2015, p. 2283-2292.
-
Wang Bing, Zhang Hui-Qiang, Wang Xi-Lin, et al. Application of different subgrid patterns in large eddy simulation of turbulent flow in the back stage. Journal of Engineering Thermophysics, Vol. 24, Issue 1, 2003, p. 157-160.
Cited by
About this article

This work supported by the National Natural Science Foundation of China No. NSFC 51206011, Jilin province science and Technology Development Program of Jilin Province No. 20160101270JC and No. 20170204064GX, Project of Education Department of Jilin Province No. 2016386.
