Abstract
This article describes a method of frequency division equivalent for complicated impact signal. In the complex impact signal analysis and processing, instantaneous frequency often plays an important role, the instantaneous frequency represents the position of the frequency peak with time, complicated impact signal has their instantaneous frequencies at some point. The method first calculates the power spectrum of the original signal, then the power spectral curve is integrated, the mean square value curve of the whole frequency band is obtained, the frequency amplitude curve can be obtained by square of mean square curve. According to the 1 kHz bandwidth, equal intervals are segmented to the frequency axis, the total root mean square values of each frequency band are calculated respectively, the ratio of each component to the total root mean square value of the whole frequency band is the contribution rate of the frequency band to the whole signal amplitude.
1. Introduction
Since the frequency is the basic parameter that describes the characteristics of the signal, frequency estimation becomes one of the most important core technologies in signal processing, in many areas have a wide range of applications. From the perspective of the analysis domain, the frequency estimation method can be divided into time domain analysis method, frequency domain analysis method and time-frequency analysis method. Time-frequency analysis method refers to the time-frequency joint analysis of the signal, it is mainly used for instantaneous frequency estimation of nonlinear signal.
In the domestic and international commonly used complicated impact signal analysis and processing methods, Fourier transform, wavelet analysis, Hilbert-Huang transform and so on cannot effectively obtain the signal band distribution characteristics. For complicated impact signals that contain multiple components, the single value of its instantaneous frequency will not be guaranteed. The essential step in calculating the instantaneous frequency of a complex signal is to decompose the components of the complex signal one by one [1, 2].
2. Theory of equivalent method of frequency division
The complicated impact signal has a significant feature that the composition of the spectrum is very rich, there is little difference between low frequency and high frequency amplitude. It is difficult to find a criterion for the complex impact signal decomposition, filtering, extraction. Complicated impact signal can be considered as superposition of signals of different frequencies and amplitudes, the energy of each frequency signal is different. The autocorrelation function indicates the degree of correlation of random variables at two different moments, the power spectrum density of the signal can be calculated by the Fourier transform of the autocorrelation function. These two functions respectively characterize the basic characteristics of random signals from frequency domain and time domain:
In practical applications, by calculating the RMS value of the power spectral density in the frequency range of interest, the signal energy can be obtained. The power spectral density spectrum is a probabilistic statistical method. It is a measure of the mean square of a random variable, generally used for random vibration analysis [3]. The power spectral density is defined as the “power” (mean square value) in the component band. The power spectrum density is the instantaneous power of the response signal at different frequencies. The abscissa is the frequency (Hz), the ordinate is the power spectrum density (g2/Hz). Spectral density is usually estimated using Fourier transform techniques, but techniques such as Welch’s method and maximum entropy can also be used. One of the results of the Fourier analysis is the Parseval theorem, this theorem shows that the area under the energy spectral density curve is equal to the area of the square of the signal amplitude. According to the random vibration theory, calculate the area under the acceleration power spectral density curve to obtain the acceleration root mean square [4]. From the Eq. (2), we can see that the expression of the total energy:
Fig. 1Block diagram of equivalent frequency division method for complicated impact signal
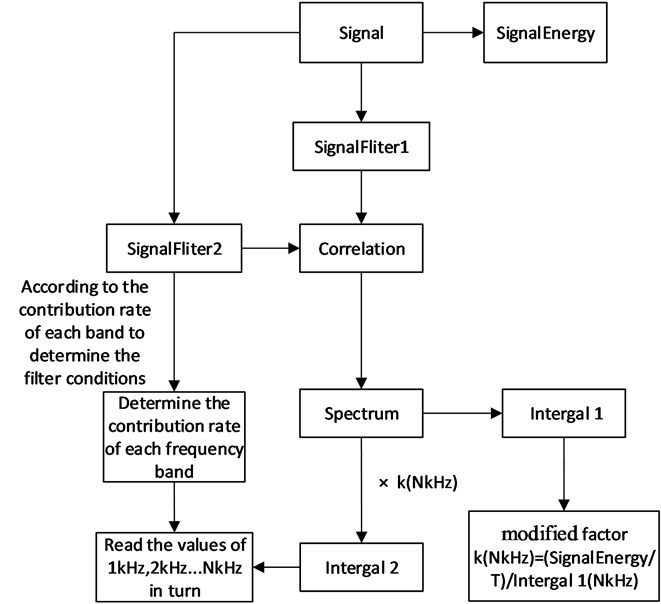
The detailed implementation steps of the frequency division method for complex impulse signals are shown in Fig. 1. First, filtering is processed according to the frequency band of interest, then the power spectrum density is analyzed. Next, the power spectral density curve is integrated, we can get the signal power curve of the whole frequency band and correct it. After the power curve is square, the total root-mean-square curve is obtained. The total RMS component is calculated for each 1 kHz segment. The ratio of each component to the total RMS value of the whole frequency band is the contribution rate of the frequency band to the whole signal amplitude. If from a frequency band to the maximum frequency band, the percentage is kept constant and remains constant, it can be considered from the beginning of this band are white noise. It can help to analyze the frequency band where the useful signal is located. According to the above analysis of the useful band information, we are re-filter the original shock signal, and repeat the process from power spectral density analysis to determine the contribution rate of each band to the entire signal amplitude. Finally, the contribution rate of each frequency band is obtained.
3. Case study
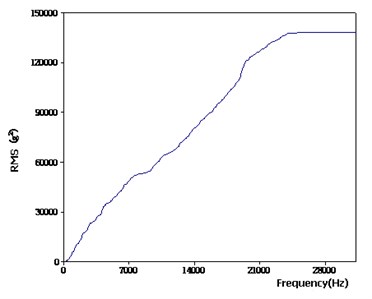
Fig. 2 is a vibration acceleration signal measured by an onboard memory. Filter the signal according to the frequency band of interest and calculate the signal energy E. The complicated impact signal is 20 kHz and three-ordered filtering, then the autocorrelation function of filtered signals is calculated. Next, Fourier transform is applied to the power spectral density curve and the power spectral density curve is integrated. The power curve of the acceleration signal can be obtained. In order to ensure that the time domain and frequency signal energy are equal, the original power spectral density curve must be a modified. The RMS curve is shown in Fig. 3.
Fig. 2The original waveform of complicated impact signal
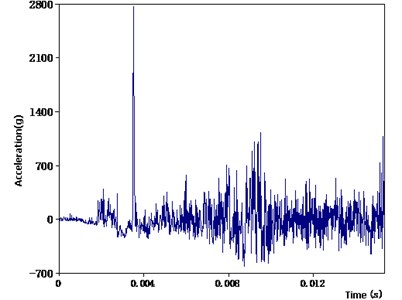
Fig. 3The mean square curve after the equivalent process
Multiply the original power spectral density curve by the correction coefficient :
In Eq. (3), is the signal energy, is the total duration of the signal, Intergal (NKHz) is the power value corresponding to the integral curve (this case at the 20 kHz frequency point). Then the corrected power spectrum density curve is integrated to get the power curve and the corrected power spectral density curve to integrate the power curve. The amplitude of the power curve at 1 kHz, 2 kHz, 3 kHz ... 20 kHz and other discrete frequency points for the frequency from 0 Hz to the corresponding frequency range of the total signal power. The total RMS values can be obtained after the total power of each frequency point is square. Then it is segmented by equal frequency domain (0 Hz-1 kHz, 1 kHz-2 kHz)... 19 kHz-20 kHz and calculates the difference between the total root mean square values of adjacent frequency points. Thus, the total RMS value of the acceleration in each frequency band within the equal interval frequency band (1 kHz) is obtained. The amplitude of the RMS value of each frequency band is represented by the contour line, and the ratio of each component to the total RMS value is the contribution rate of the frequency band to the whole signal amplitude, it should look as follows: Fig. 4.
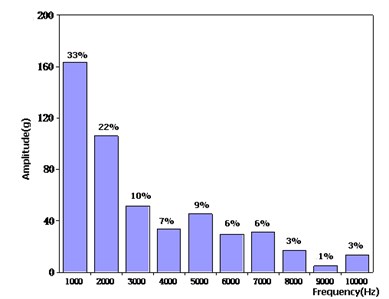
As can be seen from Fig. 4, the contribution of the amplitude of each frequency band from 10 kHz to 20 kHz to the whole signal amplitude is basically maintained at about 3 %. We can assume that the signals above the 10 kHz frequency are all white noise. And then re-filter the original impact signal, at this time using 20 kHz and three-ordered filtering. Repeat the process from calculating the autocorrelation function to determining the contribution of each frequency band to the whole signal amplitude. Finally, the total RMS value of the acceleration from each frequency band from 1 kHz to 10 kHz and the contribution rate to the whole signal amplitude are determined, it should look as follows: Fig. 5.
Fig. 4The contribution rate of each frequency band to the whole signal amplitude after the first equivalent
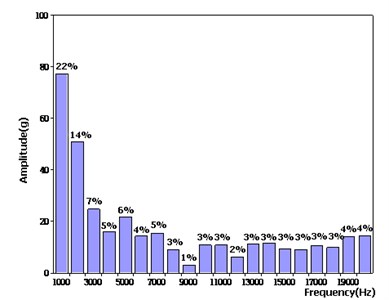
Fig. 5The contribution rate of each frequency band to the whole signal amplitude after the second equivalent
4. Conclusions
After the frequency division is equivalent, we can more accurately and effectively extract the useful signals in complicated impact signal, and determine the frequency band of white noise is helpful for further analysis and processing of signal, the contribution rate of each frequency band to the whole signal amplitude can be intuitively observed.
References
-
Tu Yaqing, Yang Huiyue, Zhang Haitao, Xiao Wei Study on frequency estimation methods and application for complicated signals. Journal of Logistical Engineering University, Vol. 31, Issue 6, 2015, p. 1-9.
-
Sun Mingqi A simple calculation method for RMS of power spectral density in random vibration. Proceedings of the Academic Conference on Electronic Mechanical and Microwave Structures and Processes, Vol. 8, 2014, p. 109-111.
-
Li Debao, Lu Qiuhai Engineering Vibration Test Analysis. Tsinghua University press, Beijing, 2004.
-
Chen Xiaohui, Yan Bing, Li Chaohua Research on time domain synthesis algorithm of shock response spectrum. Packaging Engineering, Vol. 28, Issue 2, 2007, p. 24-25.
About this article

