Abstract
In order to find the possibility of setting vibration mitigation measures at the transmission path for in-tunnel excitation source, a numerical calculation model of the tunnel and foundation was constructed. Using measurement vibration as the in-put excitation load, ground vibration propagation characters were calculated in cases of setting two common used vibration isolation measures, including open trench and buried concrete wall barrier. Calculation results indicated the open trench and buried concrete wall barrier can ideally shield the propagation of vibration induced by in-tunnel excitation source.
1. Introduction
With the rapid development of urban rail transit, environmental pollution caused by urban rail transit has gradually become an environment sensitive topic. To meet the needs of urban environment for traffic vibration control, in addition to the vibration control measures taken on the source, the control measures on the propagation path such as trenches and the partition wall and wave impeding block by the virtue of their effective control of low-frequency vibration, low-cost line investment and restoring the track structure to ensure the safe operation of the vehicle are more and more concerned [1]. Jones tested the vibration isolation effect of the vibration along the railway. The results show that when the depth of the trench is 3-5 m, the vibration of 6-8 Hz can be reduced by 5 dB [2]. With C found that the vibration peak of 41-67 % can be reduced in the range of 60 m by studying the vibration reduction effect of the fly ash isolation pile on the parallel railway near Goteborg [3]. Wei Hongliang conducted a numerical analysis of single row of pile vibration isolation [4]. Before the operating of Xi’an Metro Line 2, Ma Meng et al. studied the vibration isolation effect of the isolated row piles on the subway by numerical calculation [5]. Belgian CDM Company through theoretical analysis, model test and field test on the two layers of elastic material composite vibration wall were studied, the results show that the vibration effect is obvious [6].
However, for the issues on vibration mitigation measures at the transmission path, most of recorded academic papers were focused on the vibration isolation measures of the ground vibration source, especially the vibration induced by railway running on the surface of ground. But when the vibration source located in the tunnel, the surface vibration propagation mechanism is very different.
Therefore, in order to research on vibration mitigation measures at the transmission path for in-tunnel excitation source, a numerical calculation model of the tunnel and foundation was constructed by the FEM software ABAQUS. Using measurement vibration as the in-put excitation load, ground vibration propagation characters were calculated in cases of setting two common used vibration isolation measures, including open trench and buried concrete wall barrier.
2. Establishment of numerical simulation model
2.1. Selection of model size and unit size
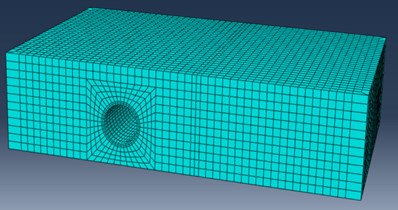
The size of the finite element model of wave motion is shown in Fig. 1. Due to this model is inerratic relatively, when meshing division, in order to accurately capture the wave effect, the unit size is less than or equal to 1/6 of the minimum wavelength in the soil, the maximum length of soil layer is 0.53 m. In the establishment of the calculation model, the actual unit length is taken as 0.25 m in the vibration response receiver area, the unit type is C3D8R (an 8-node linear brick, reduced integration, hourglass control), the calculation model is shown in Fig. 2.
Fig. 1Size of model
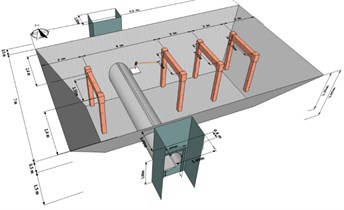
Fig. 2Diagram of calculation model
2.2. Selection of material parameters
Study shows that the dynamic perturbations in the soil are sufficiently small, so soil is considered by elasticity, but the material parameters using dynamic parameters. According to the structure of artificial soil, dynamic Poisson’s ratio and the mass density are also weighted by the thickness of the average. In order to ensure the corresponding soil shear wave velocity unchanged, the dynamic elastic modulus is calculated according to the formula, , In this formula, , , are corresponding Poisson’s ratio, shear wave velocity and mass density.
Table 1Material parameter
Geotechnical name | Density (kg/m3) | Elastic modulus (×107Pa) | Poisson’s ratio | Damping coefficient | Natural moisture content (%) | Liquid limit (%) | Plasticity index |
Silty clay | 1860 | 2.0 | 0.3 | 0.05 | 22-37 | 29 | 13 |
2.3. Setting of boundary parameter and load parameter
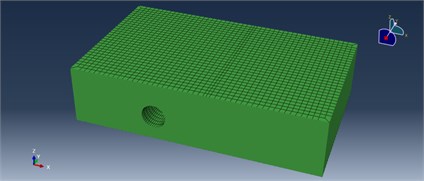
To minimize the effects of boundary reflections, infinite element boundary is used in the model boundary. The modified model is shown in Fig. 3.
Fig. 3Modified model
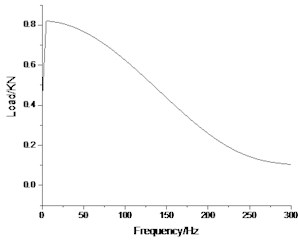
In order to be able to simulate the effect of the real load on the structure, the model uses the vibration load of the vibrating test.
Fig. 4Time history of load
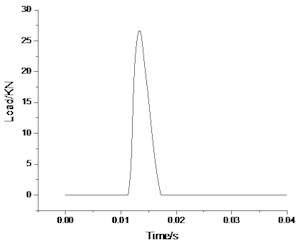
Fig. 5Frequency spectrum of load
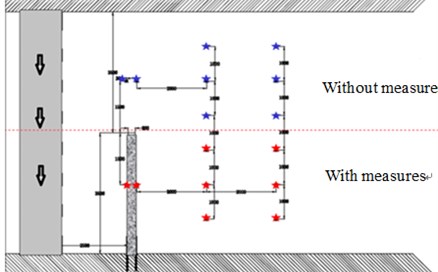
The load is applied to the middle of the tunnel, the south side of the tunnel, the north side of the tunnel, as shown in Fig. 6.
Fig. 6Load position
2.4. Damping and integral steps
In this paper, the top 10 modes of the system are extracted by ABAQUS characteristic analysis. The results of the modal analysis are shown in Table 2.
Table 2Modal analysis results
Modal order | 1 | 2 | 3 | 4 | 5 | 6 | 7 | 8 | 9 | 10 |
Modal frequency (Hz) | 4.39 | 5.28 | 6.78 | 7.02 | 7.36 | 7.41 | 7.69 | 7.89 | 7.90 | 7.91 |
According to the system modal analysis results, the damping coefficient is calculated by using the relatively large two-order modal frequencies of 4.39Hz and 5.28Hz, 0.144, 0.00165, at the same time in the time history analysis, in order to maintain sufficient accuracy, the integration of the time step should also be Satisfied no more than 1/10 of the considered highest step mode. So that the actual step size can be obtained, s, and the analysis time interval cannot be larger than the input load time interval. The actual integration time step is 0.005 s.
3. Numerical results
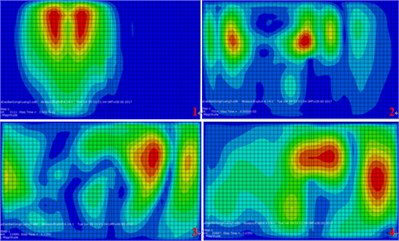
In order to express the qualitative effect of the vibration isolation measures in the propagation path, this paper adopts the cloud diagram of the surface vibration response with time, according to the results of three conditions-no measures, open trench and concrete wall, as shown in Fig. 7 to Fig. 9.
Fig. 7The developmental cloud diagram of surface vibration response with time (no measures)
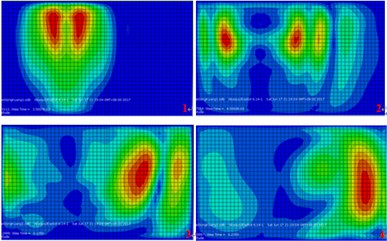
a) Excitation at the north side of the tunnel
b) Excitation at the south side of the tunnel
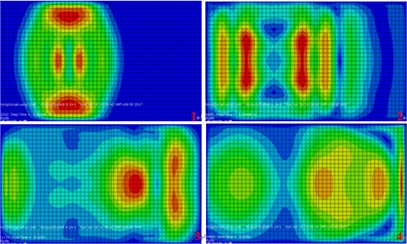
c) Excitation at the middle of the tunnel
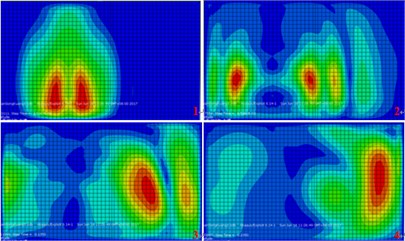
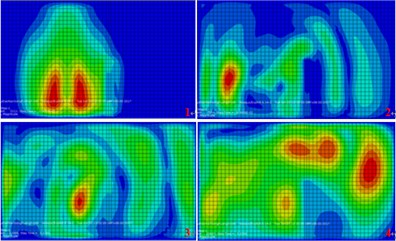
Fig. 8The developmental cloud diagram of surface vibration response with time (open trench)
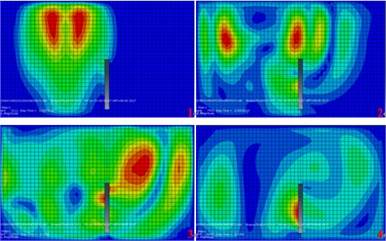
a) Excitation at the north side of the tunnel
b) Excitation at the south side of the tunnel
c) Excitation at the middle of the tunnel
It is clearly shown through the above cloud diagram:
1) In the case of setting no vibration isolation measures, the surface vibration propagation are good symmetry and consistency for both excitation at both south and north side of the tunnel. It also indicated when the excitation in the tunnel, surface vibration would distributed along the tunnel. And it should be figured out that the maximum amplitude appears is not exactly above the top of the tunnel.
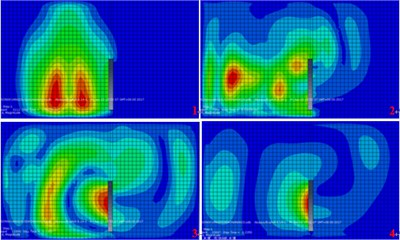
2) When open trench was adopted, the barrier effect was not obvious. When using buried concrete wall barrier, the vibration isolation effect is similar to that of the open trench in the time domain, and it was not obvious either.
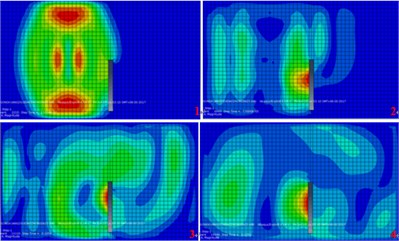
3) When using buried concrete wall barrier, due to the difference of vibration diffusion, the vibration of the surface behind the wall was obviously enlarged. This paper analyzes the causes of the phenomenon: The wave reflection and refraction phenomenon occurred, so that near the wall area, the vibration wave appears the effect of vector superposition. On the other hand, because the concrete wall itself has a natural frequency, a resonance phenomenon occurs, which is equivalent to a new vibration source.
Fig. 9The developmental cloud diagram of surface vibration response with time (buried concrete wall barrier)
a) Excitation at the north side of the tunnel
b) Excitation at the south side of the tunnel
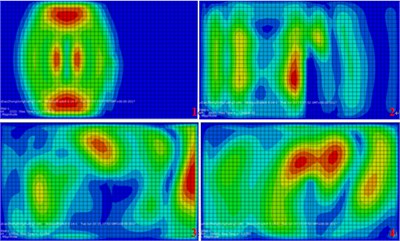
c) Excitation at the middle of the tunnel
4. Conclusions
Calculation results indicated the open trench and buried concrete wall barrier can ideally shield the propagation of vibration induced by in-tunnel excitation source.
However, the findings also indicated that the influence of the depth and width on the effective frequency range of vibration reduction should be further studied for open trench, while the influence of the depth, the wall thickness and the natural frequency on the vibration reduction effect should be paid much attention for concrete continuous wall.
References
-
He Xia Traffic Induced Environmental Vibrations and Controls. Science Press, Beijing, 2010.
-
Thompson D. Railway Noise and Vibration: Mechanisms, Modelling and Means. Elsevier Science, Amsterdam, 2009.
-
With C., Bahrekazemi M., Bodare A. Wava barrier of lime-cement columns against train-induced ground-borne vibrations. Soil Dynamics and Earthquake Engineering, Vol. 29, 2009, p. 1027-1033.
-
Wei Hongliang, Lei Xiaoyan, Lv Shaodi The field testing and prediction analysis for environmental vibration induced by railroad trains. Environment Pollution and Control, Vol. 30, Issue 9, 2008.
-
Ma Meng, Liu Weining, Ding Deyun Influence of metro train-induced vibration on Xi’an Bell Tower. Journal of Beijing Jiao Tong University, Vol. 34, Issue 4, 2010, p. 88-92.
-
Vanstraelen M. Trench, Isolation Modelling and Measurements CFR. The Test Bench. CargoVibes, Deliverable 3.3, CDM, 2012.
About this article

This work was under the support of Beijing Natural Science Foundation (No. 8164053) and the Postdoctoral Program Funds (2016ZZ-83).
