Abstract
Normally sensors can only be mounted on the outer shell of gearbox, which induce more difficulties to diagnose gearbox such as serious noise contamination, signal coupling and transmission path effect. Taking into account the unique structural characteristics of gearbox, this paper presents a novel method of using reconstructed energy and Support Vector Machine (SVM) to diagnose various failure or fault modes of gears, shafts and bearings. First, FFT is performed to get the frequency domain information of raw vibration signals. Then, a series of reconstruction filters are designed to remove unwanted information and enhance signal components of interest, which correspond to specific fault information of various elements. Finally, SVM is utilized to classify different faults such as bent shaft, broken gear and defect bearing. The proposed approach has proved to be effective in solving gearbox faults classification of the 2009 PHM Conference Data Analysis Competition.
1. Introduction
Gearbox, a highly efficient system, plays an irreplaceable role in modern industry. Advantages of gearbox, for instance, a stable transmission ratio, a large peripheral speed and power range, steady drive between various shafts, make it widely used in cars [1], aircraft [2], wind power generation system [3] and so on. In general, gearbox consists of bearings, shafts and gears internally, unlike parts with simple structure, its failure and fault modes are various. During operation, bearing failures may be scoring, wear, surface fatigue and brinelling. Gear may suffer plastic flow and fracture, wear, scoring, interference, surface fatigue and so on owe to harsh working environment. And shaft failures mainly include fatigue cracking and overload [4]. Because of the sealing of the gearbox, the sensor only can be installed on the outer shell of the gearbox normally, which results in an adverse conditions of diagnosis such as serious noise contamination, signal coupling and transmission path effect. Consequently, Gearbox fault diagnosis becomes a hard but meaningful task.
Although many scholars proposed various methods for gearbox fault diagnosis in the literature, such as wavelet decomposition [5], Hilbert Huang transform [6], Wigner-Ville distribution [7], but for extracting the full frequency domain information of the gearbox, FFT is more powerful. Energy of the particular frequency domain will change once gear, bearing or shaft failure, usually becomes bigger. Therefore, the primary work is to seek out the characteristic frequency and then extract features for gearbox diagnosis.
The diagnostic approach based on reconstructed energy and SVM is introduced systematically in Section 2. Detailed validation of this method is carried out in Section 3. Conclusion is carried out in Section 4.
2. Methodology
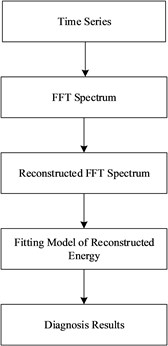
In this section, a new approach of gearbox fault diagnosis is presented, whose main steps are: (1) Transform raw vibration signals from time domain to frequency domain with Fast Fourier Transform (FFT). (2) Remove unexpected effects and retain the information of interest in FFT spectrum by employing the reconstruction filters and then obtain the reconstructed FFT spectrum. (3) Energy features are extracted from the modified FFT spectrum; (4) Eventually, SVM are employed to classify faults. Fig. 1 is a schematic diagram of the proposed approach.
Fig. 1Overview of reconstructed energy and SVM method
2.1. Reconstructed FFT spectrum
FFT, a fast algorithm for discrete Fourier transforms, widely used in signal processing. Some signals are difficult to discover its characteristics in time domain. Fault information will be much more intuitive when convert raw signals to the frequency domain. As a powerful time-frequency conversion tool, FFT retains a higher efficiency and faster speed. In addition, FFT can extract the spectrum of a signal out of the spectrum. There are many other analysis tools have been developed in the literature, such as Hilbert-Huang Transform for time-frequency analysis, wavelet transform, Wigner-Ville distribution, power spectrum, spectrum for frequency domain analysis, autoregressive moving average, model for time domain analysis and time synchronous average [8].
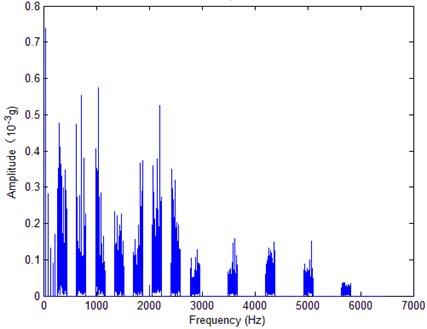
The main purpose of reconstructed FFT spectrum analysis contains the following aspectes: (1) Remove noise or outside interference to reduce signal contamination; (2) Filter and assemble without loss of fault information and look closely at certain frequency components of interest; (3) Features can be extracted from reconstructed FFT spectrum directly. Fig. 2. and Fig. 3. are initial FFT spectrum and reconstructed FFT spectrum respectively.
Fig. 2Initial FFT spectrum
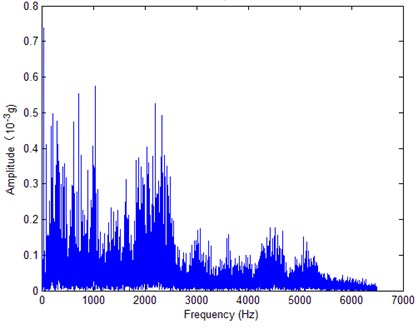
Fig. 3Reconstructed FFT spectrum
2.2. Support vector machine
Support vector machine (SVM) proposed by Vapnik in 1995, a small sample statistic learning method based on structural risk minimization, which famous for its unique advantages in solving small sample, nonlinear and high-dimensional pattern recognition. Through a nonlinear mapping p, SVM is capable of mapping the sample space to a feature space of high-dimensional so much as an infinite-dimension, which make the nonlinear separable problem in the original sample space is transformed into a linearly separable problem in the feature space [9].
3. Results
3.1. Experimental facilities
The data sets used in this paper come from the 2009 PHM Conference Data Analysis Competition. three groups helical gears with different healthy states are selected for pattern recognition classification. The first group is on good condition, the second group and the third group have different failure parts, the detailed information listed in Table 1.
Table 1Fault modes chosen of the samples
Gear box | Case | Normal | Fault 1 | Fault 2 |
Gear | 16T | Good | Good | Good |
48T | Good | Good | Good | |
24T | Good | Chipped | Good | |
40T | Good | Good | Good | |
Bearing | IS:IS | Good | Good | Good |
ID:IS | Good | Good | Good | |
OS:IS | Good | Good | Good | |
IS:OS | Good | Good | Good | |
ID:OS | Good | Good | Good | |
OS:OS | Good | Good | Good | |
Shaft | Input | Good | Good | Bent Shaft |
Output | Good | Good | Good |
3.2. Reconstructed FFT spectrum and feature extraction
The failure of different parts of the gearbox will be reflected in different frequencies. In fault mode 1, the gear with 24 teeth is chipped, its gear meshing frequency and side band frequencies are the most remarkable frequencies. In fault mode 2, the bending of the input shaft produces harmonic frequency components of shaft rotating frequency. Therefore, the interest frequencies are GMFs and shaft rotating frequencies. The detailed interest information retained by filters in this article is shown in Table 2. 272 times FFT are carried out in each condition and the number of data points involved in each FFT is 131072.
3.3. Fault classification based on support vector machine
In the following, 816 samples with extracted features are divided into two parts and be sent to SVM classifier respectively, for one part that has 612 samples as training data set of SVM classifier and the other that has 204 samples as testing data set of SVM classifier.
As can be seen from Table 3, the approach based on reconstructed FFT spectrum and SVM has a stable diagnostic effect that all of the accuracies are higher than 0.89 and nearly three quarters are accurate to 100 percent, even though the gearbox under different loads and speeds.
Table 2Filters used to reconstructed FFT spectrum
Filters | Functions of reconstruction filters | Corresponding meaning of filter functions |
1 | Retaining 02X order component | Characteristic frequency component of bent input shaft |
2 | Retaining 06X- 10Xorder component | Output-shaft helical 1X GMF |
3 | Retaining 14X-18X order component | Input-shaft helical 1X GMF Output-shaft helical 2X GMF |
4 | Retaining 22X-26X order component | Output-shaft helical 3X GMF |
5 | Retaining 30X-34X order component | Input-shaft helical 2X GMF Output-shaft helical 4X GMF |
6 | Retaining 38X-42X order component | Output-shaft helical 5X GMF |
7 | Retaining 46X-50X order component | Input-shaft helical 3X GMF Output-shaft helical 6X GMF |
8 | Retaining 54X-58X order component | Output-shaft helical 7X GMF |
9 | Retaining 62X-66X order component | Input-shaft helical 4X GMF Output-shaft helical 8X GMF |
10 | Retaining 78X-82X order component | Input-shaft helical 5X GMF |
11 | Retaining 94X-98X order component | Input-shaft helical 6X GMF |
12 | Retaining 110X-114X order component | Input-shaft helical 7X GMF |
13 | Retaining 126X-130X order component | Input-shaft helical 8X GMF |
Table 3Accuracy of input signals classification based on Reconstructed and SVM
Variety | Load | 30 Hz | 35 Hz | 40 Hz | 45 Hz |
Input side data | High 1 | 1.0000 | 1.0000 | 0.8971 | 1.0000 |
High 2 | 1.0000 | 1.0000 | 1.0000 | 1.0000 | |
Low 1 | 1.0000 | 0.9510 | 0.9559 | 1.0000 | |
Low 2 | 1.0000 | 1.0000 | 1.0000 | 0.9755 | |
Output side data | High 1 | 1.0000 | 0.9167 | 0.9118 | 1.0000 |
High 2 | 1.0000 | 1.0000 | 1.0000 | 1.0000 | |
Low 1 | 1.0000 | 0.9755 | 0.9608 | 1.0000 | |
Low 2 | 1.0000 | 0.9951 | 1.0000 | 1.0000 |
4. Conclusions
A novel method that about the diagnosis of gearbox based on reconstructed FFT spectrum and SVM has been introduced in this article. The validity and accuracy of the algorithm are verified by real data, and the test results shows that the approach of this paper have a good robustness. The next work will be focus on how to solve the problem of multiple working conditions in one test.
References
-
Praveenkumara T., Saimuruganb M., Krishnakumarb P. Fault diagnosis of automobile gearbox based on machine learning techniques. Procedia Engineering, Vol. 97, 2014, p. 2092-2098.
-
Faris E., David M., Cristobal R.-C. A comparative study of adaptive filters in detecting a naturally degraded bearing within a gearbox. Case Studies in Mechanical Systems and Signal Processing, Vol. 3, 2016, p. 1-8.
-
Ragheb A., Ragheb M. Wind turbine gearbox technologies. 1st International Conference on Nuclear and Renewable Energy, 2010.
-
Forrester B. D. Advanced Vibration Analysis Techniques for Fault Detection and Diagnosis in Geared Transmission Systems. Swinburne University of Technology, 1996.
-
Sung C. K., Tai H. M., Chen C. W. Locating defects of a gear system by the technique of wavelet transform. Mechanism and Machine Theory, Vol. 35, Issue 8, 2000, p. 1169-1182.
-
Huang N. E., Shen Z., Long S. R., et al. The empirical mode decomposition and the Hilbert spectrum for nonlinear and non-stationary time series analysis. Proceedings of the Royal Society of London A: Mathematical, Physical and Engineering Sciences, Vol. 454, 1998, p. 903-995.
-
Baydar N., Ball A. A comparative study of acoustic and vibration signals in detection of gear failures using Wigner-Ville distribution. Mechanical Systems and Signal Processing, Vol. 15, Issue 6, 2001, p. 1091-1107.
-
Wu F., Lee J. Information reconstruction method for improved clustering and diagnosis of generic gearbox signals. International Journal of Prognostics and Health Management, Vol. 2, 2011, p. 004.
-
Joachims T. Making Large-Scale SVM Learning Practical. Technical Report, SFB 475: Komplexitätsreduktion in Multivariaten Datenstrukturen, Universität Dortmund, 1998.
About this article

This study is supported by the Fundamental Research Funds for the Central Universities (Grant No. YWF-17-BJ-J-42 and YWF-16-BJ-J-18) and the National Natural Science Foundation of China (Grant Nos. 51605014 and 51575021), as well as the Technology Foundation Program of National Defense (Grant No. Z132013B002).
