Abstract
Knowing how a musical instrument vibrates can benefit the tonal characteristics shaping of the instrument. In this research, an approach for investigating the mode shapes and natural frequencies of Setar body is addressed. First, mechanical properties of wood used in the production of Setar are analyzed experimentally. Then a numerical modal test is performed to find the mode shapes and natural frequencies of Setar structure. To validate the results obtained by the numerical method, experimental modal testing is also done for the structure, and it is found that the results of both the methods are in good consistency. As the vibration pattern of plates is of utmost importance in the production of musical instruments, vibration patterns of a Setar plate are experimentally extracted and the results are compared with finite element analysis.
1. Introduction
Modal analysis is one of the important methods utilized by researchers to study the vibrations of different structures and their system identification [1-8]. This method is also employed to investigate the vibrational properties of the stringed musical instruments.
Different music instruments have been modeled for the numerical vibration analysis. The numerical analysis goes back to researches history on the instrument making techniques by luthiers. The developed instrument models are used to improve the instrument’s sound quality after evaluating by the experimental techniques. Marshall [9], Bissinger [10] and Mellody and Wakefield [11] studied the modal properties of a violin through experimental techniques. Knott et al. [12] utilized a finite element computer program to investigate the vibrations of a violin, and validated the results by other experimental tests. Bretos et al. [13] also studied the frequency responses and vibration patterns of the box and violin free plates by finite element analysis and evaluated the results with other researchers’ experimental measurements. A mesh model of high-frequency violin body resonances has also been studied by Huang et al. [14]. Elejabarrieta et al. [15-17] used modal test and finite element method to study the vibrations of a guitar soundboard. They also investigated the coupled modes of the guitar’s resonance box. Modal characteristics of the guitar have also been presented by Boullosa [18], Bader [19] and Curtu et al. [20]. Saati Khosroshahi et al. [21] presented an experimental modal analysis of a Kamancheh Persian bowed membrane stringed musical instrument. The experimental data have also been compared with finite element analysis data from the literature in their study. Saati Khosroshahi et al. [22] employed finite element modeling and modal test on Persian Tar and Kamancheh and considered the vibrational properties of membrane string instruments. Acet and Saati [23] investigated the sound performance of composite materials as the soundbox of membrane instruments. Mansour et al. [24-27] studied Finite Element Modeling of Setar, a Persian long-necked lute, under CATIA, Hyper Mesh, Nastran, and Hyper Graph software. They also performed a modal test on the sound box, extracted its Frequency Response Function (FRF), and considered the effect of the bridge on the produced sound. The vibrational analysis of whole Setar structure as well as its soundboard haven’t been investigated in the reported literature, and the methods conducive to reach this understanding is of importance which fill the existing gap in this respect.
In this research, vibrations and modal characteristics of the whole structure of Setar is investigated. To this end, a three-dimensional (3D) model of Setar structure is extracted using 3D laser scanner, and the obtained cloud of points is modeled under CATIA. Setar’s CAD model is sent out to ANSYS Workbench, and to obtain the mode shapes and natural frequencies, the finite element modal analysis is utilized. The results by finite element method are further evaluated through experiments. In the experimental modal analysis, impulse force excites Setar vibration and its response is recorded. The vibration measurement points of whole Setar structure are chosen at the different positions of soundbox and neck. A comprehensive investigation with results of experimental testing is then considered to update and examine the model. The results of both experimental and numerical approaches are in good consistency. As the vibration pattern of plates and soundboards are of utmost importance in the production of musical instruments, vibration patterns of a Setar plate are experimentally extracted and the results are evaluated.
2. Setar structure
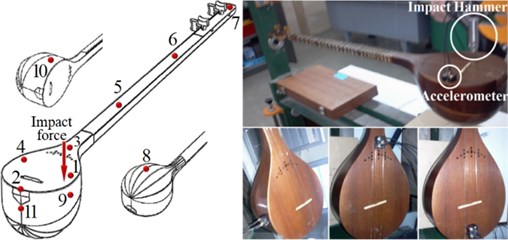
Setar (from se, meaning “three” and tar, meaning “string”) is a Persian chordophone that returns to heaps of years ago. This instrument is a member of the long-necked lute family of musical instruments, and its initial sound is produced by a stretched vibrating string. Setar is a fretted stringed instrument and the index fingernail of the right hand acts as a plectrum to strum the strings. The earlier Setars had three strings, however, the current ones have four white, yellow, drone and bass strings, and the drone and bass strings are considered as a course. These strings respectively tune at 262 (Hz) C4, 196 (Hz) C3, 262 (Hz) C4, and 131 (Hz) C3. 831 (Hz( G5# is Setar’s highest tone. It has 22 to 28 moveable frets made of animal gut, silk, and scarcely nylon or metal. Pressing each string against a fret makes the vibrating length of the string. consisting a soundboard plate and a bowl makes Setar’s reflective soundbox which is made of mulberry wood, and Setar has not any internal frames, bars or struts. Setar has around 10 soundholes on its soundboard which affect the vibration of the plate. The schematic of Setar is shown in Fig. 1.
Fig. 1Setar’s schematic view
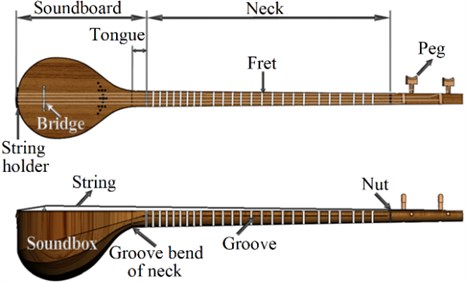
The strings are fastened from the pegs to the string holder passing from the bridge apex. Hence, the bridge plays the role of a nonideal pointwise base and transfers the strings’ vibrations to the Setar structure. The bridge is not glued to the plate, it is kept in its location by the friction forces due to the strings’ static load. In comparison with violin’s bridge, Setar’s Bridge is wider and lower. Therefore, the effect of the natural frequencies of the bridge on the properties of the structure is negligible. The bridge does not contribute to modal characteristics, and it can be considered as a vibration isolator between the body and the strings. The whole instrument plays a transfer function role between the string excitation and the generated sound. The direct sound of string has not a major influence on the whole resultant sound since the sound is produced from the vibration of the instrument structure [26].
3. Modeling procedure
In absence of a reliable precise model, manufacturing procedure of the musical instruments are based on experiences of luthiers rather than a certain design. Therefore, a representative and reliable model will benefit an efficient time and cost economic manufacturing process. Here, Setar has been considered to make such a reliable precise model.
3.1. 3D CAD model
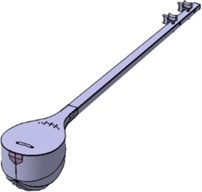
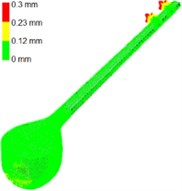
Laser scanning is one of the most precise techniques that reduces the measurement error to a justifiable minimum amount. To produce the surface geometry of Setar structure, a 3D laser scanner imager 5006 h of Zoller Frohlich company has been used which can record 1.016.027 pixels per second. Here, the scanning has been performed in three different angles toward the Setar structure, and the obtained cloud of points has been registered under Laissez Faire la Musique (LFM) software. The processed cloud of points has been imported to the Digitized shape editor environment of CATIA software under ASCII file extension and meshed with 6.8 (mm) mesh length. Fig. 2(a) illustrates the scanned cloud of points for Setar structure, and the meshed and modified structure has been presented in Fig. 2(b). The surface of Setar structure has been created under Quick Surface of CATIA and the tolerance of 1 (mm). The produced surface has been modified to the volume under Generative Shape Design of CATIA. The other parts such as bridge, pegs, and string holder have been assembled on Setar structure under Assembly Design environment, and Fig. 2(c) shows the final model. The error between the developed model and the primary cloud of points has been presented in Fig. 2(d). This error can be attributed to:
• The scanner error which has been reported 0.2 (mm) in its catalog.
• The operator error during the registration of the different scanned clouds of points in LFM.
• The possible errors during meshing.
Fig. 2Setar modeling procedure: a) scanned cloud of points, b) meshed and modified model, c) final assembled model, d) the comparison of the model and the preliminary cloud of points
a)
b)
c)
d)
3.2. Mechanical properties of wood
The use of wood in the production of musical instruments is directly related to its mechanical and vibrational characteristics. In general, the lower tangential damping, and the higher ratio of elastic modulus to damping ratio in the axial direction together with higher anisotropy are necessary to achieve the higher quality of resonance plate. Walnut wood is used to make Setar’s neck, bridge and pegs, and the soundbox is made by mulberry wood. the direction of grains highly affects the mechanical properties of wood. Wood has to be modeled as an orthotropic material. Therefore, it has independent and unique mechanical characteristics in radial, longitudinal, and tangential directions. is the longitudinal axis parallel to the grain (fiber); is the radial axis normal to the formation rings (normal to the grain in radial axis), and is the tangential axis tangent to the growth rings and perpendicular to the grain.
Nine independent and three other constants are necessarily needed to explain the wood elastic behavior: three elastic modulus , three rigidity modulus , and six Poisson’s ratios .
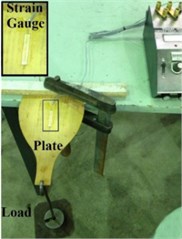
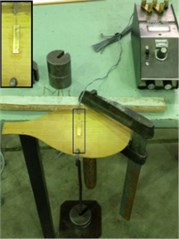
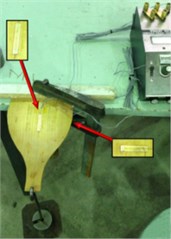
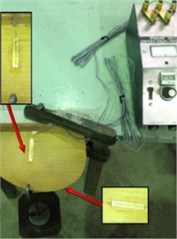
Fig. 3The experimental setup for extracting: a) EL, b) ER, c) μLR, d) μRL
a)
b)
c)
d)
Elasticity gives that the produced deformations of low stress are thoroughly retrievable after removing the loads. Higher loads and stress levels lead to plastic deformation or failure. Three elastic modules indicated by , , and are the modules of elasticity about the longitudinal, radial, and tangential wood axes, respectively.
When an axial load is exerted on a member, the deformation normal to the load direction is proportional to the deformation parallel to that. The transversal to axial strain ratio is Poisson’s ratio. These ratios are indicated by , , , , and . The subscripted first letter denotes the applied stress direction and the second letter denotes the lateral deformation direction.
The elastic ratios, and the constants themselves, and Poisson’s ratios change within and between wood species and are influenced by specific gravity and moisture content.
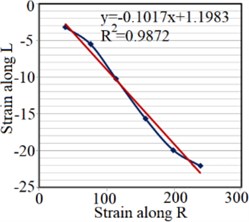
To extract elastic modules of Setar’s wood, a strain gauge produced by Tokyo Sokki Kenkyujo, type PFLW-30-11-3L, is used. The strain gauge is installed on the plate along longitudinal and radial axes for and , which are respectively presented in Fig. 3(a) and (b). Moreover, to determine Poisson’s ratios two strain gauges are installed on both sides of the plate, perpendicular to each other as shown in Fig. 3(c) and (d). Strains along radial and longitudinal directions are measured under different loads applied at the end of the plate. Transfer sensitivity of strain gauges reported by the producer is used to calculate the real strains.
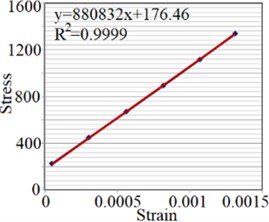
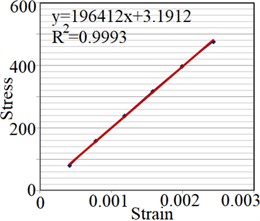
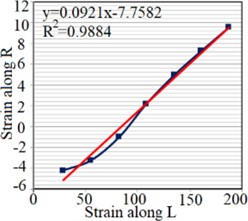
The strain is measured under different loads applied on the end of the plate, and stress magnitude, elasticity modulus and Poisson’s ratio along the mentioned axes are determined (Fig. 4).
Doing this process to extract , , , , , and is not possible and because of their low importance in numerical analysis, we referred to provided data in handbooks [28]. The physical properties of both types of woods, used in the Setar structure, measured for the wooden plate used in the structure of the test (see Table 1).
Table 1The physical characteristics of woods used in Setar structure
Wood | (GPa) | (GPa) | (GPa) | Density (kg/m3) | Damping ratio | ||||||
Mulberry | 6.073 | 1.354 | 0.486 | 541 | 0.012 | 0.092 | –0.102 | 0.44 | 0.051 | 0.36 | 0.684 |
Walnut | 7.96 | 8.10 | 9.12 | 510 | 0.010 | 0.495 | 0.052 | 0.632 | 0.035 | 0.378 | 0.718 |
Fig. 4Strain test result for extracting: a) EL, b) ER, c) μLR, d) μRL
a)
b)
c)
d)
4. Modal analysis of Setar structure
Chordophones are complex structures from the vibrational aspect. The string force passing from the bridge excites the whole structure, and it is the primary input to the structure of instrument [29]. In this respect, the whole structure plays a filter role that transforms the force of the string to the sound. Material properties, dimensions of the body and the bridge and shells’ thicknesses are the basics to investigate the vibrational characteristics of musical instruments.
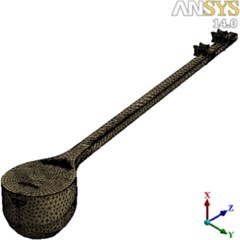
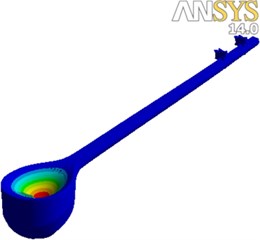
To produce a finite element model, a 3D model of Setar is exported to ANSYS Workbench. Longitudinal, radial land tangential elastic modules, damping and poison’s ratio, and density are set as input data for orthotropic material properties. Afterwards, the model elements are created under the solid element, and the discretized model is prepared for free-free FEM modal analysis. Fig. 5(a) shows the discretized model in ANSYS Workbench.
Fig. 5a) The discretized model of Setar prepared for free-free FEM modal analysis under ANSYS Workbench, b) free-free experimental modal testing, roving accelerometer technique
a)
b)
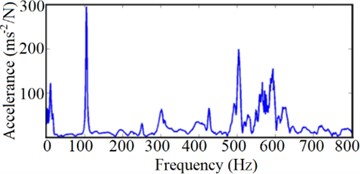
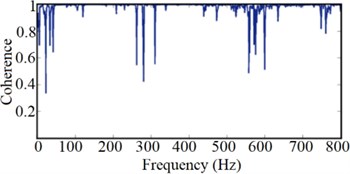
The experimental modal analysis is also performed for Setar structure. The steps of the experimental test are: at first, appropriate boundary conditions, and the actuating forces are exerted; afterward, the system response is measured together with the exerted forces. By extracting the FRFs, we obtain the modal parameters. To find the mode shapes and natural frequencies, a Setar, a hammer (type 8202, B&K Inc.), and a piezoelectric accelerometer (type 4507, B&K Inc.) are employed. By the pulse system (type 3560, B&K Inc.), the signal of the hammer force and accelerometer have been gathered and analyzed. The roving accelerometer approach is chosen for the free-free modal test. In this technique, the impacts are exerted in a specific point of Setar (on the soundboard, in – direction) to obtain the response for each point on Setar, the points are illustrated in Fig. 5(b). The accelerometer captures the responses in all axes separately for each of eleven chosen points; hence, 33 various responses are gathered for different points and directions. The FRF curves have been extracted between the selected points using Fast Fourier Transform (FFT) algorithm. The outcomes have been illustrated as FRFs via PULSE Labshop software. Fig. 6 shows an extracted FRF and the related coherence curve.
Fig. 6a) The FRF from modal test, b) the related coherence curve
a)
b)
The natural frequencies of Setar structure are obtained through numerical modal analysis. In continuance, the modification of numerical model is accomplished. To further validate the results by FEM, the experimental natural frequencies are also extracted using ME’scope software. All over of the considered domain, viz [0 3000] (Hz), 20 natural frequencies have been figured out for Setar structure. The frequencies by both numerical and experimental testing of Setar structure are listed in Table 2.
Table 2Natural frequencies of Setar structure by both FEM and experimental modal analysis
Test | 7.43 | 75.7 | 117 | 147 | 218 | 280 | 294 | 344 | 392 | 440 | 486 | 515 | 553 | 609 | 681 | 707 | 773 | 802 | 862 | 994 |
FEM | 9 | 62 | 106 | 159 | 223 | 304 | 312 | 358 | 401 | 435 | 491 | 529 | 571 | 612 | 670 | 713 | 755 | 808 | 870 | 998 |
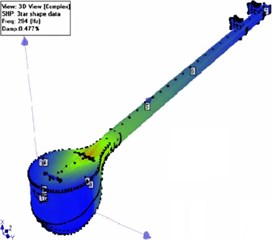
It is of note that each frequency by finite element method modal testing is remarkable by a vibration mode shape. For example, in Fig. 7(a), the fifth mode shape is presented which shows one longitudinal half-wave on the soundboard, and one transverse half-wave. In Fig. 7(b), the fifth vibration mode shape obtained by experimental modal testing results analysis under ME’scope software is presented which shows that results of both the numerical analysis and experimental test are in consistency.
Fig. 7The 7th vibration mode obtained by: a) finite element modal analysis, frequency = 312 Hz, b) experimental modal testing, frequency = 294 Hz
a)
b)
5. Vibration patterns of soundboard
Vibration pattern of plates is one of the important subjects for researchers and musical instrument producers. Producers use these patterns to know about characteristics of the plate they use for producing and for tuning the plates. However, there is no any information reported for Setar in previous literature. The producers of Setar utilize experimental methods to produce and improve its noise. Therefore, it is necessary to do researches and extract Setar’s vibration patterns to improve productions. Here, the vibration patterns of Setar plate are experimentally extracted and the results are compared with numerical analysis under Abacus.
When the plate is excited, every point of the plate began to vibrate with different amplitudes, according to vibration frequency. To illustrate this phenomenon, some sand is poured on the Setar’s plate, so that the sand be thrown out of the plate or store in the points with zero amplitude. In some frequencies, sand forms a regular pattern on the plate. These points are nodals with zero amplitudes. These patterns, however, will be one dimensional, as the plate is 2D. The formed patterns under these lines are named Chladni patterns [30]. The same nodal patterns can be achieved by installing microscale materials on Faraday waves, as well [31].
Here, to detect the shape of nodal patterns and their frequencies in Setar’s plate, it is placed on the electromagnetic vibrator, type 4806, produced by B&S company. Using pulse lab shop software and vibration setup, type 3560, the plate is vibrated from frequency 0, and sand is poured on the plate during frequency increase. The first pattern of sand forms in a certain frequency and other patterns also form by increasing frequency. Nodal pattern’s shapes and related frequencies are registered in each step. This procedure, moreover, has been done for two different plates and data has been recorded. The obtained results are in good agreement. To validate the patterns obtained by experimental test, the FEM modal analysis of plate is performed under Abacus. The free-free condition has been applied for FEM modal analysis. 1028 elements have been used to mesh the crust. The results obtained by both the techniques are shown in Table 3.
Table 3Natural frequencies of soundboard plate obtained by numerical and experimental tests
1st mode | 2nd mode | 3rd mode | 4th mode | 5th mode | 6th mode | |
FEM modal Analysis | 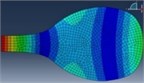 | 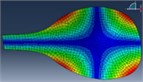 | 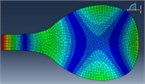 | 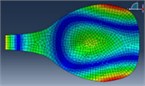 | 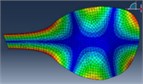 | 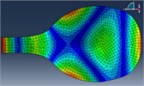 |
110 Hz | 164 Hz | 197 Hz | 278 Hz | 325 Hz | 480 Hz | |
Experimental modal test | 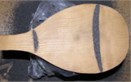 | 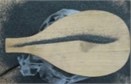 | 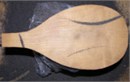 | 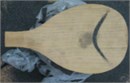 | 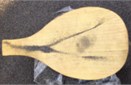 | 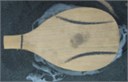 |
105 Hz | 147 Hz | 172 Hz | 260 Hz | 285 Hz | 340 Hz |
6. Conclusions
In this research, modal analysis of the whole Setar structure and its soundboard was addressed. Orthotropic properties of both mulberry and walnut woods were obtained through experiments and literature. The finite element numerical modal analysis was performed under ANSYS Workbench for Setar structure. The vibration patterns of Setar’s soundboard plate were also extracted numerically under Abacus. The correctness and validity of the numerical models of Setar and its soundboard were corroborated through experimental modal tests. Finally, a model validation was performed by comparing the results obtained by the numerical model and modal test.
References
-
Maia N. M. M., Silva J. M. M. E. Theoretical and Experimental Modal Analysis. John Wiley and Sons, New York, USA, 1997.
-
Pedrammehr S., Farrokhi H., Rajab A. K. S., Pakzad S., Mahboubkhah M., Ettefagh M. M., Sadeghi M. H. Modal analysis of the milling machine structure through FEM and experimental test. Advanced Materials Research, Vol. 383, 2012, p. 6717-6721.
-
Yayli M. Ö. A compact analytical method for vibration of micro-sized beams with different boundary conditions. Mechanics of Advanced Materials and Structures, Vol. 24, 2017, p. 496-508.
-
Pedrammehr S., Mahboubkhah M., Khani N. Natural frequencies and mode shapes for vibrations of machine tools’ hexapod table. 1st International Conference on Acoustics and Vibration, 2011.
-
Ettefagh M. M., Behkamkia D., Pedrammehr S., Asadi K. Modal analysis of the bridge dynamic response in a stochastic vehicle-bridge interaction. KSCE Journal of Civil Engineering, Vol. 19, 2015, p. 220-232.
-
Pedrammehr S., Mahboubkhah M., Qazani M. R. C., Rahmani A., Pakzad S. Forced vibration analysis of milling machine’s hexapod table under machining forces. Strojniški vestnik – Journal of Mechanical Engineering, Vol. 60, 2014, p. 158-171.
-
Yayli M. Ö. Free vibration behavior of a gradient elastic beam with varying cross section. Shock and Vibration, Vol. 2014, 2014, p. 801696.
-
Pedrammehr S., Mahboubkhah M., Khani N. Investigation of factors influential on the dynamic features of machine tools’ hexapod table. 2nd International Conference on Acoustics and Vibration, 2012.
-
Marshall K. D. Modal analysis of a violin. The Journal of the Acoustical Society of America, Vol. 77, 1985, p. 695-709.
-
Bissinger G. Modal analysis of a violin octet. The Journal of the Acoustical Society of America, Vol. 113, 2003, p. 2105-2113.
-
Mellody M., Wakefield G. H. The time-frequency characteristics of violin vibrato: Modal distribution analysis and synthesis. The Journal of the Acoustical Society of America, Vol. 107, 2000, p. 598-611.
-
Knott G. A., Shin Y. S., Chargin M. Modal analysis of the violin. Finite Elements in Analysis and Design, Vol. 5, 1989, p. 269-279.
-
Bretos J., Santamarı´a C., Alonso Moral J. Vibrational patterns and frequency responses of the free plates and box of a violin obtained by finite element analysis. The Journal of the Acoustical Society of America, Vol. 105, 1999, p. 1942-1950.
-
Huang P., Serafin S., Smith J. O. A waveguide mesh model of high-frequency violin body resonances. Proceedings of the International Computer Music Conference, 2000, p. 86-89.
-
Elejabarrieta M. J., Ezcurra A., Santamaria C. Evolution of the vibrational behaviour of a guitar soundboard along successive construction phases by means of the modal analysis technique. The Journal of the Acoustical Society of America, Vol. 108, 2000, p. 369-378.
-
Elejabarrieta M. J., Ezcurra A., Santamaria C. Vibrational behaviour of the guitar soundboard analysed by the finite element method. Acta Acustica united with Acustica, Vol. 87, 2001, p. 128-136.
-
Elejabarrieta M. J., Ezcurra A., Santamaria C. Coupled modes of the resonance box of the guitar. The Journal of the Acoustical Society of America, Vol. 111, 2002, p. 2283-2292.
-
Boullosa R. R. Vibration measurements in the classical guitar. Applied Acoustics, Vol. 62, 2002, p. 311-322.
-
Bader R. Computational Mechanics of the Classical Guitar. Springer-Verlag Berlin Heidelberg, 2005.
-
Curtu I., Stanciu M., Cretu N., Rosca I. Modal analysis of different types of classical guitar bodies. Proceedings of the 10th WSEAS International Conference on Acoustics and Music: Theory and Applications, 2009, p. 23-25.
-
Saati Khosroshahi F., Sepahvand K., Mguttler M., Pourtahmasi K., Marburg S. Modal analysis of the Persian music instrument Kamancheh: an experimental investigation. ISMA Le Mans, 2014.
-
Saati Khosroshahi F., Sepahvand K., Marburg S. Modal analysis of membrane string instruments: finite element modeling and experimental investigation. Inter-Noise and Noise-Con Congress and Conference Proceedings, Vol. 253, Issue 2, 2016, p. 6342-6346.
-
Acet R. C., Saati Khosroshahi F. Sound performance investigation of composite materials for the soundbox of a membrane musical instrument. The 22nd International Congress on Sound and Vibration, 2015.
-
Mansour H., Kasaiezadeh A. R., Arzanpour S., Behzad M. Finite element modeling of Setar, a stringed musical instrument. ASME Conference Proceedings, Vol. 15, 2009, p. 591-597.
-
Mansour H., Arzanpour S., Alghassi H., Behzad M. Vibrationan alysis of Setar for extracting the frequency response function (FRF). ASME Conference Proceedings, Vol. 15, 2009, p. 485-490.
-
Mansour H., Arzanpour S., Alghassi H., Behzad M. An experimental investigation on the bridge effect in sound produced by Setar. ASME Conference Proceedings, Vol. 15, 2009, p. 491-495.
-
Mansour H. Modal analysis of the Setar: A numerical – experimental comparison. Journal of Vibration and Acoustics, Vol. 137, 2015, p. 0610061.
-
Matweb L. L. C. Matweb: Material Property Data. 2013, http://www.matweb.com/search/DataSheet.
-
Jansson E. V. Acoustical properties of complex cavities and measurements of resonance properties of violin shaped and guitar-shaped cavities. Acustica, Vol. 37, 1977, p. 211-21.
-
Chladni, E. F. F. Discoveries in the Theory of Sound. Leipzig, 1787, p. 78, (in German).
-
Chen P., Luo Z., Güven S., Tasoglu S., Ganesan A. V., Weng A., Demirci U. Microscale assembly directed by liquid‐based template. Advanced Materials, Vol. 26, 2014, p. 5936-5941.
Cited by
About this article

Siamak Pedrammehr responsible for experimental and numerical modal analysis of Setar structure. Nima Jafar Zadeh Aghdam – modal analysis, patterns of Setar soundboard and experiments to extract mechanical properties. Sajjad Pakzad done experimental modal analysis of Setar structure. Mir Mohammad Ettefah – experimental modal analysis of Setar structure and soundboard. Morteza Homayoun Sadeghi – experimental modal analysis.
