Abstract
In order to obtain the optimum forming process of the Former tube, two forming schemes were made based on the actual production and processing experience and theory. The two forming schemes were simulated by DEFORM-3D. The optimal forming scheme was determined and the influence of different friction factors and different mould hardness on mould wear and forming load were analyzed; The research results of this paper can provide theoretical guidance for the production and processing of the former tube parts, which can improve the machining quality and precision of the parts, reduce the cost of the test module, and obtain a better shaping effect.
1. Introduction
Cold extrusion technology is a kind of high quality and low cost of near net shape forming process. The Front tube forming process is cold extrusion processing [1]. The shape of the top of the Front tube is more complicated, and the depth of the bore is larger, leading to poor extrusion process, and the law of flow is more difficult to grasp. In order to reduce the material consumption and save time, numerical simulation research on the process of compaction, compound extrusion and anti-extrusion by using DEFORM-3D software can repeat the forming process simply, efficiently, accurately and continuously. Sub-calculation and optimization analysis can improve the actual processing of materials utilization and efficiency [2, 3].
Through the analysis and research, two kinds of technological schemes of the Front Tube were raised, and the forming effect of the extrusion, the compound extrusion and the anti-extrusion were obtained based on the finite element software DEFORM-3D, the different friction factors and different Die hardness. The impact of the amount of mold wear and forming load reaches some practical value as well as the actual production and processing of the Front tube, which is of great significance.
2. Front tube forming process analysis
2.1. Billet size determination
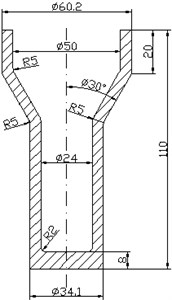
All the formulas in this chapter refer to the literature [4]. Cold extrusion of the Front Tube Figure 1 shows that the use of 20Cr processing Former tube parts and the size of the extrusion are free dimensions, thus cold extrusion can meet the accuracy requirements. Calculated according to the principle of the same volume, the volume of cold extrusion Billet usually consists of the volume of extrusion and the volume of trimming margin.
Billet volume formula as shown in Eq. (1):
where – billet volume, (mm3); – extrusion volume, (mm3); – trim margin volume, (mm3).
In the mid of cold extrusion, according to the national standard bar diameter, the initial selection of Billets diameter shall set as Ø60 mm in order to ensure that the Billet can be placed in the cavity of the cavity Bottom die.
After calculating the diameter of the Billet, the cross-sectional area should be calculated. The Billet height is determined by the following Eq. (2):
where – billet volume, (mm3); – cross-sectional area, (mm2).
Preliminary determination of the size of the Billet: Ø60×25.3 mm.
Billet rough height-diameter ratio is less than 0.8, which is not suitable for Cutting the material (fracture was crushed, and the quality cannot be guaranteed), thus the use of turning cutting shall be adopted.
Fig. 1Front tube cold extrusion diagram
2.2. Process option to determine
According to the structural characteristics of the extrusion, two kinds of process options are initially proposed.
The process of scheme one: The use of turning cutting → Softening heat treatment → Surface treatment → Phosphating + Saponification and lubrication → Embossing (End extrusion height is 5 mm) → Lubrication treatment → Compound extrusion (Internal extrusion hole depth 7 mm) → lubrication → Anti-extrusion (Front Tube forming process entity diagram model shown in Fig. 2).
Fig. 2Option a front tube forming process entity diagram

a) Blank
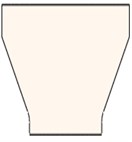
b) Compression
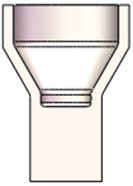
c) Composite extrusion
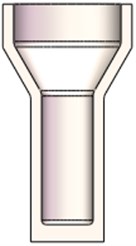
d) Reverse extrusion
The process flow of the second scheme was as follows: The use of turning cutting → Softening heat treatment → Surface treatment → Phosphating + Saponification and lubrication → Embossing (End extrusion height is 26 mm) → Lubrication treatment → Compound extrusion (Internal extrusion hole depth 7 mm) → Lubrication → Anti-extrusion (Front tube forming process entity diagram model shown in Fig. 3).
Fig. 3Option two Front tube forming process entity diagram

a) Blank
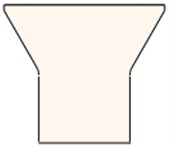
b) Compression
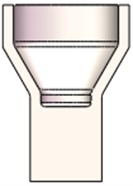
c) Composite extrusion
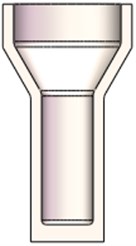
d) Reverse extrusion
1) Compression rate of composite extrusion section is calculated as follows Eq. (3):
Anti-extrusion section reduction rate is calculated as the following Eq. (4):
The determination of the range of allowable deformation degree is crucial. It is the basis for judging the feasibility of the technological scheme. The range of its size is mainly affected by two key factors: the performance of the extruded material and the way of extrusion. In accordance with the scope of the maximum allowable squeeze calculated Eq. (5) and the maximum allowable deformation range of reverse squeeze Eq. (6), the maximum allowable degree of deformation could be calculated:
Reverse squeeze minimum allowable degree of deformation range Eq. (7) calculates the minimum allowable degree of deformation:
The maximum permissible deformation of the extrusion: [] = 77.6 %-82.6 %. The maximum permissible deformation of the anti-extrusion: [] = 67.5 %-77.5 %. The minimum allowable deformation of the anti-extrusion: [] = 25.6 %-35.6 %. After calculation, the deformation degree of composite extrusion is 69.4 % and the deformation degree of reverse extrusion is 49.5 %, which is less than the allowable deformation degree. So, it is reasonable.
2) The aspect ratio of the working part of the top die: 60/24 = 2.5.
In order to prevent the slender top die broken, the general working part of the top die diameter should not exceed 2.5 to 3, which is qualified.
By calculating, both options are reasonable.
2.3. Before extrusion billet pre-treatment process
Song Yanping and Wang Hongge et al. [6] considered that the softening heat treatment during cold extrusion has the best effect of spheroidizing annealing. Therefore, the method used to soften heat treatment is spheroidizing annealing. Billet before extrusion or extrusion processes are used to phosphating + saponification lubrication.
3. CAE model establishment and parameter setting
Solidworks software were used to complete the pressing, composite extrusion, punching process blank, punching and die and other parts of the three-dimensional model. The using of DEFORM-3D software to establish the corresponding FEM models for the two process options are then started for simulation [7, 8]. The established FEM model is shown in Fig. 4 and Fig. 5.
Fig. 4Option a FEM model

a) Compression

b) Composite extrusion

c) Reverse extrusion
Fig. 5Option two FEM model

a) Compression

b) Composite extrusion

c) Reverse extrusion
Before carrying out numerical simulation analysis, we must first determine the process parameters set in the simulation process. The simulation parameter values are shown in Table 1.
The Archard model is used to predict die wear during extrusion [9-11]. The Eq. (8) is as follows:
where represents the mold wear depth; , , are standard values, take 1, 1, 2; represents the wear rate; represents the normal pressure on the contact surface between the die and the extrusion; represents the wear coefficient, value of 2×10⁻⁵.
Table 1Simulation parameter values
Object | Material | Number of grids | Friction factor | Initial temperature / °C | Extrusion speed /mm·s-1 | Die hardness / HRC |
Billet | 20Cr | 51676 | 0.12 | 20 | 10 | |
Bottom die | Cr12MoV | 28167 | 55 | |||
Top die | Cr12MoV | 26667 | 55 |
4. Two kinds of options forming effect comparison chart
Fig. 6 is a scheme of forming effect diagram. When top die is pressed down to 230 steps, and the top of the unevenness has been very obvious, which is due to the upper billet too much, resulting in the encounter with a convex top die, and the convex. The shorter the distance between the mold taper and the mold taper. The more slanting the slab occurs. So, there is an uneven end face. When the pressure is reduced to 300 steps, the contact area of the top die becomes larger, and the resistance encountered is larger, and the pressing speed of the top die slows down, and the flow velocity of the surrounding metal material becomes faster. Resulting in the separation of the inner hole of the billet and the lower end of the top die. Continue to press, due to the top die gap is small, the upper end of the beginning of filling the blank, and the billet reaches the bottom. Continue to press. The upper metal will flow between the top die and the hole, resulting in a larger fold, internal porosity and other defects. Due to severe metal damage, severe flow, the top die is subject to the load over its own range, automatically stop.
Fig. 6Option scheme a forming effect

70 step

b) 140 step

c) 230 step

d) 300 step
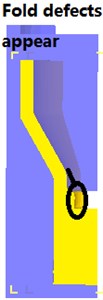
e) 370 step
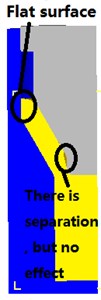
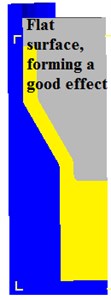
Fig. 7 is a scheme of forming effect diagram. The top die down to 360 steps down, and the end surface is still very smooth, stable metal flow, without any defects, and the top die down to 480 steps, and the end face smooth transitional concave round corner position The top die and leather separation, but will not affect the quality of the extrusion, Fig. 7(e) shows that the extrusion is complete, without any defects, essentially free of burrs, forming good results.
Fig. 7Option two forming effect diagram

a) 120 step

b) 240 step

c) 360 step
d) 480 step
e) 600 step
5. Explore of the compound extrusion process of different factors on the forming load and the impact of the amount of mold wear
In order to explore the influence of different factors of composite extrusion process on forming load and die wear, set different parameters, set the parameters as follows:
1) Range of friction factor. Under normal circumstances, the design of cold extrusion die. The mold surface by grinding and processing, and phosphating + saponification lubrication, and the friction coefficient can reach 0.05 to 0.1 [12]. To ensure the optimization of space, taking the friction factor range of 0-0.15.
2) Mold material hardness range, after heat treatment, Cr12MoV mold material hardness can reach 63 HRC. Hardness range to take 50-63 HRC.
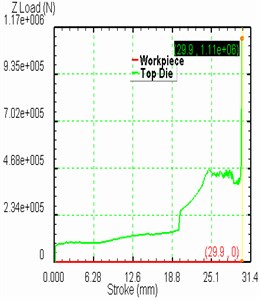
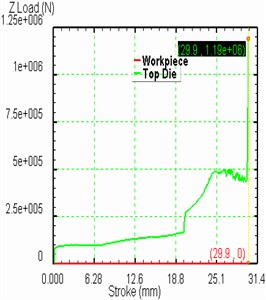
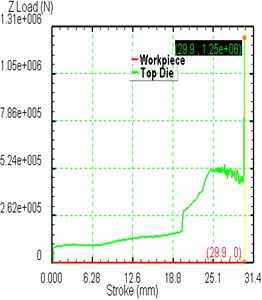
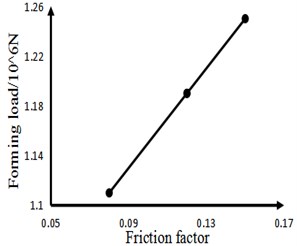
Fig. 8 shows the distribution of the influence of different friction factors on the forming load. After the contact between the top die and the billet, the billet begins to deform plastically, and the resistance of the punch increases and the forming load also increases. The amount of mold press continues to increase, when entering the first corner to enter the second corner position billet deformation is more intense. So, the slope of the first phase greater; the amount of downward pressure to continue to increase punch the second corner, the large end position into the rigid translation zone, the forming load is basically no major fluctuations, but also stable, but the big end position is smaller, the stability zone is smaller, when the billet and the current limiting sleeve Contact. It is subject to the current limit sets the pressure to the billet, making the sharp increase in forming load. When the friction coefficient is 0.08, the maximum value of forming load is 1.11×10⁶ N; when the friction coefficient is 0.15, the maximum value of forming load is 1.25×10⁶ N. Fig. 8(d) shows that the forming load is proportional to the friction factor within a certain range.
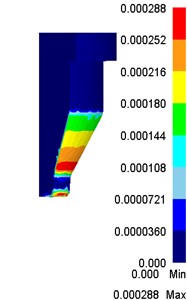
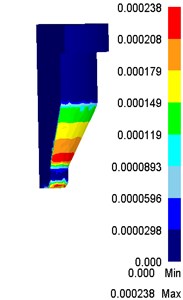
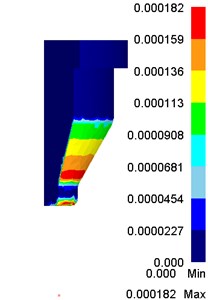
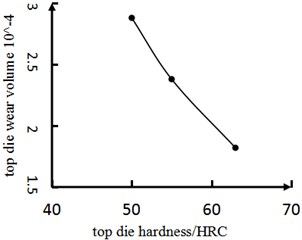
According to Fig. 9 different top die initial hardness of the top die pattern of the impact of wear patterns can be seen, from the lower end of the top die to the second fierce round corner position for the location of the amount of top die wear. Due to the friction between the top die and the billet and the flow rate as well as the hardness of the material and other factors, the deformation at the fillet location and the metal flow transition region are the most intense, and the wear volume decreases in turn from top to bottom. When the punch hardness is 50 HRC, the maximum wear of the top die is 2.88×10⁻⁴mm. When the top die hardness is 63 HRC, the maximum wear of the top die is 1.82×10⁻⁴mm. From Fig. 9(d) shows that within a certain range of the maximum amount of wear top die and top die inversely proportional to the hardness.
Fig. 8Shows the distribution of the influence of different friction factors on the forming load
a) 0.08
b) 0.12
c) 0.15
d) The relationship between friction factor and forming load
Fig. 9Different punch initial hardness of the punch pattern of the impact of wear patterns can be seen
a) 50 HRC
b) 55 HRC
c) 63 HRC
d) Relationship between top die hardness and top die wear volume
6. Conclusions
1) Simulation of the forming effect of two forming process schemes by DEFORM-3D simulation software, the second one: Car cutting material → Softening heat treatment → Surface treatment → Phosphating + Saponification and lubrication → Compression (small end extrusion Height of 26 mm) → Lubrication → Composite extrusion (internal extrusion hole depth of 7 mm) → Lubrication → Reverse extrusion for the optimal program, the program feasible.
2) To explore the influence of different factors of composite extrusion options on the forming load and the wear amount of the die in the second scheme, and the forming law is good, which can provide the reference value for the production and processing of the Front tube parts.
References
-
Wang Peian, Wu Shufang, Zhu Lili, et al. Study on cold extrusion process of ball studs based on deform-3D. Engineering Technology, Vol. 34, Issue 3, 2017, p. 296-297.
-
Nie Xiaodan, Bai Ling Failure, rework and modification of cross wedge rolling die. Modern Economic Information, Vol. 8, 2008, p. 251-252.
-
Shao Ran, Xu Kan Study on blade forging die design based on deform-3D. Hot Working Technology, Vol. 43, Issue 5, 2014, p. 148-150.
-
Zhang Shuizhong Extrusion Process and Mold Design. Chemical Industry Press, Beijing, 2009.
-
Song Yanping, Yang Shibin Research of technological properties on cold extrusion technique for spur cylinder gear. New Technology and New Process, Vol. 10, 2009, p. 80-82.
-
Wang Hong Ge, Zhou Qian Structure optimization and technology research on cold extruding die of spur gears. Coal Mine Machinery, Vol. 4, 2008, p. 90-91.
-
Zou Qiong Qiong, Huang Ji Long, Gong Hong Ying, et al. Optimization of cold extrusion for automobile spline shaft parts based on deform-3D. Journal of Plastic Engineering, Vol. 23, Issue 5, 2016, p. 8-13.
-
Wang Peian, Wu Shufang, Miao Runzhong, et al. Study on temperature extrusion process and die wear analysis based on numerical simulation cup sleeve. Die Mould Manufacture, Vol. 10, 2017, p. 66-75.
-
Wu Shufang, Wang Peian, Guo Huanhuan, et al. Bobbin cold extrusion forming process and mold optimum design based on orthogonal test. Journal of Xihua University, Vol. 37, Issue 1, 2018, p. 92-101.
-
Gui Changlin The are hard design calculation model and its application methods. Lubrication Engineering, Vol. 1, 1990, p. 12-21.
-
Hu Jianjun, Li Xiaoping Deform-3D Plastic Forming CAE Application Tutorial. Peking University Press, Beijing, 2011.
-
Zou Lin, Xia Ju Kan, Hu Guo An application of parallel genetic algorithm in mold cavity shape optimization design. China Mechanical Engineering, Vol. 14, Issue 24, 2003, p. 2077-2080.
