Abstract
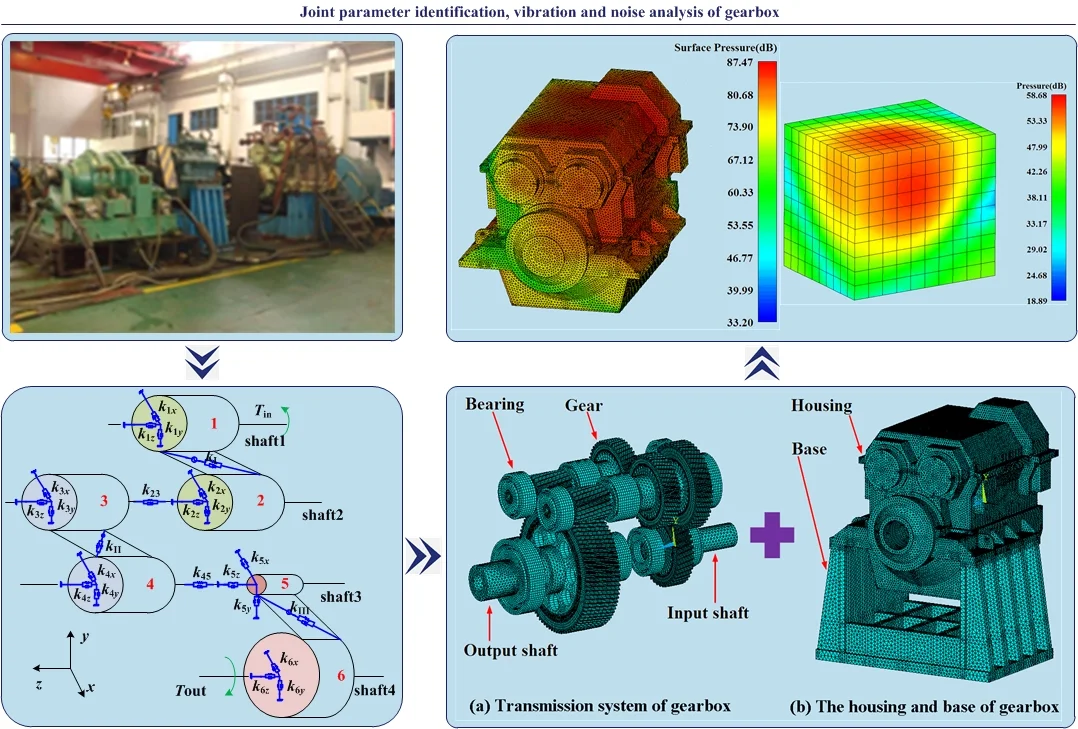
A certain type of gearbox is investigated for the problem that the stiffness and damping of bearings are difficult to be accurately determined and then affect the analysis of vibration and noise of gearbox. Firstly, a coupled dynamic lumped parameter model of three-stage helical gear system with consideration of bearing stiffness, bearing damping, and transmission error is established. The modal parameters of gear system are obtained by using the experimental modal analysis method with single-input and multiple-output. The equation for joint parameter identification of gearbox is established which is based on the experimental modal analysis theory and the dynamic lumped parameter model, and subsequently the parameters of the joint are obtained by the least square method. Then, a gear-shaft-bearing- housing coupled dynamic finite element model is developed on the basis of the identified parameters, and after that the dynamic response results of gearbox are solved by using the modal superposition method and compared with the vibration test results. Finally, an acoustic boundary element model of gearbox is established by taking the dynamic response results as the acoustic boundary condition, and the surface sound pressure and radiation noise of gearbox are solved by the boundary element method (BEM), and then the results are compared with the noise test. The results show that the simulation laws and test laws are in good agreement, and thus the method of joint parameter identification, vibration and noise analysis of gearbox is feasible.
Highlights
- The stiffness and damping of gearbox bearings are identified by experimental modal analysis.
- A gear-shaft-bearing-housing coupled model is developed to analysis housing vibration.
- A boundary element model is established to predict surface and radiation pressure of gearbox.
- The vibration and noise simulated with identification parameters are close to test results.
1. Introduction
The dynamic performance of gearbox is an important index to evaluate the characteristics of running gearbox. The structure of gearbox is complex and therefore the joint parameters of gearbox are the key factors that affect the dynamic performance. At present, the joint parameters of gearbox are obtained through empirical values or the numerical and simulation analysis methods due to the installation characteristics of bearings. However, the parameters obtained in this way are difficult to reflect the actual situation and thus affect the results accuracy of vibration and noise for gearbox. Therefore, it is necessary to study the joint parameter identification, vibration and noise analysis of gearbox.
Experimental modal analysis is the basis of parameter identification, many scholars have carried out a great deal of modal analysis for structural system [1-3]. At present, many researchers have carried out a lot of researches on parameter identification of mechanical structure systems about machine tool, bolt and bearing. Cai [4] proposed an identification method for machine-tool dynamics under machining based on the active excitation modal analysis and verified the feasibility of the method by test. Iranzad [5] established a nonlinear bolted lap joint model and identified the nonlinear dynamic behavior of the model at different load levels. Sun [6] established the transfer function matrix model of the active magnetic bearings system and proposed a method to estimates the unknown parameters. In recent years, many scholars developed the researches on modal analysis of gear system by finite element method and analytic method. The parameter identification researches of gear system mainly focus on the extraction of vibration signal, the identification of meshing frequency and the fault diagnosis [7, 8], etc.
The vibration of gearbox is a difficult and hot spot in the research field of mechanical system dynamic, and many scholars have carried out a lot of related researches. The influence of time-varying meshing stiffness, comprehensive gear error, and piece-wise backlash on the vibration characteristics of gear system were investigated extensively [9-12]. Zhang [13] analyzed the dynamic characteristics of planetary gear transmission system by using the shafting element method and Runge-Kutta numerical method respectively. Most of the analysis objects are only confined to gear transmission system, without coupling analysis of the transmission and structure system of gearbox, which will be bound to affect the accuracy of dynamics analysis results of gearbox. The vibration will produce noise pollution and even result in the fatigue failure of the structure for gearbox. In recent years, many researchers have carried out the noise research of gearbox. Kadmiri [14] and Barthod [15] investigated the effects of unselected gear ratios, gearbox parameters and excitation parameters on the rattle noise of gear system. Abbes [16] established an acoustic-structural interaction model and used the Rayleigh integral method to evaluate the gearbox-radiated noise. Fietkau [17] revealed the influence of different parameters on lubrication conditions and structure-borne noise of gear transmissions.
In conclusion, many scholars have investigated researches in one or two aspects of parameter identification, vibration and noise in mechanical system and achieved many valuable results. However, the study on joint parameter identification for stiffness and damping, and simultaneously considering vibration analysis and noise prediction of gearbox is rarely reported. Therefore, the main research objective of this paper is to develop a method for joint parameter identification, vibration and noise analysis of gearbox. Firstly, the joint parameters are identified by using the experimental modal analysis method. Secondly, the coupled dynamics analysis of gearbox is developed by the modal superposition method. Then, the BEM is used to calculate the surface sound pressure and radiation noise. Finally, the simulation results are compared with the test results to verify the feasibility of the approach.
2. Joint parameter identification of gearbox
2.1. Experimental modal analysis theory
The experimental modal analysis theory is the basis of parameter identification. The modal parameters of gear system are obtained by establishing the correlation relationship of frequency response function (FRF) and modal parameters considering the relationship between input and output of the system, which is based on the frequency response function of the system. The gear system can be represented as a system with degrees of freedom (DOF) after the system is discretized [18], the dynamic equation can be expressed as:
where , and are the mass, damping and stiffness matrices of the gear system respectively; , , are time functions organized in column vectors that characterize the evolution of the acceleration, velocity and displacement, respectively; and is a column vector with the excitation force applied to the gear system. By taking the Fourier transform of Eq. (1), the frequency domain dynamic equation is expressed as:
where , is the dynamic stiffness matrix. When , the relation expression of input and output in the frequency domain of gear system can be obtained by the reciprocal relationship of and . is the FRF matrix and the expression of is:
The orthogonal mass matrix, stiffness matrix and damping matrix are obtained respectively based on the weighted orthogonal of the real symmetric matrices, then the can be expressed as:
where .
The frequency response function between the excitation point and the response point can be obtained through the following equation:
where ; are the order modal frequency, the order modal damping ratio and the order modal frequency ratio respectively; , , are the order modal mass, the order modal frequency and the order modal shape respectively.
The Eq. (5) shows that the frequency response of the DOF gear system is equal to the linear sum of the frequency response of the single DOF gear systems. Therefore, in order to determine all the modal parameters about , and of gear system, only one column or one row of the is needed to be measured.
2.2. Vibration differential equation of gearbox transmission system
The gearbox transmission system is composed of three stages of helical gear, shafts and bearings. The input speed of gearbox is 1300 r/min, and the input power is 400 kW. The gear parameters of transmission system are shown in Table 1, the rotating frequency and meshing frequency of gearbox are shown in Table 2. The schematic diagram of transmission system is shown in Fig. 1. The number 1-12 represent bearings separately, the number I-IV represent input shaft, ahead shaft, astern shaft and output shaft respectively, and the number V and VI represent the ahead clutch and astern clutch respectively in Fig. 1.
The helical gears are simulated by the lumped mass and moment of inertia, which are based on the lumped-mass method. The transmission shafts are simplified into the massless shafts, and the gear pairs and bearings are simulated with springs and dampers. A dynamic lumped parameter model for coupled bending-torsion-axis transmission system with consideration of the torsional vibration between the shaft 2 and the shaft 3 is established, as shown in Fig. 2. The equivalent mass, damping and stiffness in the model are determined by the structural size and material of gears, shafts and bearings.
Table 1Gear parameters of transmission system
Items | Input stage | Astern stage | Output stage |
Module (mm) | 14 | 12 | 12 |
Number of teeth | 42/48 | 48/48 | 21/86 |
Pressure angle (deg) | 20 | 20 | 20 |
Helix angle (deg) | 12 | 12 | 8 |
Tooth width (mm) | 146 | 140 | 320 |
Table 2The rotating frequency and meshing frequency
Items | Input shaft () | Middle shaft () | Output shaft () |
Rotating frequency (Hz) | 21.7 | 19.0 | 4.6 |
Items | Input stage () | Astern stage () | Output stage () |
Meshing frequency (Hz) | 910 | 910 | 398.1 |
Fig. 1Schematic diagram of transmission system
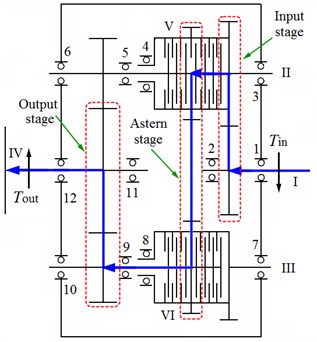
Fig. 2Dynamic lumped parameter model
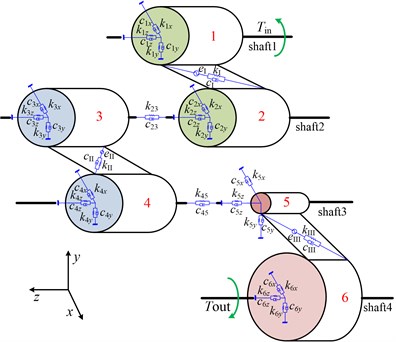
In Fig. 2, the shaft 1 is input shaft, the shaft 4 is output shaft, , , , , , ( 1-6) are stiffness and damping of bearings respectively, and are the input and output torque, -, - are the meshing stiffness and damping of gear pairs respectively. The vibration differential equation of transmission system with 24 degrees of freedom is established by using the lumped parameter method. The vibration differential equation of three-stage gear pairs can be expressed by the following equations.
(1) The first-stage gear pair:
(2) The second-stage gear pair:
(3) The third-stage gear pair:
where , , are the internal excitation of gear pairs, which can be expressed as:
where , , are the relative displacements on the meshing line of gear pairs, the formulation of relative displacements can be expressed as:
where , , , are the translational and rotational displacement of gears in the direction of , , and , is the radius of base circle ( 1-6), is the static transmission error, , and are the normal pressure angle, helix angles of pitch circle and base circle ( 1-3), respectively.
2.3. Solution of gearbox joint parameters
Eq. (6)-(8) can be written as the form of Eq. (1), and the dynamic stiffness matrix can be obtained according to the Eq. (2). The expression of can be written as:
where , and are the mass, stiffness and damping matrices respectively, is the displacement vector.
According to the reciprocal relationship of the and , the Eq. (12) can be obtained as:
From Eq. (4), the relationship of and can be formulated as:
where is the th column of , , is the th column of, , ( 1, 2, …,24).
Each column in the unit matrix is linearly independent, so the value of j can be arbitrarily taken from 1 to 24. In this paper, the value of is 6 and then making , . An equation set which contains 24 equations can be obtained through the expansion of Eq. (13) according to the multiplication rule of the matrix. Then the equation set can be written into a matrix form including 36 joint parameters which are needed to be identified. The expression can be written as:
where:
In this paper, the is obtained by using the experimental modal analysis method with single-input and multiple-output [1, 4]. Firstly, the powerful hammer of the type DFC-2 is used to generate impulse excitation signal. The signal is measured by the force sensors of the type YFF-6-025, then amplified through the signal amplifier of the type DLF-8, and finally collected by the intelligent signal collection analyzer of the type INV306U-5260, as shown in Fig. 3. Secondly, the output response signal is measured by the acceleration sensors of the type B&K4382, and is amplified through the charge amplifier of the type B&K2635, then collected by using the intelligent signal collection analyzer, as shown in Fig. 4. In order to ensure the accuracy of the test, the input excitation signal and the output response signal are repeatedly measured several times. Thirdly, the transfer function and coherence coefficient are obtained through analyzing and processing the tested data by the DASP software, as shown in Fig. 5, 6. From Fig. 6, the coherence coefficient values are nearly 1 in 0-2000 Hz, so the modal parameters obtained by experimental analysis will be highly reliable in the range, when compared to the frequency range of 2000-3000 Hz. Finally, the modal parameters are obtained by the complex modal GLOBAL method. The FRF curve with reference level of 1.0 m/s2/N in the range from 0 to 2000 Hz is obtained by the ensemble average approach, as shown in Fig. 7.
Fig. 3Input excitation signal
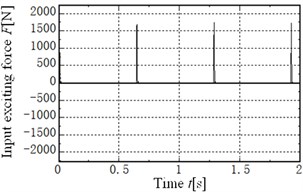
Fig. 4Output vibration response signal
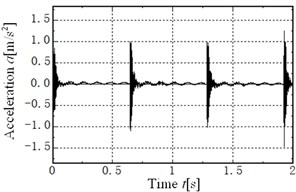
Fig. 5Transfer function
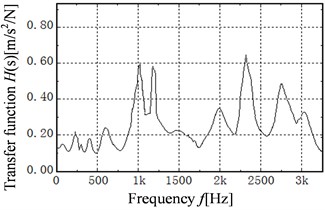
Fig. 6Coherence coefficient function
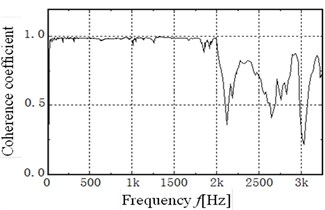
Fig. 7The FRF curve obtained by the ensemble average approach
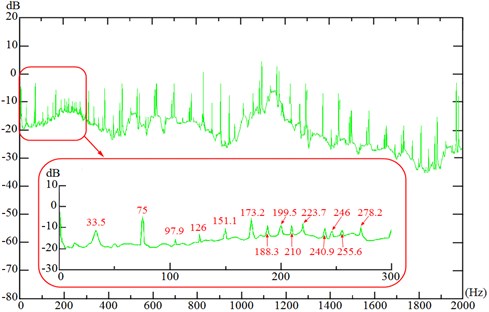
In order to make the identification results more accurate, the frequency response functions at different frequencies are considered. The 33.5, 151.1, 199.5 and the corresponding FRF are substituted into the Eq. (14), and the equation is solved by the least square method [1]. The stiffness and damping of bearings are achieved through the average value calculation to the identified stiffness and damping values which obtained at , and respectively, as shown in Table 3. As low order modal parameters in frequency range 0-2000 Hz are adopted, identified joint parameters are expectedly reasonable, and the identification effectiveness is further verified through taking joint parameters into gearbox dynamic model.
Table 3The stiffness and damping of bearings
Bearing | Stiffness (×108N/m) | Damping (×102N·s/m) | ||||
1 | 4.06 | 2.08 | 8.74 | 2.60 | 7.16 | 3.49 |
2 | 7.46 | 3.51 | 5.22 | 7.84 | 1.47 | 2.22 |
3 | 2.99 | 0.983 | 18.9 | 8.67 | 2.25 | 4.95 |
4 | 4.08 | 6.29 | 5.03 | 8.74 | 1.84 | 5.84 |
5 | 4.48 | 5.82 | 19.9 | 9.34 | 2.64 | 10.1 |
6 | 14.6 | 11.3 | 20.0 | 1.74 | 8.94 | 7.97 |
3. Dynamic response simulation and test analysis of gearbox
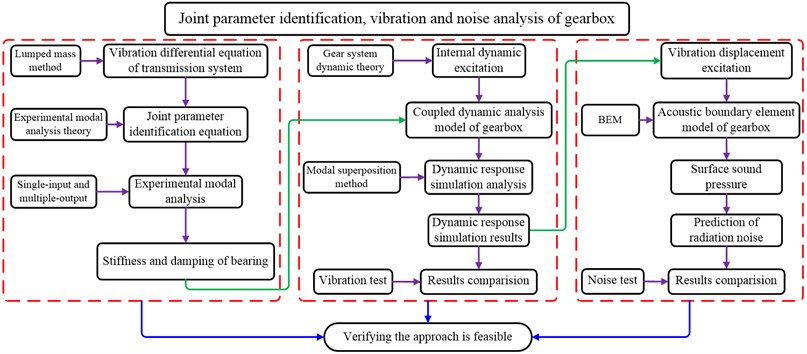
3.1. Flow chart of vibration and noise analysis
The dynamic finite element model of gearbox is developed according to the identified values of stiffness and damping from Table 3. The dynamic response results of the model are calculated and then compared with the results of vibration test. Subsequently, the acoustic boundary element model is established based on the dynamic response results. The acoustic results are solved and compared with the radiation noise test. The flow chart of vibration and noise analysis of gearbox is shown in Fig. 8.
Fig. 8Flow chart of vibration and noise analysis
3.2. A coupled dynamic finite element model of gearbox
The vibration displacement, velocity and acceleration of gearbox will be generated by the internal dynamic excitation under working condition. The internal dynamic excitation of gearbox is produced by the meshing process of gear pair, which is composed of the meshing stiffness, transmission error and meshing impact [19]. The expression is shown as:
where is the meshing stiffness, is the transmission error, is the meshing impact.
The meshing stiffness is achieved through the superposition of the single tooth stiffness according to the meshing period. The error excitation is a kind of displacement excitation which is related to the machining precision grade of gear [20]. The meshing impact can be obtained by the three-dimensional impact dynamic contact finite element method. The curves of internal dynamic excitation in time and frequency domain of gear pairs are shown in Fig. 9 and Fig. 10.
Fig. 9The time domain curve of internal dynamic excitation
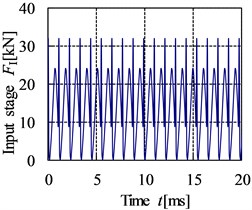
a) Input stage
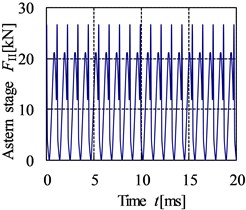
b) Astern stage
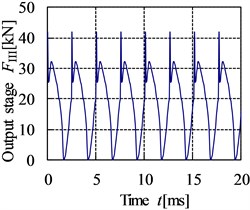
c) Output stage
The three-dimensional solid model of gearbox containing transmission system is built by UG software and then imported into ANSYS. The solid45 element is used to divide mesh of the model, the spring-damper is used to simulate the supporting relationship between the inner and outer rings of bearings, and the stiffness and damping in Table. 3 are added to corresponding spring-dampers. The obtained meshing stiffness of gear pairs are added to the corresponding springs respectively to simulate the meshing relationships between the gear pair. Then the bottom of housing base is fully constrained, and the calculated internal dynamic excitations are applied to the nodes on the meshing lines. Finally, the gear-shaft-bearing-housing coupled dynamic finite element model with a total of 832283 elements and 251509 nodes is developed eventually, as shown in Fig. 11.
Fig. 10The frequency domain curve of internal dynamic excitation
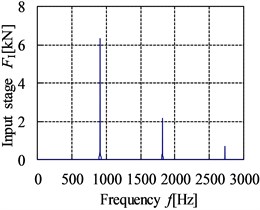
a) Input stage
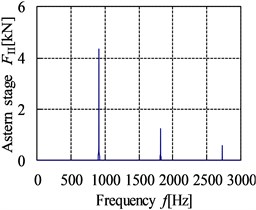
b) Astern stage
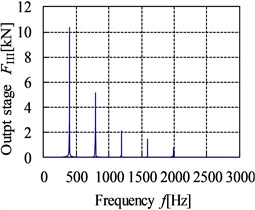
c) Output stage
Fig. 11The coupled dynamic finite element analysis model
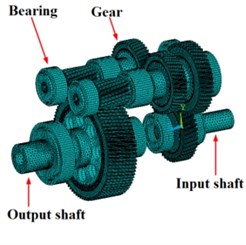
a) Transmission system of gearbox
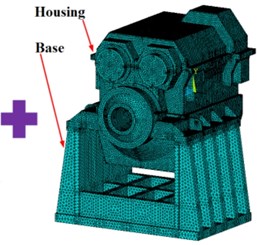
b) The hosing and base of gearbox
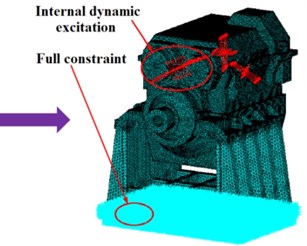
c) The dynamic excitation and full constraint
3.3. Dynamic response calculation and test analysis of gearbox
The Block Lanczos method is applied to analyze the vibration modes of gearbox, and then the dynamic response is calculated by the modal superposition method. The total response calculating time is chosen to be 200 ms with the time step of 0.01 ms. In order to verify the accuracy of the simulation results, the vibration and noise test platform of the gearbox is built, as shown in Fig. 12. The test conditions are consistent with the simulation. The evaluating points are distributed on the mounting base and the top of housing [21], as shown in Fig. 13. Vibration acceleration signals are measured by acceleration sensors and amplified by charge amplifier, then collected by signal acquisition instrument, and processed by the DASP software finally.
Fig. 12The vibration and noise test platform
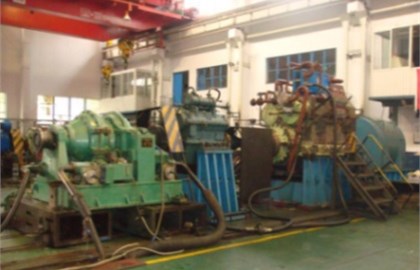
Fig. 13The evaluating points of gearbox
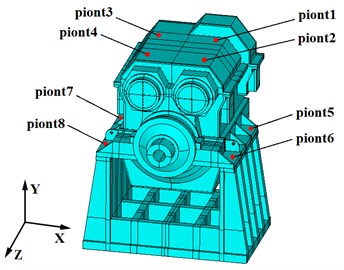
The RMS values of vibration acceleration (0-8 kHz) in the , , direction of the evaluating points are listed in Table 4. By comparison, the simulation values are basically in good agreement with the measured values, and the maximum relative error is 16.94 % at point3 in the direction. The maximum RMS value of vibration acceleration occurs at points 4 in the direction. The maximum simulation and measuring RMS values are 10.68 m/s2 and 11.89 m/s2, and the relative error is 10.18 %. From Fig. 9, the maximum value of internal dynamic excitation appeared at output stage, which would cause the most intense vibration. Point 4 is in the vicinity of housing bearing seat hole in the output stage, therefore the vibration at point 4 is the largest.
Table 4The simulation and measuring RMS values of vibration acceleration
Evaluating point | 1 | 2 | 3 | 4 | 5 | 6 | 7 | 8 | |
Simulation value (m/s2) | 5.74 | 5.32 | 4.85 | 4.83 | 4.11 | 5.87 | 4.37 | 4.06 | |
Measuring value (m/s2) | 5.11 | 4.94 | 4.39 | 5.25 | 4.59 | 5.48 | 4.13 | 3.57 | |
Relative error | 12.33 % | 7.69 % | 10.48 % | 8.00 % | 10.46 % | 7.12 % | 5.81 % | 13.73 % | |
Simulation value (m/s2) | 7.25 | 8.81 | 7.61 | 10.68 | 6.68 | 7.65 | 7.68 | 3.86 | |
Measuring value (m/s2) | 6.85 | 8.03 | 7.05 | 11.89 | 7.23 | 7.05 | 7.31 | 4.24 | |
Relative error | 5.84 % | 9.71 % | 7.94 % | 10.18 % | 7.61 % | 8.51 % | 5.06 % | 8.96 % | |
Simulation value (m/s2) | 4.68 | 4.81 | 4.28 | 6.97 | 6.52 | 6.31 | 3.39 | 4.75 | |
Measuring value (m/s2) | 4.23 | 5.13 | 3.66 | 7.43 | 6.91 | 5.43 | 3.75 | 5.12 | |
Relative error | 10.64 % | 6.24 % | 16.94 % | 6.19 % | 5.64 % | 16.21 % | 9.60 % | 7.23 % | |
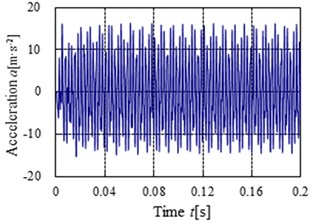
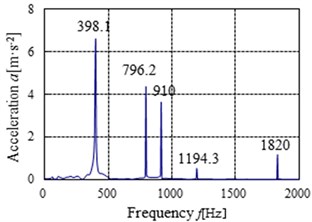
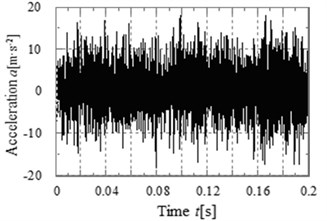
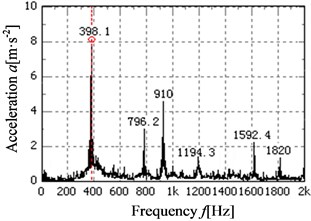
The acceleration simulation and test curves of point 4 and point 5 in the direction is shown in Fig. 14-17 respectively. The main peaks of the vibration acceleration frequencies for the simulation and test occur at 398.1, 796.2, 910, 1194.3, 1592.4 and 1820 Hz. Compared with the meshing frequencies and rotation frequencies in Table. 2, the frequencies mainly occur in the meshing frequency and octave frequencies of gearbox. From the figures, it can be known that the simulation laws are consistent with the test laws, the maximum peak of the frequency curve for the simulation and test all appeared in the output stage meshing frequency. The result shows that the meshing frequency has a great influence on the vibration of gear system.
Fig. 14The acceleration simulation curves of point 4 in the Y direction
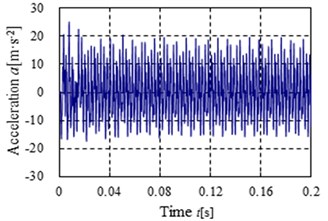
a) Time domain
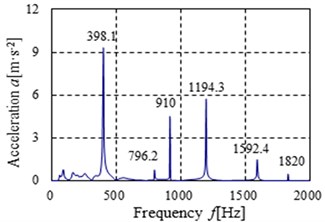
b) Frequency domain
Fig. 15The acceleration test curves of point 4 in the Y direction
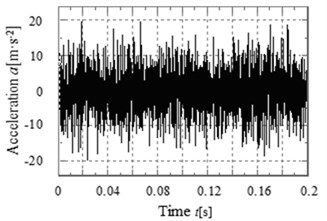
a) Time domain
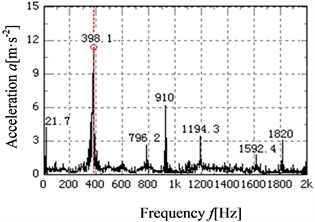
b) Frequency domain
Fig. 16The acceleration simulation curves of point 5 in the Y direction
a) Time domain
b) Frequency domain
Fig. 17The acceleration test curves of point 5 in the Y direction
a) Time domain
b) Frequency domain
4. Radiation noise prediction and test analysis of gearbox
4.1. Radiation noise analysis method
The radiation noise prediction approach of gearbox usually contains the simulation and test analysis method. The simulation analysis method mainly includes the BEM and finite element method, which mainly differs in the boundary conditions and mesh requirements [22].
The BEM is used to predict the radiation noise of gearbox in this paper. The Helmholtz wave equation and the boundary condition of the external sound field are the theoretical basis for solving the acoustic radiation problem. The expression can be written as:
where (, , ) is acoustic pressure at the arbitrary point on the external sound field structure surface , is wave number and /, is the speed of sound, is circular frequency and 2, is frequency, is the distance between the point and the acoustic source point.
The basic equation of radiation sound field is gained on the basis of BEM and it can be represented in the form of matrix:
where {} is sound pressures at the node on boundary element surface, {} is the normal vector of the node , is the medium density of sound fluid, , are the coefficient matrices.
Then the radiated sound pressure of the arbitrary point on external acoustic field can be achieved by integration:
where {}, {} are the coefficient matrix vectors.
4.2. Radiation noise calculation and test of gearbox
The nodes of the acoustic model are the same to the external surface nodes of housing for the dynamic finite element model, thus the vibration displacements of the external surface nodes are the acoustic boundary conditions. The acoustic boundary element analysis model with a total of 67254 elements and 33625 nodes is shown in Fig. 18. The computation time and simulation accuracy are needed to be taken into account at the same time, thus the calculated frequencies are set from 31.5 Hz to 4000 Hz according to octave frequency. The radiation noise test platform is shown in Fig. 12, and the 6 test field points are shown in Fig. 19. The distance between the test point and the external surface of gearbox is about 1 m. And the positions of test point are chosen based on the relative acceptance codes for gear units and the construction specifications of steel marine boat [23].
Fig. 18Boundary element analysis model
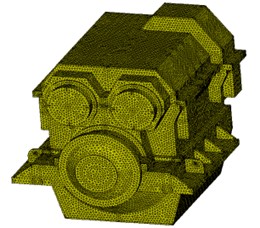
Fig. 19The test points of radiation noise
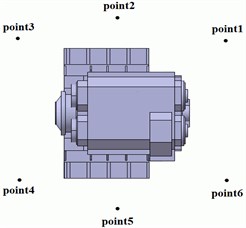
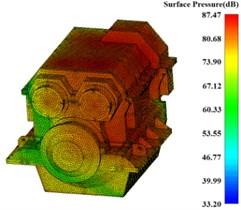
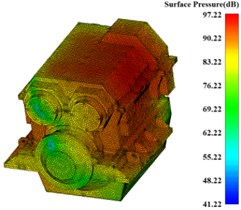
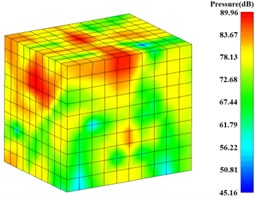
Fig. 20Surface sound pressure contour of gearbox
a) 63 Hz
b) 125 Hz
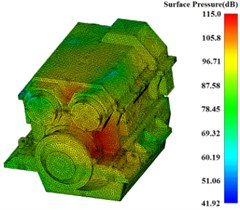
c) 250 Hz
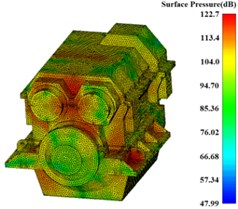
d) 500 Hz
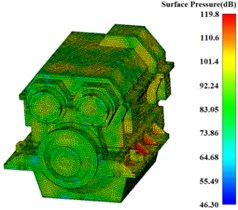
e) 1000 Hz
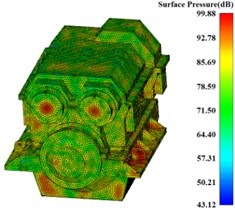
f) 2000 Hz
The BEM is used to solve the acoustic boundary element model, and the surface sound pressure values of gearbox at the eight calculated frequency bands are achieved. The surface sound pressure contours at the frequency from 63 Hz to 2000 Hz are shown in Fig. 20. The output stage meshing frequency (398.13 Hz) and the input stage meshing frequency (910 Hz) are near to the frequencies 500 Hz and1000 Hz respectively, so the surface sound pressure values at the 500 Hz and1000 Hz are larger than the other frequencies.
For predicting the radiation noise of gearbox, a rectangular radiation noise field point mesh model is built at the outside of gearbox, and the distance between each rectangular surface and the external surface of gearbox is about 1 m, as shown in Fig. 21. The radiation noise pressure values at the eight calculated frequencies based on the results of the surface sound pressure results are solved. The radiation noise pressure contours at the frequency from 63 Hz to 2000 Hz are shown in Fig. 22. The maximum value is 89.96 dB, which appeared at the 500 Hz.
Fig. 21Radiation noise field point analysis model of gearbox
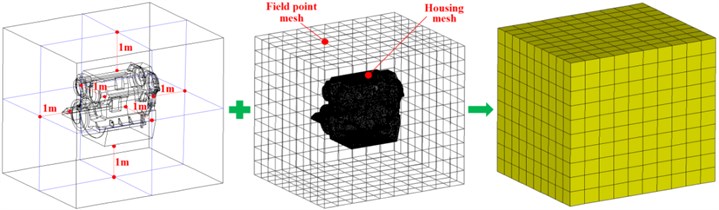
Fig. 22Radiation noise pressure contour of gearbox
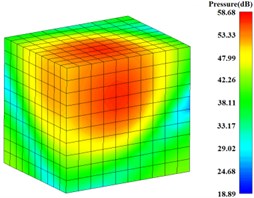
a) 63 Hz
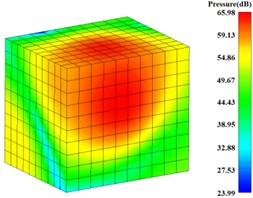
b) 125 Hz
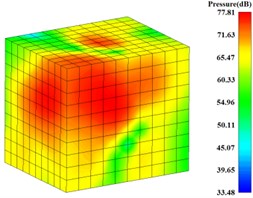
c) 250 Hz
d) 500 Hz
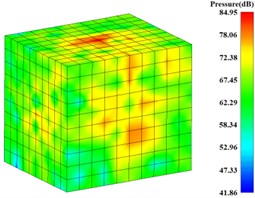
e) 1 kHz
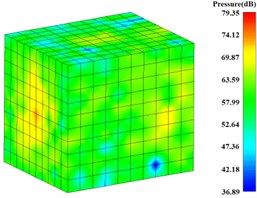
f) 2 kHz
4.3. Discussion of simulation and test results for radiation noise
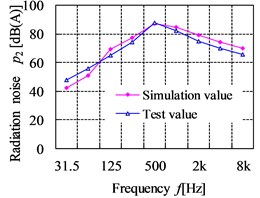
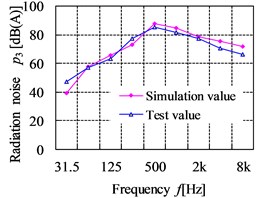
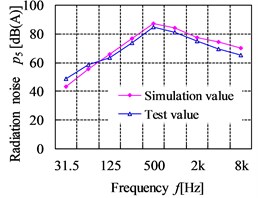
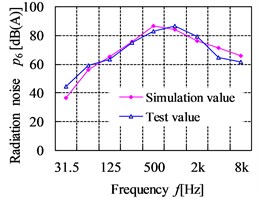
The comparison curves of the simulation values and test values for radiation noise are shown in Fig. 23. From the figures, the maximum simulation value and test value is 89.96 dB and 89.3 dB respectively, which all appear at the point 4 in the 500 Hz. The largest relative error of radiation noise between the test and simulation point is 17.38 % at the point 6 in 31.5 Hz, which is within the allowable error range. Comparing the simulation and test results, it can be known that the law between the simulation and test curve for radiation noise at the filed point is basically similar, which shows that the acoustic boundary element analysis model is accurate. However, the simulated radiation noise pressure level is slightly lower than the test results in the frequency range below 63 Hz. The reason is likely to be that the background noise of engine and other running equipment nearby to gearbox are dominant at the lower frequencies, which make influence in the test results. In the higher frequencies, the simulation results tend to be over to the test results. This is due to the higher errors is generated when predicting radiation noise at the high frequency owing to the inherent limitations in BEM.
Fig. 23The comparison curves of simulation results and test results for radiation noise
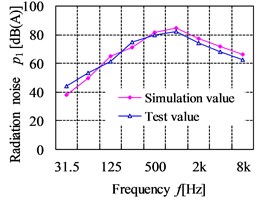
a) Point 1
b) Point 2
c) Point 3

d) Point 4
e) Point 5
f) Point 6
5. Conclusions
1) The modal parameters of gear system are obtained by using the experimental modal analysis method with single-input and multiple-output. The joint parameter identification equation of gearbox is set up and solved by the least square method.
2) A gear-shaft-bearing-housing coupled dynamic finite element model is developed on the basis of the identified parameters and solved by using the modal superposition method. The dynamic response results and the vibration test results are in good agreement.
3) An acoustic boundary element model of gearbox is established by taking the dynamic response results as acoustic boundary condition and calculated by the boundary element method. The simulation values of radiation noise essentially agree with the test values.
4) The comparison analysis of results show that the simulation laws are consistent with the test laws, the identified joint parameters are precise, and the vibration and noise analysis models built based on the joint parameters are accurate. Therefore, the approach of joint parameter identification, vibration and noise analysis of gearbox is feasible.
References
-
Hermans L., Auweraer H. V. D. Modal testing and analysis of structures under operational conditions: industrial applications. Mechanical Systems and Signal Processing, Vol. 13, Issue 2, 1999, p. 193-216.
-
Modak S. V., Rawal C., Kundra T. K. Harmonics elimination algorithm for operational modal analysis using random decrement technique. Mechanical Systems and Signal Processing, Vol. 24, Issue 4, 2010, p. 922-944.
-
Quinn D. D. Modal analysis of jointed structures. Journal of Sound and Vibration, Vol. 331, Issue 1, 2012, p. 81-93.
-
Cai H., Luo B., Mao X., et al. A Method for Identification of machine-tool dynamics under machining. Procedia CIRP, Vol. 31, 2015, p. 502-507.
-
Iranzad M., Ahmadian H. Identification of nonlinear bolted lap joint models. Computers and Structures, Vols. 96-97, Issues 4, 2012, p. 1-8.
-
Sun Z., He Y., Zhao J., et al. Identification of active magnetic bearing system with a flexible rotor. Mechanical Systems and Signal Processing, Vol. 49, Issues 1-2, 2014, p. 302-316.
-
Sawalhi N., Randall R. B. Gear parameter identification in a wind turbine gearbox using vibration signals. Mechanical Systems and Signal Processing, Vol. 42, Issues 1-2, 2014, p. 368-376.
-
D'Elia G., Mucchi E., Cocconcelli M. On the identification of the angular position of gears for the diagnostics of planetary gearboxes. Mechanical Systems and Signal Processing, Vol. 83, 2016, p. 305-320.
-
Cooley C. G., Liu C., Dai X., et al. Gear tooth mesh stiffness: A comparison of calculation approaches. Mechanism and Machine Theory, Vol. 105, 2016, p. 540-553.
-
Lin T., He Z. Analytical method for coupled transmission error of helical gear system with machining errors, assembly errors and tooth modifications. Mechanical Systems and Signal Processing, Vol. 91, 2017, p. 167-182.
-
Byrtus M., Zeman V. On modeling and vibration of gear drives influenced by nonlinear couplings. Mechanism and Machine Theory, Vol. 46, Issue 3, 2011, p. 375-397.
-
Xiang L., Gao N., Hu A. Dynamic analysis of a planetary gear system with multiple nonlinear parameters. Journal of Computational and Applied Mathematics, Vol. 327, 2018, p. 325-340.
-
Zhang A., Wei J., Qin D., et al. Coupled dynamic characteristics of wind turbine gearbox driven by ring gear considering gravity. Journal of Dynamic Systems, Measurement, and Control, Vol. 140, Issue 9, 2018, p. 091009.
-
Kadmiri Y., Rigaud E., Perret-Liaudet J., et al. Experimental and numerical analysis of automotive gearbox rattle noise. Journal of Sound and Vibration, Vol. 331, Issue 13, 2012, p. 3144-3157.
-
Barthod M., Hayne B., Tébec J. L., et al. Experimental study of dynamic and noise produced by a gearing excited by a multi-harmonic excitation. Applied Acoustics, Vol. 68, Issue 9, 2007, p. 982-1002.
-
Abbes M. S., Bouaziz S., Chaari F., et al. An acoustic-structural interaction modelling for the evaluation of a gearbox-radiated noise. International Journal of Mechanical Sciences, Vol. 50, Issue 3, 2008, p. 569-577.
-
Fietkau P., Bertsche B. Influence of tribological and geometrical parameters on lubrication conditions and noise of gear transmissions. Mechanism and Machine Theory, Vol. 69, Issue 8, 2013, p. 303-320.
-
Mottershead J. E., Stanway R. Identification of structural vibration parameters by using a frequency domain filter. Journal of Sound and Vibration, Vol. 109, Issue 3, 1986, p. 495-506.
-
Li R., Wang J. Gear System Dynamics: Vibration, Shock, Noise. Science Press, Beijing, 1997.
-
Zhu C., Lu B., Song C., et al. Dynamic analysis of a heavy-duty marine gearbox with gear mesh coupling. Proceedings of the Institution of Mechanical Engineers, Part C: Journal of Mechanical Engineering Science, Vol. 223, Issue 1, 2009, p. 2531-2547.
-
Wei J., Zhang A., Wang G., et al. A study of nonlinear excitation modeling of helical gears with modification: theoretical analysis and experiments. Mechanism and Machine Theory, Vol. 128, 2018, p. 314-335.
-
Li Z., Zhan F. Senior Application Examples of Acoustic Simulation Based on Virtual.Lab Acoustics. National Defense Industry Press, Beijing, 2010.
-
He Z., Lin T., Luo T. Airborne noise optimization design of gear system. Noise Control Engineering Journal, Vol. 64, Issue 2, 2016, p. 115-125.
Cited by
About this article

The authors are grateful for the financial support provided by the National Natural Science Foundation of China under Contract No. 51875057 and National Science and Technology Support Project under Contract No. 2015BAF06B02. The CN Gpower Gearbox Co., Ltd. of China is thanked for providing the test site of the gearbox.
Tengjiao Lin is mainly responsible for the guide to the full text content writing and the revision of the manuscript. Daokun Xie is responsible for the parameter identification, vibration and radiation noise analysis of gearbox. Quancheng Peng is responsible for the language of the manuscript and the modeling of gearbox. Songling Guo is mainly responsible for the internal dynamic excitation calculation. Hesheng Lv is responsible for the vibration and noise test of gearbox.
