Abstract
As complex axial flow machinery, lots of vortex distributes around engine cooling fan. Negative circumferential vorticity (CV) leads to low efficiency and power loss. In order to investigate the adverse effects of CV on aerodynamic performances of the fan, a mathematical physical relationship between CV and aerodynamic performances is established, and the location of the negative CV is found by the method of vorticity analysis. An outer ring is designed for annular cooling fan, and the parameter of aperture rate is defined in this paper. Both static pressure and power loss is overall considerate during the optimization process of the outer ring, and putting forward that optimum range of the aperture rate is different for various annular fans.
1. Introduction
Axial cooling fan is an important component of engine cooling system. According to the structure of the fan, it includes annual axial cooling fan and common one. According to Ref. [1]: for the general axial fan, the main source of secondary stream loss comes from the tip leakage vortex. The structures of shoulder and alulae added to fan blades could restrain the vortex obviously caused by secondary stream and reflux. The outer ring of annual axial fan evolutes from the structure mentioned above. It is designed on the tip of fan blade and connects all blades. The structure can decrease the reflux loss of the whole flow field where fan locates effectively. Therefore, annual axial cooling fan has characteristics of high static pressure and static pressure efficiency, which is widely used in cooling system of commercial vehicle.
Refs. [2-4] tended to performed the structure optimization of fan by traditional method of Computer Dynamic Fluid (CFD), the calculation model of fan-flow-field was built and then the distribution of pressure and vortex were further analyzed, and finally the optimization design of structure was performed by their engineering experience. The optimization procedure mentioned above is blind for uncertain of the really source of decreasing of flow-field quality. Refs. [5, 6] pointed that vortex is the truly source of both pressure lift and resistance, the resistance one does negative work in the flow-field, and the objective of vorticity analysis (VA) is to find the location of negative vortex distributes on blade surfaces and to carry out local optimization. The VA method is more efficient than the traditional one.
In Ref. [7], the VA method was used in the internal flow compressor instead of the external one, and found that the circumferential vorticity (CV, a kind of vortex vector) is a primary vector parameter which affected the efficiency of axial flow compressor. The author did VA on compressor blade surfaces, and pointed out locations where negative CV distributed, optimized the blade structure purposefully, and finally improved the efficiency of the compressor. Up to now, the VA analysis method is widely used in high Mach number (> 0.7) axial machines structure optimization, such as high-pressure gas compressors and turbines. And it is rarely used in low Mach number (< 0.3) kinds, such as axial cooling fans.
This paper uses the VA method for engine axial cooling fan (ma < 0.3) structure optimization. After simulation (calculated by fluent), the calculate data is post-processed according to the mathematical physical relationship between CV and aerodynamic performances and gets the distribution of CV on fan blade surfaces.
2. Relationship between aerodynamic performances and CV
For the no-slip boundary theory, air locates in the near-wall region of blade surface rotates at a high speed. Lots of vortex forms during the process, which are different in size and directions. The vortex leads to a complex flow-field which is shown in Fig. 1, and some uncertain vortex decreases the flux ability of the whole flow-field. It would inevitably consume energy and lead to non-uniform inflow, reducing the efficiency of the fan. The formation and rupture of the reflux vortex is accompanied by changes in the corresponding pressure and velocity field, resulting in flow and pressure pulsation, which induces vibration and noise. At the same time, the reflux will also damage the fan, resulting in mechanical vibration, reducing the operation reliability of the fan and shortening the service life of the fan. Former researcher had pointed out that the aerodynamic performances would be improved if the CV could be cut off or guided by structure optimization. Therefore, it is the key to establish mathematic physical relation between the aerodynamic performances and CV for vorticity analysis.
Fig. 1Diagram of streamline around cooling fan
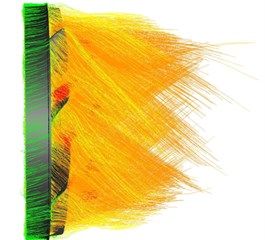
Fig. 2Diagram of control volume
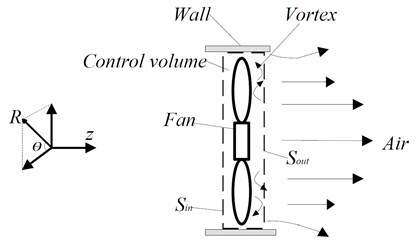
As shown in Fig. 2, a control volume (surrounded by and 2 walls) is defined around the axial fan, the mainstream direction is following the axis. Choosing a surface named arbitrarily in the domain of the control volume which is parallel to the blade surface. According to Ref. [7], if air is incompressible ( 0.3), the power of impeller which acts on air can be expressed as:
where is the impeller moment of fan, is the rotate speed, is the total pressure locates at surface , and is the flow speed. , and are the same parameters at relative external environment, which is constant. Following with the surface moving along the downstream direction, the Eq. (1) indicates a process of gradually increasing of pressure contributed by the fan. The last term of the Eq. (1) is constant, and the integral item can be expressed as:
According to Refs [7], the CV () can be expressed as:
By Eq. (2) and Eq. (3):
According to Refs [7], the IF of the right-hand former tow items is too low to be ignored. The work efficiency of the total pressure is determined by the value of CV. And the tow is positive related. The CV is a vector, negative CV decreases the flowing capacity of the whole flow-field. The CV comes from vortex, and it cannot be removed thoroughly, but can be cut off or restrained by structure optimization.
3. Simulation model and test
3.1. Simulation model
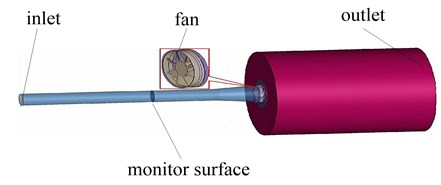
The CV analysis method is processed by commercial software Fluent. A pipeline simulation model is established (as shown in Fig. 3) based on the national standard of ventilator test. The model includes the flow-rate-inlet and freedom-space-outlet. There is a monitor section before a rotational region, which can obtain target value of static pressure directly. The axial cooling fan locates in the rotational region, and the rotate speed of the fan can be set according to simulation needs. The torque value can be caught by reading result data of the fan-wall-boundary.
Fig. 3Simulation model of aerodynamic performances of cooling fan
3.2. Simulation model
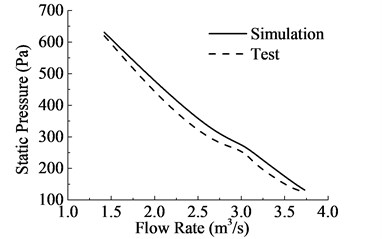
The test bench is shown in Fig. 4. After calculating, the static pressure of axial cooling fan decreases with the increasing of flow rate, which is shown in Fig. 5. The simulation value of static pressure shows a good agreement with the tested one, the error is within 10 %. The former is higher than the latter for the idealized simulation environment of fluent. The model of fan-flow-pipe can be used to predict the tendency of the aerodynamic performances of cooling fan.
Fig. 4Test bench of cooling fan
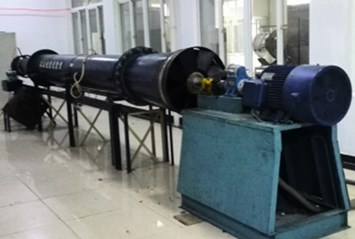
Fig. 5Comparisons of the value of simulation and test
4. Optimization of axial annular cooling fan
4.1. Aperture rate of annular cooling fan
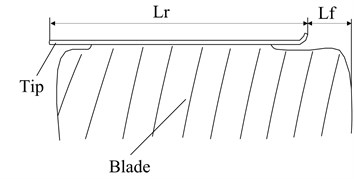
As an important structure parameter of annular cooling fan, aperture rate should be defined in this paper. As shown in Fig. 6, represents the axial-projection width of outer ring, and represents the width of blade tip without outer ring along the same direction. And the aperture rate can be expressed as:
The numerical range of is 0 %-100 %, which means from whole annular to no-annular.
Fig. 6Diagram of aperture rate of annular cooling fan
4.2. CV analysis for different aperture rates annular fan
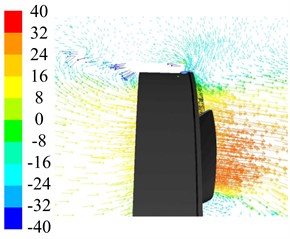
First of all, the distribution of the CV on fan blade should be caught by data post-proceeding after simulation. As shown in Fig. 7, positive and negative CVs are both distributed on the fan blade. There are obvious negative CV distribution concentrates on the fan tip and it along the direction from the leading edge to trailing edge, although they are not belonging to the same aperture rate annular fan. To explain the phenomenon mentioned above, further observation of specific velocity vector around fan is carried out as shown in Fig. 8. For annular fan with low aperture rate, there is a smaller area of the negative CV than that with a higher aperture rate.
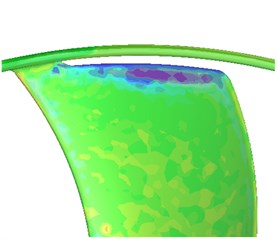
Fig. 7Contours of the CV distribution on fan blades
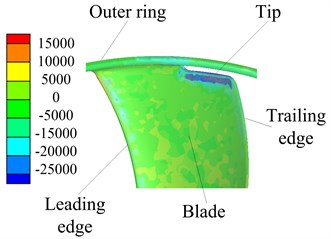
a)0.375
b)0.75
As shown in Fig. 8, the aperture rates are corresponding to Fig. 7. On the macro perspective, there is an obvious reflux around the outer ring which could be viewed through Fig. 1 too. But the center of the reflux is more closed to the outer ring when becomes larger, which would increases the probability of unsteady flux according to the no-wall-slip theory. Static pressure, which is the relative static pressure caused by the work of the fan, is the primary evaluation index for aerodynamic performances of cooling fan. And the power loss is the second index of aerodynamic performances for cooling fan. As shown in Fig. 9, the flow rate increases both static pressure and power loss decrease, and it consistent with the actual working conditions. What’s more, it is the same variation tendency as . It indicates that lower aperture rate can improve static pressure, but increase power loss either; hence, the parameter of aperture rate should be designed reasonable.
Fig. 8Contours of air velocity in a some meridian plane
a)0.375
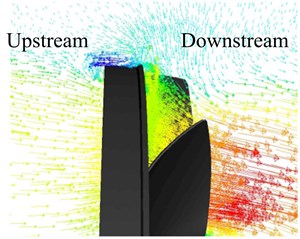
b)0.75
Fig. 9Comparisons of aerodynamic performances of 2 different aperture rates annular fan
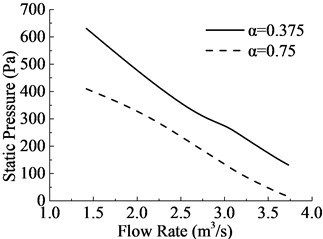
a) Static pressure
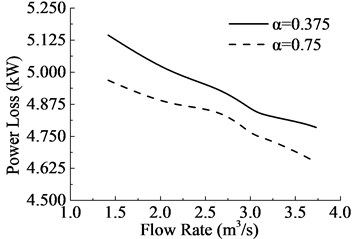
b) Power loss
4.3. Exploring for different aperture rates
According to the above comprehensive description, some random aperture rates are selected as given in Table 1.
The 1# fan, which has the aperture rate of 0, is a whole annular fan. And the 8# fan is a common fan without outer ring.
According to Fig. 10, the static pressure and power loss is that decreases with aperture rate increasing, except for a particular case when 0.75, The main reason is the complicated feature of pipeline flow-field. After careful analysis, the optimum range of aperture rate is 0.125-0.25.
Fig. 10Comparisons of aerodynamic performances of 8 different aperture rates annular cooling fan
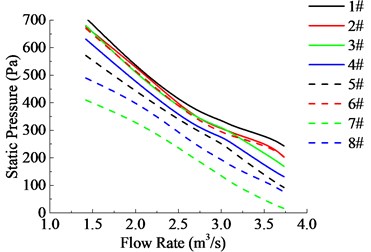
a) Static pressure
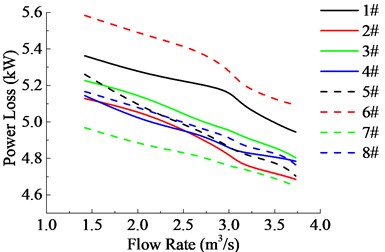
b) Power loss
Table 1Serial number of cooling fan with different aperture rates
Fan number | Aperture rate | Fan number | Aperture rate |
1# | 0 | 5# | 0.5 |
2# | 0.125 | 6# | 0.625 |
3# | 0.25 | 7# | 0.75 |
4# | 0.375 | 8# | 1.0 |
5. Conclusions
1) The distribution of circumferential vorticity on the blade surface has a directly effect on the aerodynamic performances of cooling fan.
2) By the method of the CV analysis, adding an outer ring to cooling fan could control the distribution of negative CV and improve the aerodynamic performances of the annular fan.
3) During the optimization design process of annular fan, all aerodynamic performances evaluation indexes should be considered. The optimum range of aperture rate is not unique for different annular fan, but the CV analysis method is universal.
References
-
Shigemitsu T., Fukuda H., Hirosawa K. Unsteady flow condition between front and rear rotor of contra-rotating sized axial fan. Open Journal of Fluid Dynamics, Vol. 20, Issue 6, 2017, p. 371-385.
-
Nashimoto A., Akuto T., Nagase Y., et al. Aerodynamic noise reduction by use of a cooling fan with winglets. SAE Technical Paper 2003-01-0531, 2003, https://doi.org/10.4271/2003-01-0531.
-
Nashimoto A., Fujisawa N., Akuto T., et al. Measurements of aerodynamic noise and wake flow field in a cooling fan with winglets. Journal of Visualization, Vol. 7, Issue 1, 2004, p. 85-92.
-
Hidetake O., Katayama Y., Osawa Y. Development of high efficient radiator cooling fan for automotive application. SAE Technical Paper 2013-01-1293, 2013, https://doi.org/10.4271/2013-01-1293.
-
Wu J. Z., Wu J. M. Vorticity dynamics on boundaries. Advances in Applied Mechanics, Vol. 32, 1996, p. 119-275.
-
Wu J. Z., Ma H. Y., Zhou M. D. Vorticity and Vortex Dynamics. 1st Edition, Springer-Verlag, Berlin, 2006.
-
Guo M., Li Q. S. A diagnostic and design approach of axial compressor based on local dynamics. ASME Turbo Expo: Power for Land, Sea, and Air, 2006.
About this article

We acknowledge support from Natural Science Foundation of China (Project No. 51475171).
