Abstract
Heavy tractors always work in full load, shock loading and vibration environment. The working environment is harsh, besides the vibration of the cab can easily cause driver fatigue and affect the driving comfort and safety. In this paper, taking a type of lifting tractor as a research object, the vehicle simulation model and the road model was established by ADAMS/VIEW software to simulate the vehicle's ride comfort, the weighted RMS acceleration of the cab floor in random input and the maximum vertical acceleration of the cab seat in pulse input was calculated. The calculation results and the ride comfort evaluation standard were compared and analyzed, which laid the theoretical foundation for the design and optimization of tractor’s cab.
1. Introduction
When running on the road, the vehicle may vibrate due to the unevenness of itself and the road, which would make the driver and passengers feel uncomfortable and tired, or damage the goods in the vehicle? Heavy-duty tractors often work in harsh environments which like rough road, bearing full load, impulse load or vibration for a long period. Therefore, there are resulting in frequently steering and braking operations. The drivers of semi-trailer tractor who often work for long-distance transportation are exposed to mechanical whole body vibration (WBV) during long-term non-stop driving [1]. That makes the drivers vulnerable to fatigue and damages their health. In order to realize high-quality transport of heavy-duty tractors, it's necessary to ensure the good ride comfort and handling stability.
The researches on ride comfort of vehicles in China are mostly based on ISO2631-1:1997(E) “MECHANICAL VIBRATION AND SHOCK-Evaluation of Human Exposure to Whole-body Vibration; Part 1: General Requirements” and GB/T4970-2009 “Method of Running Test – Automotive Ride Comfort”. For example, in the studies of cab seat vibration, the , and directions of the acceleration seats on the seats supporting surface were collected. Two sets of road setting – random and pulsing, were adopted to represent random condition and typical condition for automotive ride comfort test [2-4]. The weighted RMS acceleration was used as evaluation index to study the vibration characteristics of the cab. In this paper, it mainly studied the influence of pneumatic suspension of aft shaft and suspension system of the cab on the tractors seats vibration. The strength of seat vibration was studied and analyzed by the simplified weighted RMS acceleration of the seat vibration in the cab.
2. Establishment of simulation model
2.1. Human body comfort evaluation
The calculation method of human comfort evaluation also depends on the peak coefficient, which was defined as the ratio of the peak value of the weighted acceleration to the square root value. Iso2631-1:1997 (E) standard provided that if the weighted peak coefficient < 9, the square root value of weighted acceleration can be used directly to evaluate the effect of vibration on human comfort and health.
The square root value obtained by the time domain integral method is:
The square root of the acceleration square root is:
Based on the calculated values of each axial acceleration square root and weighted sum of the weighted coefficients of each axial vibration component, the total weighted acceleration square root value is obtained:
2.2. Vehicle model
Since the semi-active air suspension with variable stiffness of air spring was widely used in the high-end passenger cars, the heavy commercial vehicles and the luxury cars, its research has become the new hot spot in the field of dynamics and control [5, 6]. For example, a 6×2 tractor which structure included a front axle and two rear axles with pneumatic suspension that can be raised. A mathematical model of the air suspension was established as follows:
where – elastic force, – the atmospheric pressure, Pa, – absolute pressure of gas in the airbag, Pa, – effective area of air spring, m2, – relative pressure gas inside the airbag, Pa.
Other unrelated mechanisms, such as the engine which were ignored. We built a car model [7, 8]. Then, we got the data needed for modeling by introducing model of real vehicle into ADAMS. In ADAMS, models of the cab suspension system, the front axle steering suspension system and the rear axle pneumatic spring suspension system were created. Then the models of each sub-systems were assembled into a tractor simulation and analysis model [9, 10].
3. Calculation of working condition
With the analysis platform of vehicle system performance in ADAMS, the established model of tractor was stimulated and analyzed regarding ride comfort. The requirements stipulated in GB/T4970-2009 were followed in experiments and stimulation. The vehicle ran with full load and the operating conditions are as follows:
(1) Random road setting.
During the running process, the road condition changes constantly and randomly. Therefore, it's must to carry out ride comfort simulation for the whole vehicle under random road setting.
In the test with random road setting, the test speed was divided into eight levels which from 10 km/h to 80 km/h. Simulations were conducted with each speed value in different levels respectively. Under test with random road setting, the weighted RMS acceleration of the seat in the , and directions were used as evaluation indexes;
(2) Pulsing road setting.
In the pulsing road setting (40 mm×400 mm triangle bumps) test, the vehicle ran over the bumps with speed of 40 km/h and the maximum acceleration of the seat in the direction was used as an evaluation index.
(3) Main simulation parameters.
The ride comfort of vehicle with full load was analyzed in this paper. The front axle wheel span was 2,057 mm and the rear axle wheel span 1,830 mm. At full load, the axle weight of No. 1 axle was 6,000 kg, 11,500 kg for No. 2 axle and 8,500 kg for No. 3 axle. The rear axle wheel span was 1,830 mm. The relevant parameters of the suspension and cab are shown in Table 1 and Table 2.
Fig. 1Front suspension model
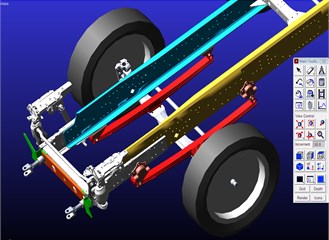
Fig. 2Rear suspension model
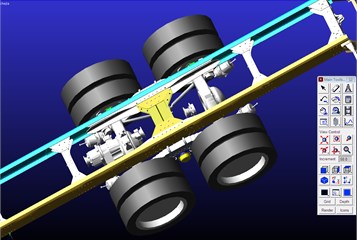
Fig. 3Overall vehicle simulation model
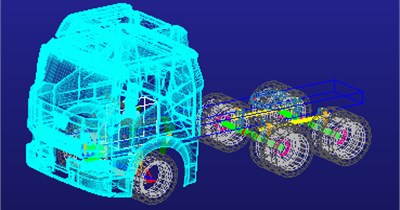
Table 1Parameters of suspension system
Property | Parameter | Unit |
Rigidity of front suspension | 544 | N/mm |
Damping of front suspension | 9.3 N | N/(mm/s) |
Lateral stability of front suspension | 1445 | Nm/deg |
Rigidity of front suspension spring | 1116 | N/mm |
Damping of rear suspension | 7.5 | N/(mm/s) |
Lateral stability of rear suspension | 8551 | Nm/deg |
Rigidity of the tire | 845 | N/mm |
4. Analysis of calculation results
We can get related weighted RMS acceleration and acceleration power spectral density curve by simulating with established model and processing the simulation results with ADAMS/post-processing.
The weighted RMS acceleration aw was the final index to judge the ride comfort of the vehicle, which reflected the degree of comfort of the driver. The weighted RMS accelerations of the seat at three directions under random road setting from 10 km/h to 80 km/h were shown in Table 3.
Table 2Parameters of the cab
Vertical rigidity of front suspension | 57 N/mm | Single | |||
Vertical damping of front suspension of the cab | Restoring resistance (N) | 516 | 1343 | 2462 | 3351 |
Compression resistance (N) | 151 | 392 | 782 | 1163 | |
Speed (m/s) | 0.052 | 0.13 | 0.26 | 0.39 | |
Vertical rigidity of rear suspension of the cab | 41 N/mm | Single | |||
Vertical damping of rear suspension of the cab | Restoring resistance (N) | 390 | 1014 | 1859 | 2530 |
Compression resistance (N) | 114 | 343 | 590 | 780 | |
Speed (m/s) | 0.05 | 0.13 | 0.26 | 0.39 | |
Gross mass of the cab | 1232 kg | – | |||
Gross mass of the seat | 52 kg | – | |||
Table 3Calculation results under random road setting
Speed (km/h) | Weighted RMS acceleration of the seat in the direction (m/s2) | Weighted RMS acceleration of the seat in the direction (m/s2) | Weighted RMS acceleration of the seat in the direction (m/s2) |
10 | 0.24 | 0.032 | 0.056 |
20 | 0.36 | 0.046 | 0.052 |
30 | 0.53 | 0.064 | 0.06 |
40 | 0.63 | 0.076 | 0.07 |
50 | 0.65 | 0.083 | 0.075 |
60 | 0.7 | 0.095 | 0.084 |
70 | 0.72 | 0.097 | 0.091 |
80 | 0.76 | 0.19 | 0.1 |
Under the random road setting, the calculation results of weighted RMS acceleration of the seat in the , and directions were shown in Table 3. Under random road setting, when the speed changed from 10 km/h to 80 km/h, the weighted RMS acceleration of the seat in the direction increased constantly. However, the increasing trend slowed down after 40 km/h. At 80 km/h, the acceleration of the seat in the Z direction reached the peak 0.76 m/s2, the acceleration of the seat in the direction reached the peak 0.19 m/s2, and the acceleration of the seat in the direction reached the peak 0.1 m/s2.
Table 4The relation between total weighted RMS acceleration aw and people’s subjective sensation
Weighted RMS acceleration aw (m/s2) | Weighted vibration level | People’s subjective sensation |
< 0.315 | 110 | No uncomfortableness |
0.315-0.63 | 110-116 | Little bit uncomfortable |
1.5-1.0 | 114-120 | Relatively uncomfortable |
0.8-1.6 | 118-124 | Uncomfortable |
1.25-2.5 | 112-128 | Quite uncomfortable |
> 2.0 | 126 | Extremely uncomfortable |
From Table 4, we could see that when the total weighted RMS acceleration 0.315-0.63 m/s2, people would feel a little bit uncomfortable. When the speed was in range 40 km/h from 80 km/h, the total weighted RMS acceleration aw was between 1.25 and 2.5 m/s2, so people would feel quite uncomfortable.
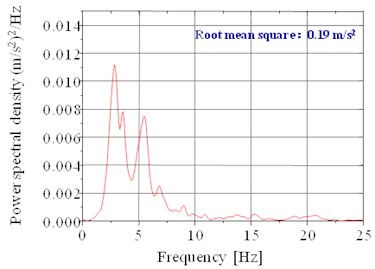
Fig. 4 shows the acceleration of the seat in the direction under random setting when the speed is 80 km/h. In the ride comfort test under random setting, the maximum acceleration of the seat in the direction was 2.5 m/s2. Fig. 5 shows the acceleration auto-power spectral density on the floor beneath the driver's feet. The maximum weighted RMS acceleration of the direction seat was 0.19 m/s2. The maximum frequency of acceleration auto-power spectral density was 3.1 Hz, which corresponded to the peak value of 0.011 (m/s2)2.
Fig. 6 shows the acceleration of the seat in the direction under random setting when the speed is 80 km/h. The maximum acceleration of the seat in the direction was 0.62 m/s2. Fig. 7 shows the acceleration power spectral density of the cab seat in the direction under random setting when the speed is 80 km/h. The maximum weighted RMS acceleration of the seat in the direction was 0.19 m/s2 when the speed was 80 km/h. The maximum frequency of acceleration power spectral density was 3.1 Hz, which corresponded to the peak value of 0.011 (m/s2)2.
Fig. 4Acceleration of the seat in the Z direction under random setting when the speed is 80 km/h
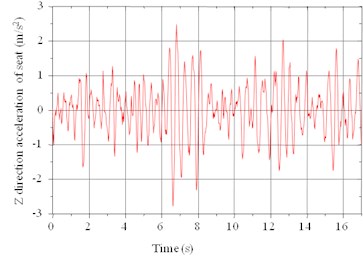
Fig. 5Acceleration power spectral density of the seat in the Z direction under random setting when the speed is 80 km/h
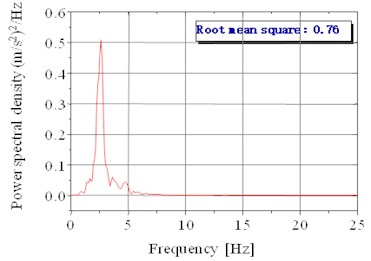
Fig. 6The acceleration of the seat in the X direction under random setting when the speed is 80 km/h
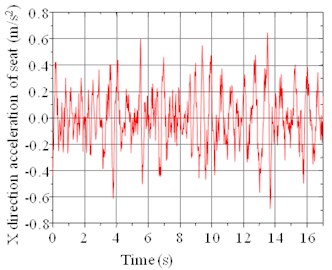
Fig. 7The acceleration power spectral density of the seat in the X direction under random setting when the speed is 80 km/h
From Fig. 8 and Fig. 9, we can see that at a random setting, when the speed was 80 km/h, the maximum acceleration of the seat in the direction was 0.5 m/s2. The maximum weighted RMS acceleration of the seat in the direction was 0.14 m/s2 at a random setting when the speed was 80 km/h. The maximum frequency of acceleration power spectral density was 0.1 Hz, which corresponded to the peak value of 0.0044 (m/s2)2.
4.1. Calculation results under pulsing road setting when the speed is 40 km/h
When the vehicle is driving on the road, it may run over obstacles which will generate great vibration of the vehicle in the form of pulse. Therefore, a road with obstacles can be called as pulsing road. Pulsing input can intensify the instantaneous vibration of the vehicle and impair the comfort of the driver and the passengers. Therefore, it’s necessary to stimulate the ride comfort of vehicle on with random inputs pulsing road surface.
According to “Method of running test – Automotive ride comfort” [11], a pulsing pavement with triangular bumps was modeled which the height is 40 mm and the length is 400 mm. The vehicle ran over the bumps at a speed of 40 km/h. And the vertical acceleration curve of the vehicle body, that is to say, the time history of the seat acceleration in the direction under pulsing setting when the speed is 40 km/h, as shown in Fig. 10.
Fig. 8The acceleration of the seat in the Y direction under random setting when the speed is 80 km/h
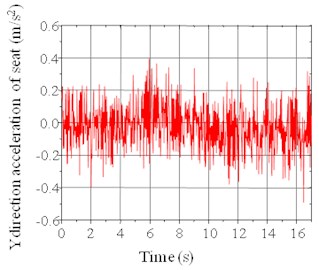
Fig. 9The acceleration power spectral density of the seat in the Y directionunder random setting when the speed is 80 km/h
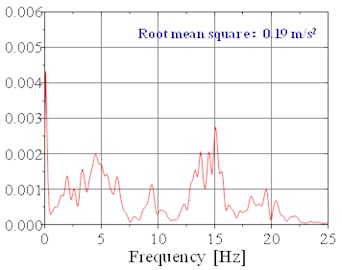
Fig. 10Time history of acceleration of the cab floor under pulsing road setting when the speed is 40 km/h
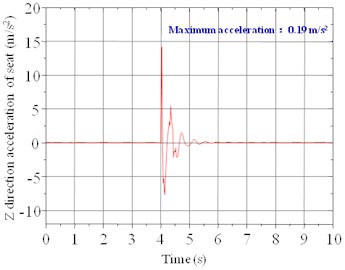
From Fig. 10, we can see that the vertical acceleration of the vehicle body increased obviously when the vehicle ran over the bumps. According to the health impact assessment criterion stipulated in ISO 2631, when the maximum acceleration passed by pulsing road to the passengers via the seat was larger than 43.02 m/s2, it was harmful for their health; while when the value was less than 31.44 m/s2, there was no harm to the health. If this value was between 31.44 s2 and 43.02 s2, it would cause certain harm to the health of passengers [12]. As can be seen from the figure, the time history of the cab floor acceleration was 4 s, and when the speed was 40 km/h, the maximum acceleration of the seat under pulsing setting was 14.13 m/s2, which was far less than 31.44 m/s2.Therefore, the ride comfort of this vehicle was very good.
5. Conclusions
In this research, a whole vehicle simulation model was established, including front and rear suspension systems, cab suspension, tires, vehicle body, steering system and so on. A random road model and a pulsing road model with triangular bumps were also established. With the simulation and calculation of the virtual prototype under random road setting and pulsing road setting, following data was obtained: the weighted RMS acceleration and power spectral density seat of the tractor cab seat, and the time history of acceleration of the cab floor under the pulsing setting. By comparing the calculated results with the ride comfort, it's found that the sample prototype showed good performance of ride comfort under a random setting at a speed from 10 km/h to 50 km/h, or ran over bumps with the speed of 40 km/h. The vibration of the whole vehicle in reasonable driving period won't bring uncomfortable feeling to the driver, and the impact of the pulsing road won’t generate any harm to the health of the passengers. While when the speed was from 60 km/h to 80 km/h, the driver may feel a little bit uncomfortable due to the vibration of the vehicle when driving at a random setting. In this paper, the fundamental research on the further adjustment and improvement of the suspension system was carried out, and some methods of designing, studying and improving the cab of tractor were proposed.
References
-
Wang Wei, Wang Fe, Zhang Min The comfort evaluation of the cab of the normal semi-trailer. Special Car, Vol. 8, 2012, p. 82-84.
-
Jiang Libiao The present situation and development trend of truck air suspension. Journal of Qiqihar University, Vol. 21, Issue 1, 2005, p. 66-69.
-
Wei Hui, Yang Jing, Chen Bing, et al. Research on the smooth simulation of vehicle based on ADAMS/Car. Development and Innovation of Mechanical and Electrical Products, Vol. 21, Issue 6, 2008, p. 100-102.
-
Pan Gongyu Fundamentals of Automobile Vibration and Its Application. Beijing University Press, 2013.
-
Bao W. N., Chen L. P., Zhang Y. Q., et al. Fuzzy adaptive sliding mode controller for an air spring active suspension. International Journal of Automotive Technology, Vol. 13, Issue 7, 2012, p. 1057-1065.
-
Yin Zhihong, Amir Khajepour, Cao Dongpu, et al. A new pneumatic suspension system with independent stilfness and ride height tuning capabilities. Vehicle System Dynamics, Vol. 50, Issue 12, 2012, p. 1735-1746.
-
Shaohua Wang, Chunfang Yin, Huawei Zhao Matching of suspension damping and air spring based on multi-body dynamic model. IERI Procedia, Vol. 3, 2012, p. 15-21.
-
James Balkwill Performance Vehicle Dynamics. Elsevier, 2018.
-
Emre Sert, Pınar Boyraz Optimization of suspension system and sensitivity analysis for improvement of stability in a midsize heavy vehicle. Engineering Science and Technology, Vol. 20, Issue 3, 2017, p. 997-1012.
-
Anirban Mitra C., Fernandes Elvis, et al. Development and validation of a simulation model of automotive suspension system using MSC-ADAMS. Materials Today: Proceedings, Vol. 5, Issues 2, 2018, p. 4327-4334.
-
GB/T 4970-2009, Vehicle Smoothness Test Method. China National Standardization Administration Committee, National Development and Reform Commission, 2009.
-
Li Huibin, Liu Yabin, Shangguan Yunfei Research on the smooth simulation of heavy truck vehicles based on ADAM S. Heavy Vehicles, Vol. 12, Issue 6, 2007, p. 10-12.
-
Li Cheng, et al. Modeling and simulation analysis of vehicle smoothness based on ADAMS. Journal of Zhengzhou University (Engineering Edition), Vol. 31, Issue 5, 2010, p. 99-103.
-
Liu Xia, et al. Comparative study on the smoothness of lorries based on rear axle air suspension. Journal of Wuhan University of Technology (Traffic Science and Engineering), Vol. 34, Issue 4, 2010, p. 665-668.
About this article

